Predicting My Movie Ratings
Building a simple recommender system was fun, but I wonder: was it a waste of time? Sure, the real treasure was the skills gained along the way1, but what I mean is: would I have been better off just using an existing movie rating site? And if so, which one?
Let’s see.
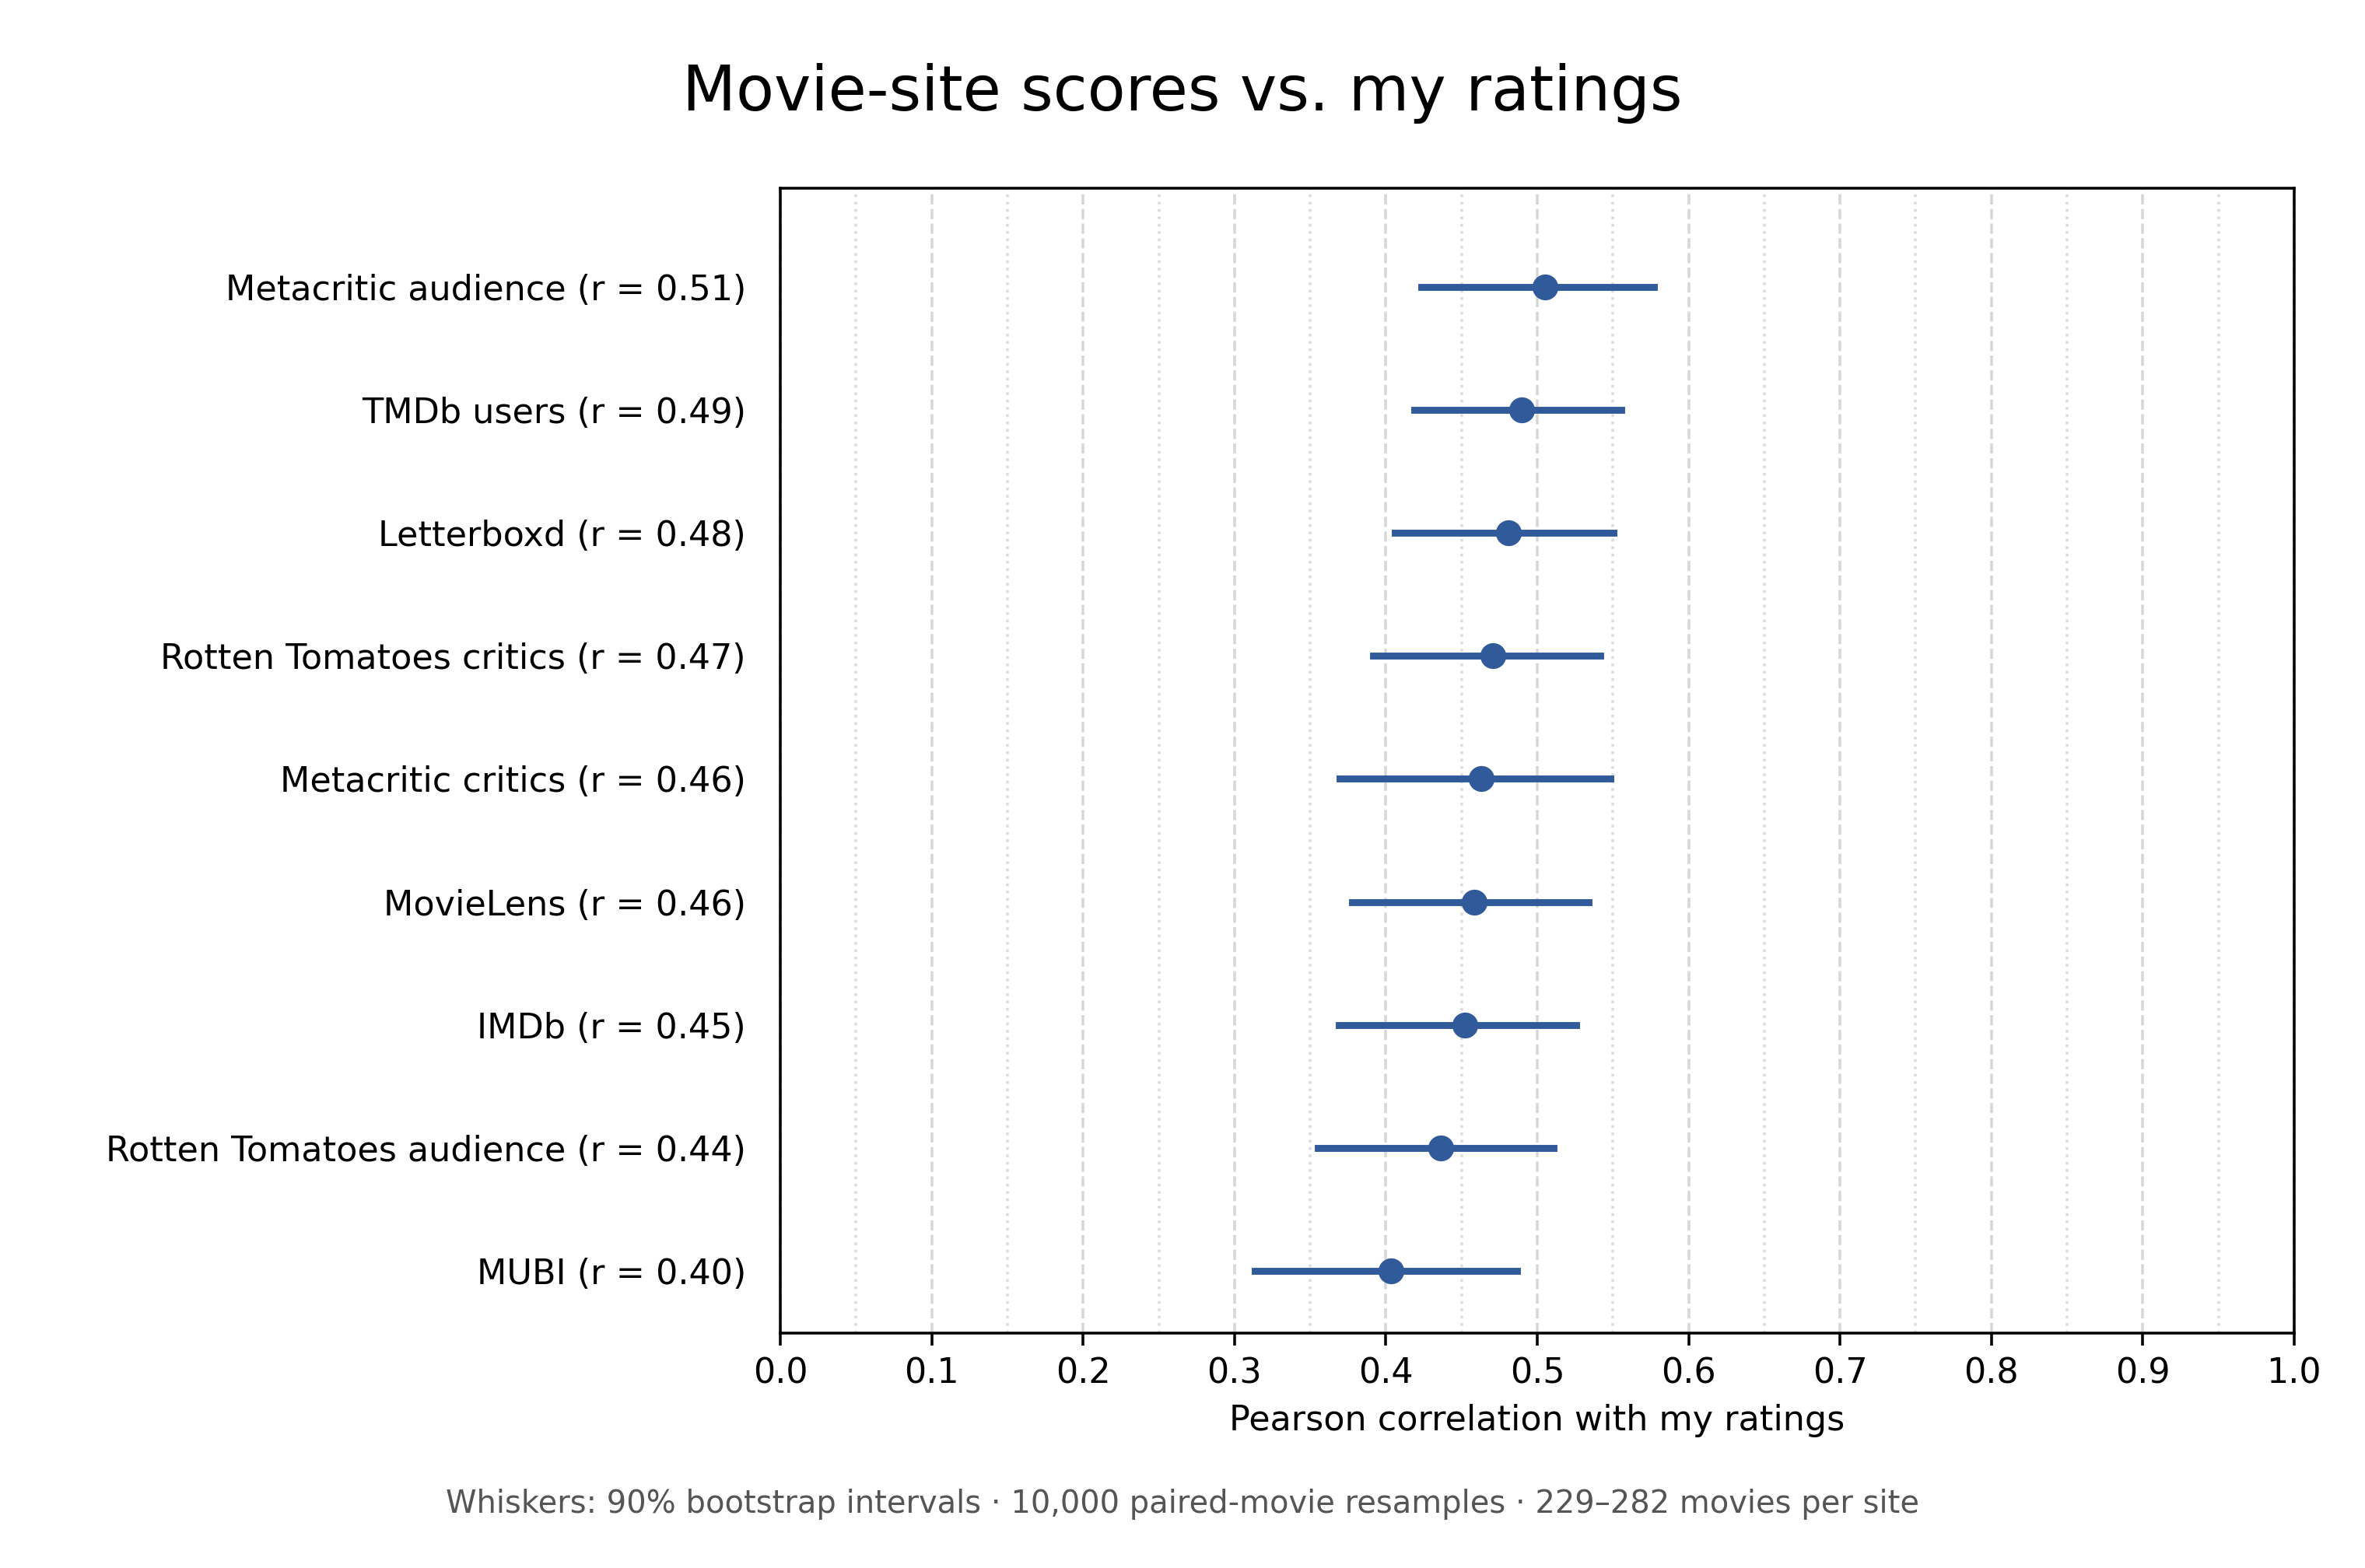
The correlations aren’t great, but they’re not bad either. It’s particularly interesting that they’re all so close. This makes me wonder: what if there’s a latent movie quality factor that each movie site’s ratings capture imperfectly? Then, we might expect the correlation between this latent movie quality and my ratings to be higher, since the latent factor would be less contaminated by ‘noise’. But, alas:
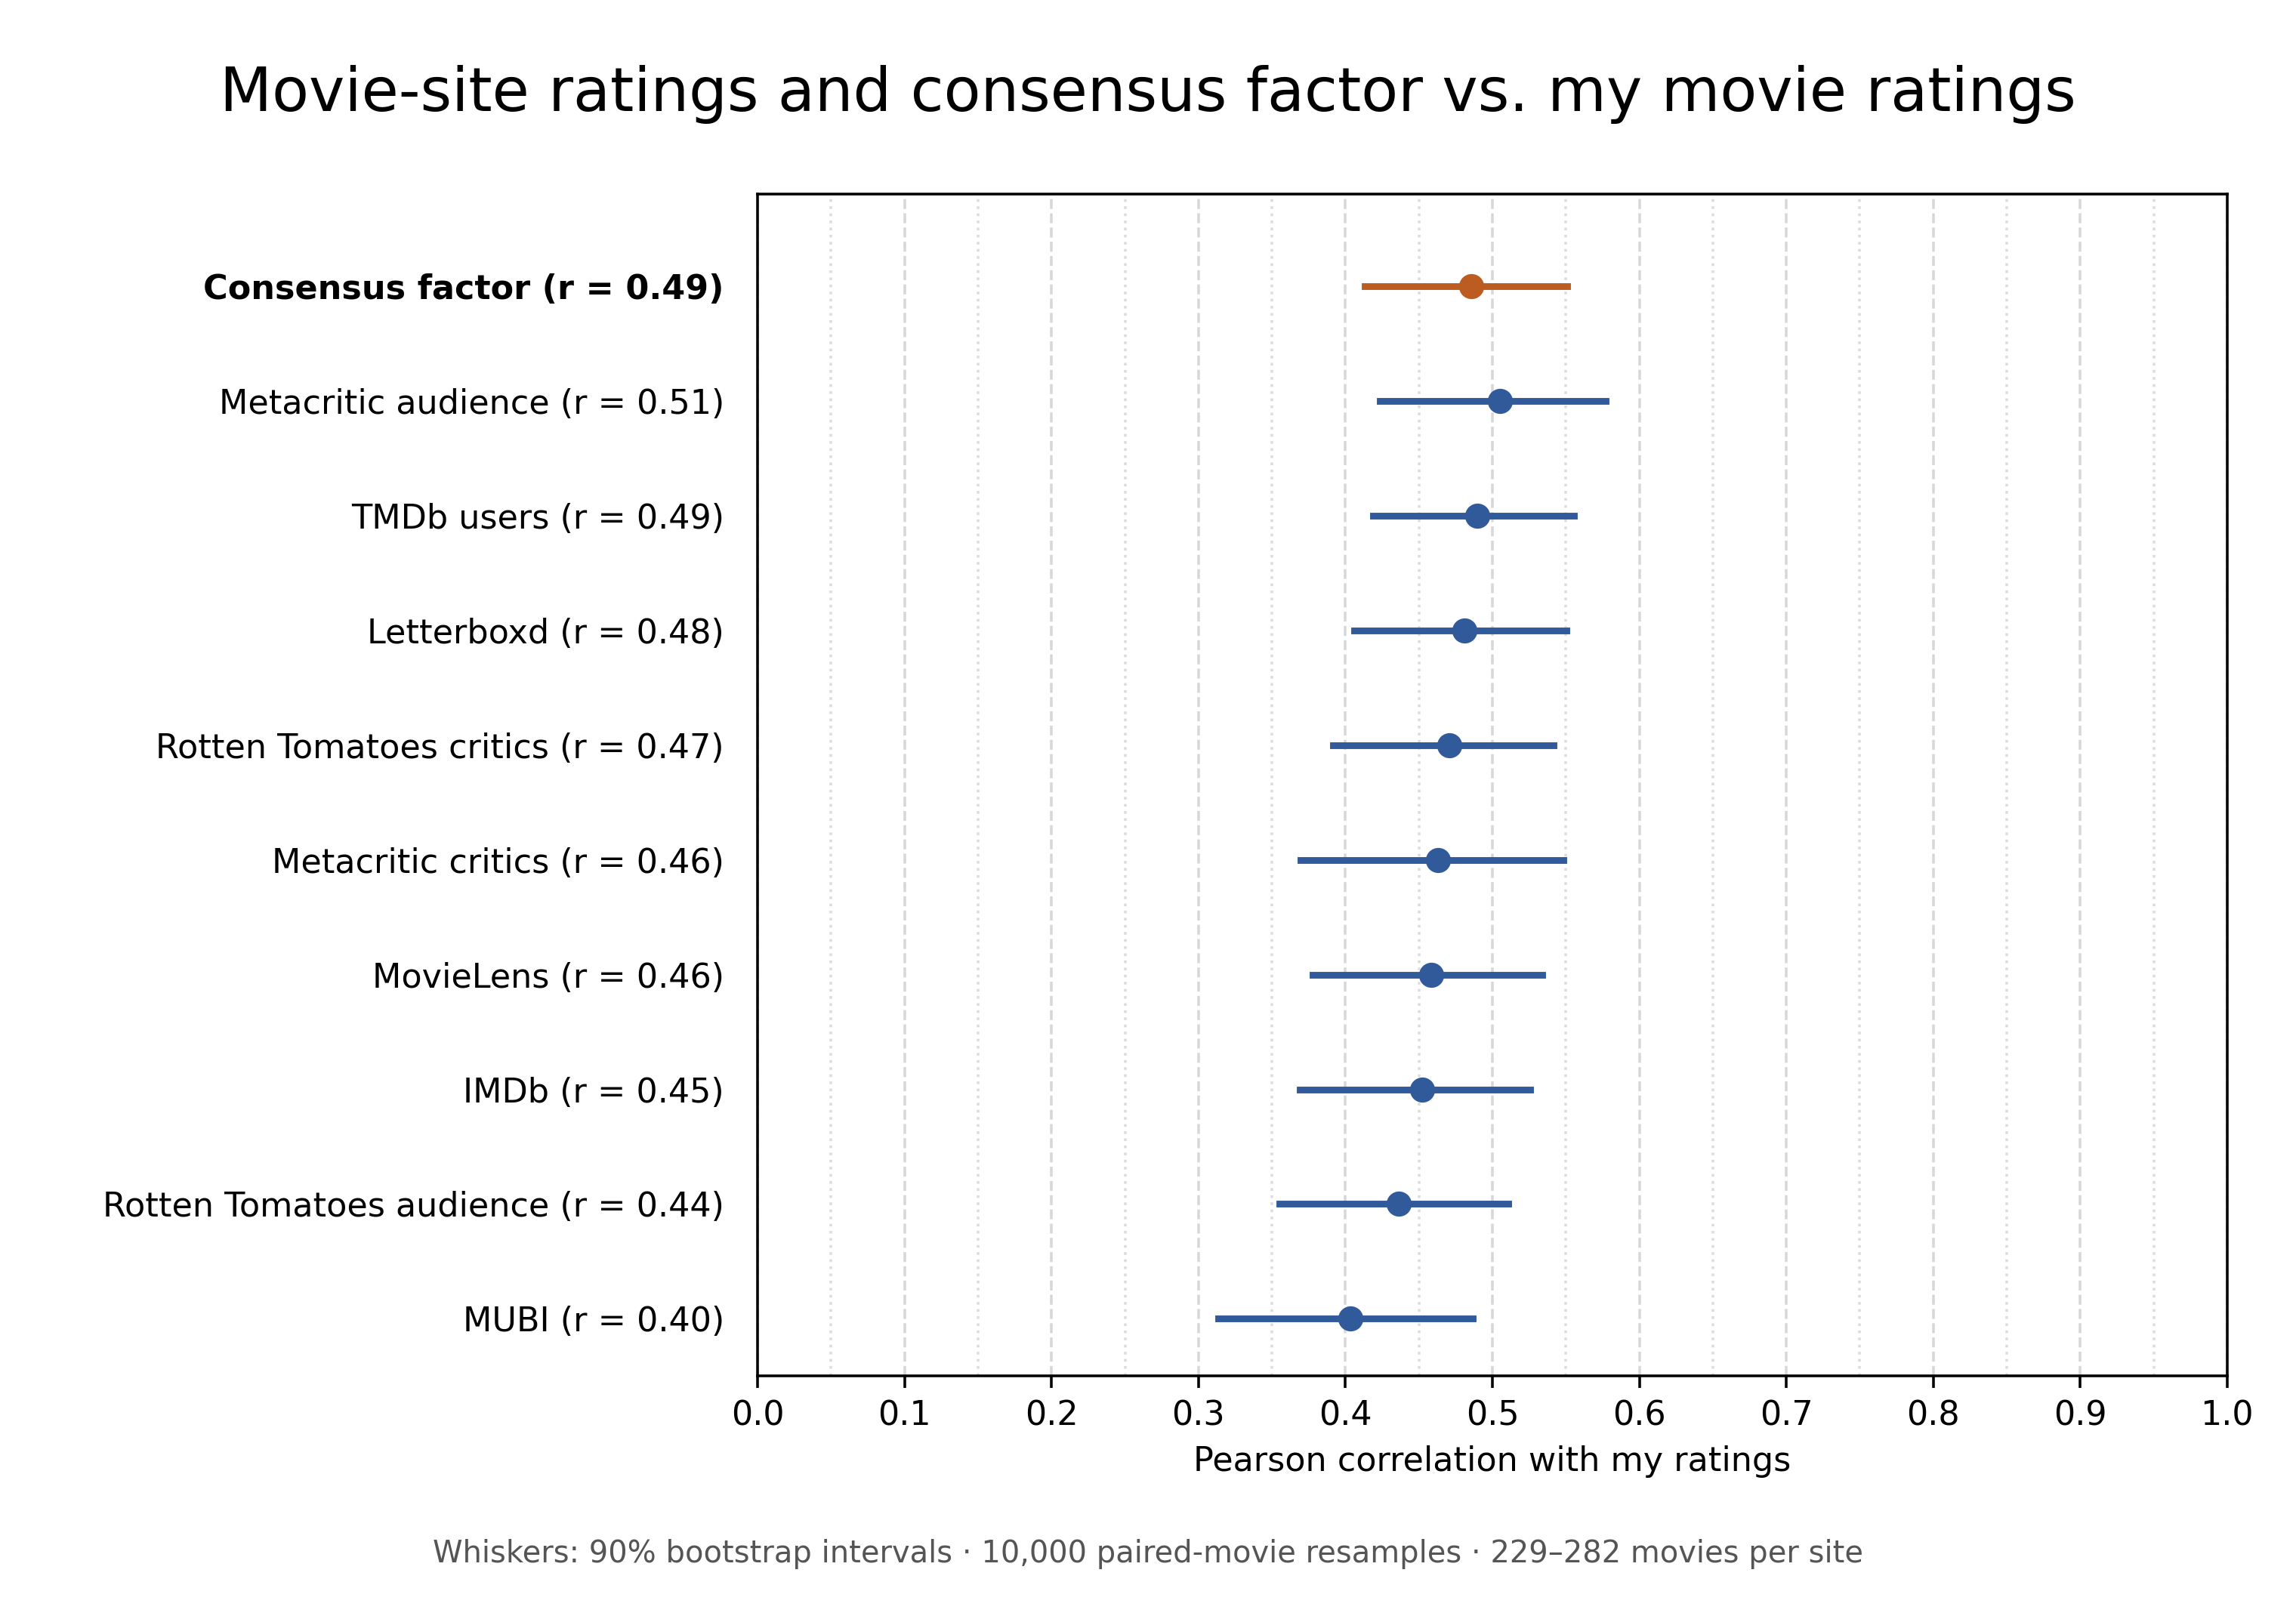
I suppose this shouldn’t be a surprise. A look at the factor structure tells you that the movie-site ratings are very unidimensional (with all loadings >0.8), so there’s not much to be gained by extracting a latent factor. The consensus factor correlates with my ratings at 0.49, barely different from the individual sites.
Still, we need to compare this with the predictions from my own predictors.
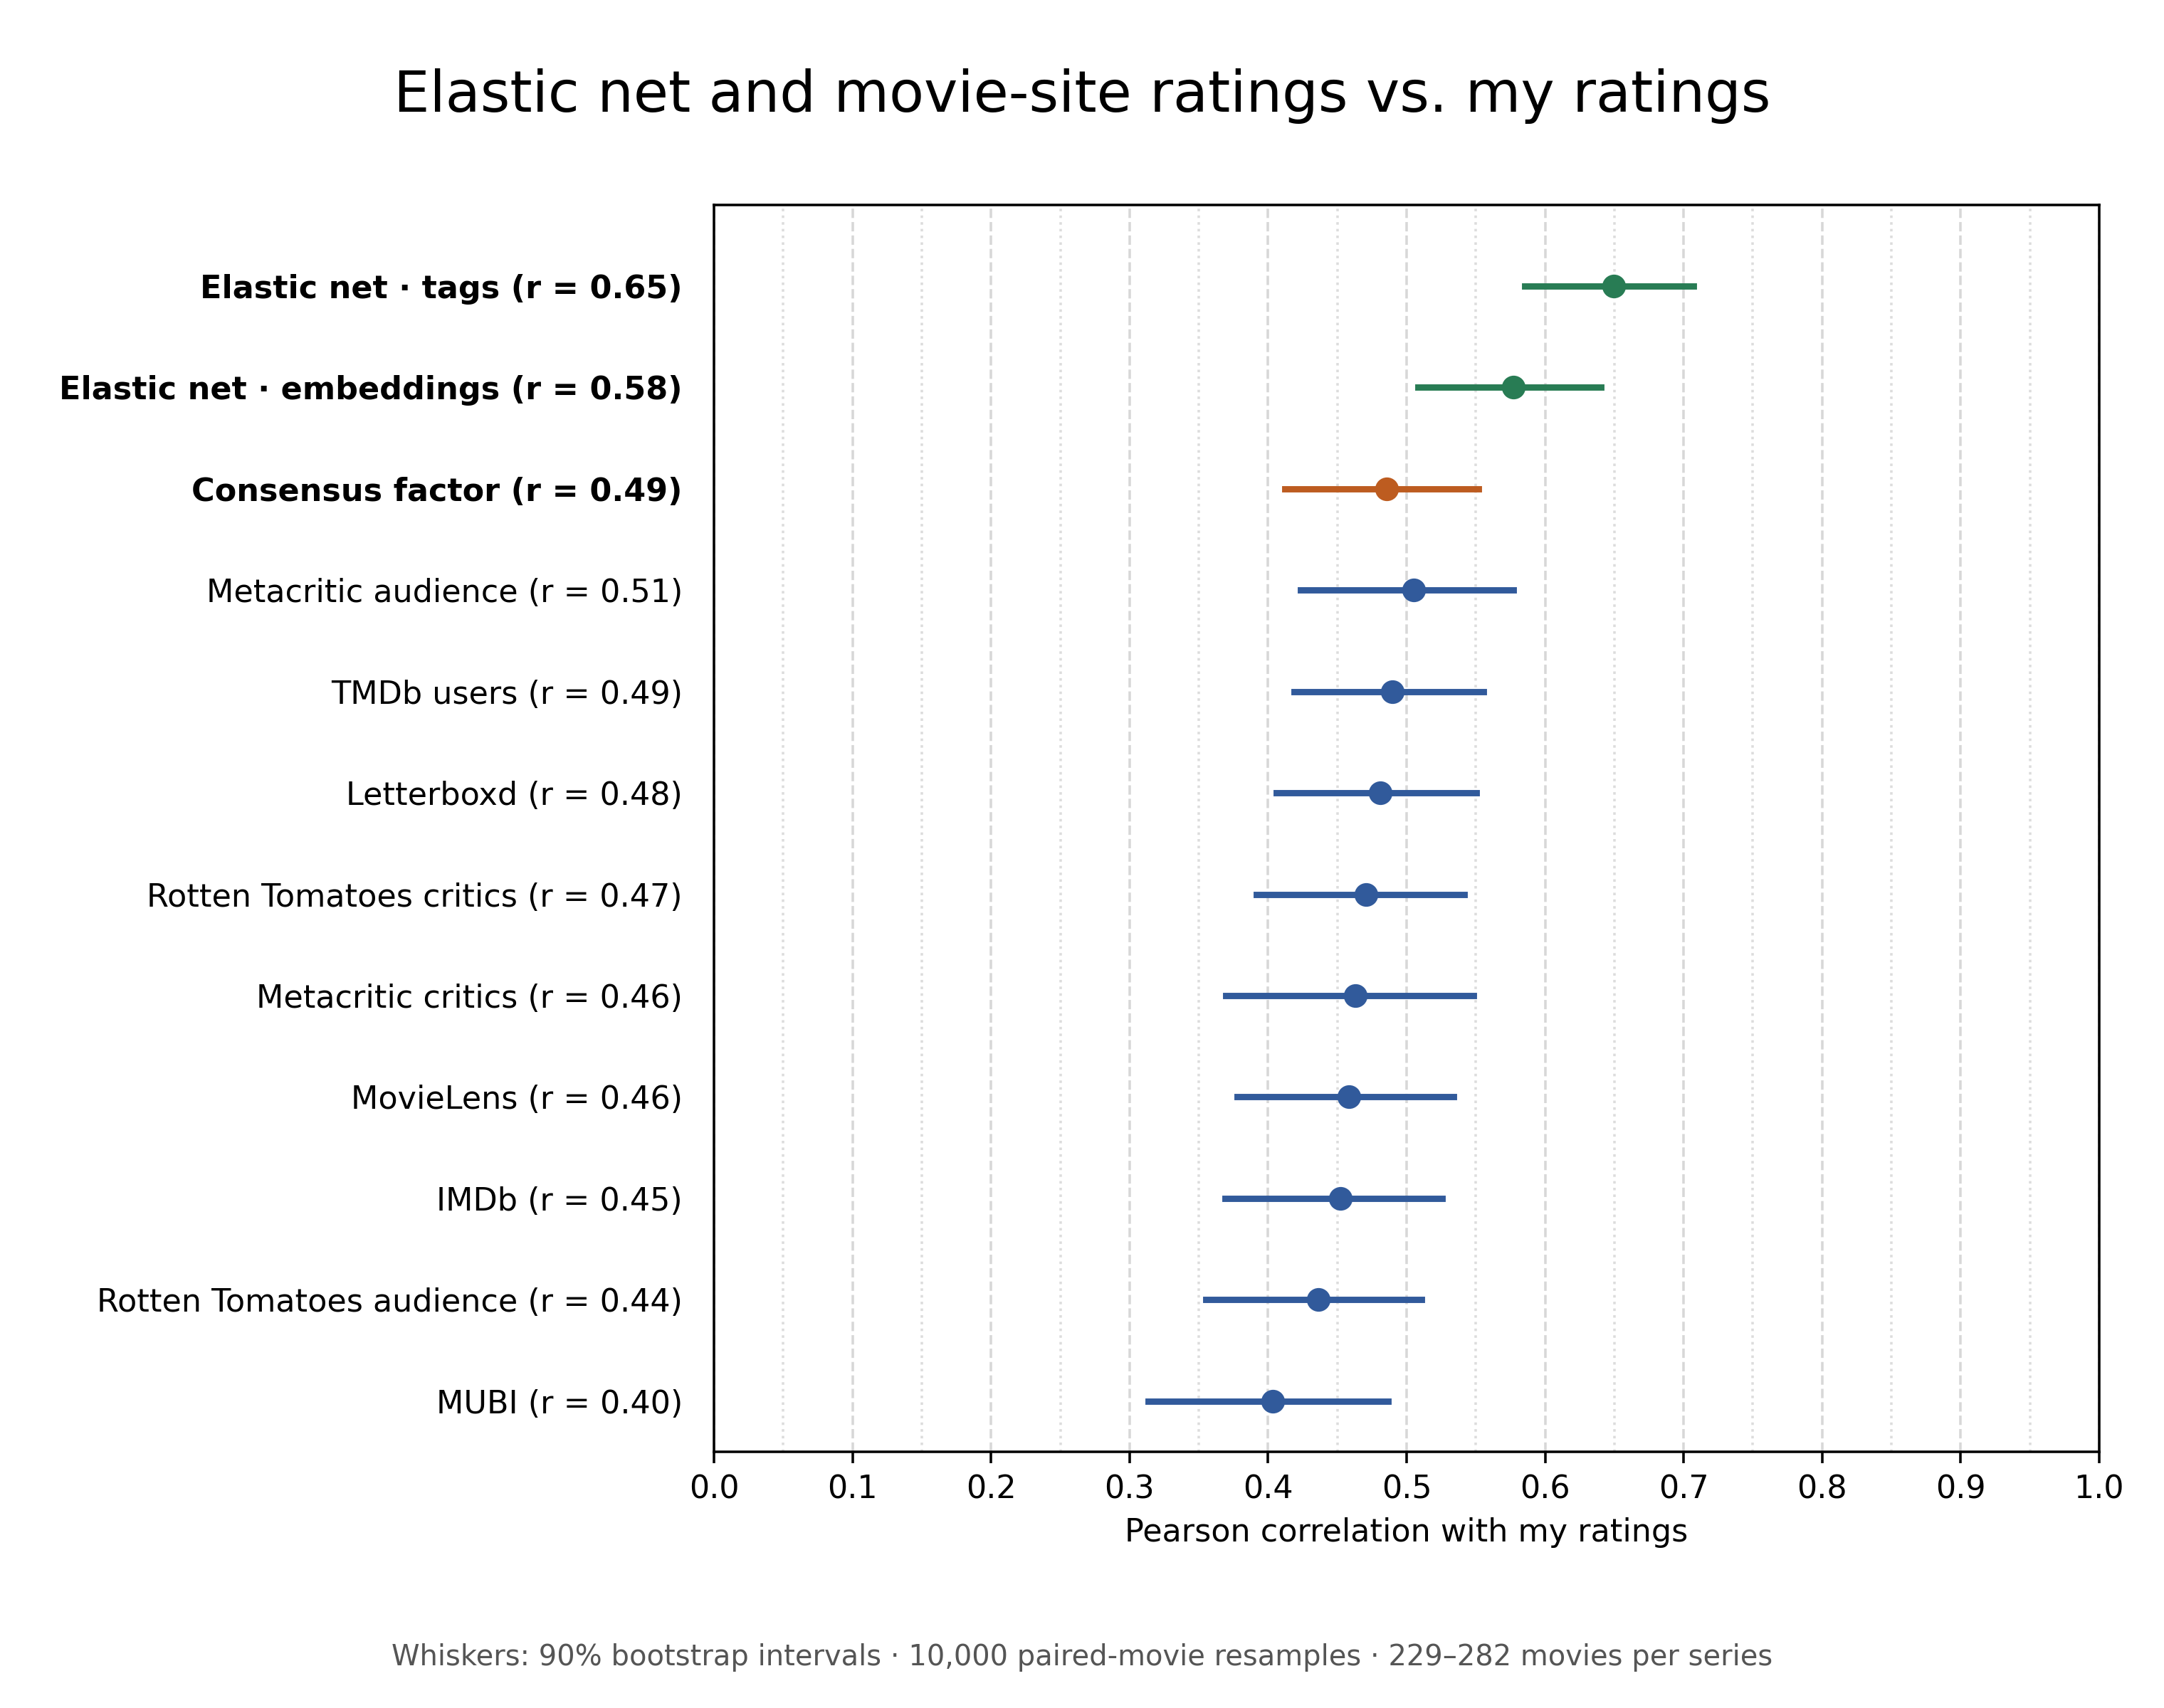
Using elastic net on the embeddings2 I created performs better (r = 0.58), and using all the z-scored tags performs best (r = 0.65). So, it seems I haven’t wasted my time. I can get better personalized predictions than I’d get from movie-site ratings alone.
But how good can they get? We should expect a predictor’s accuracy to increase with the number of movies in the training set, so let’s see how that goes:
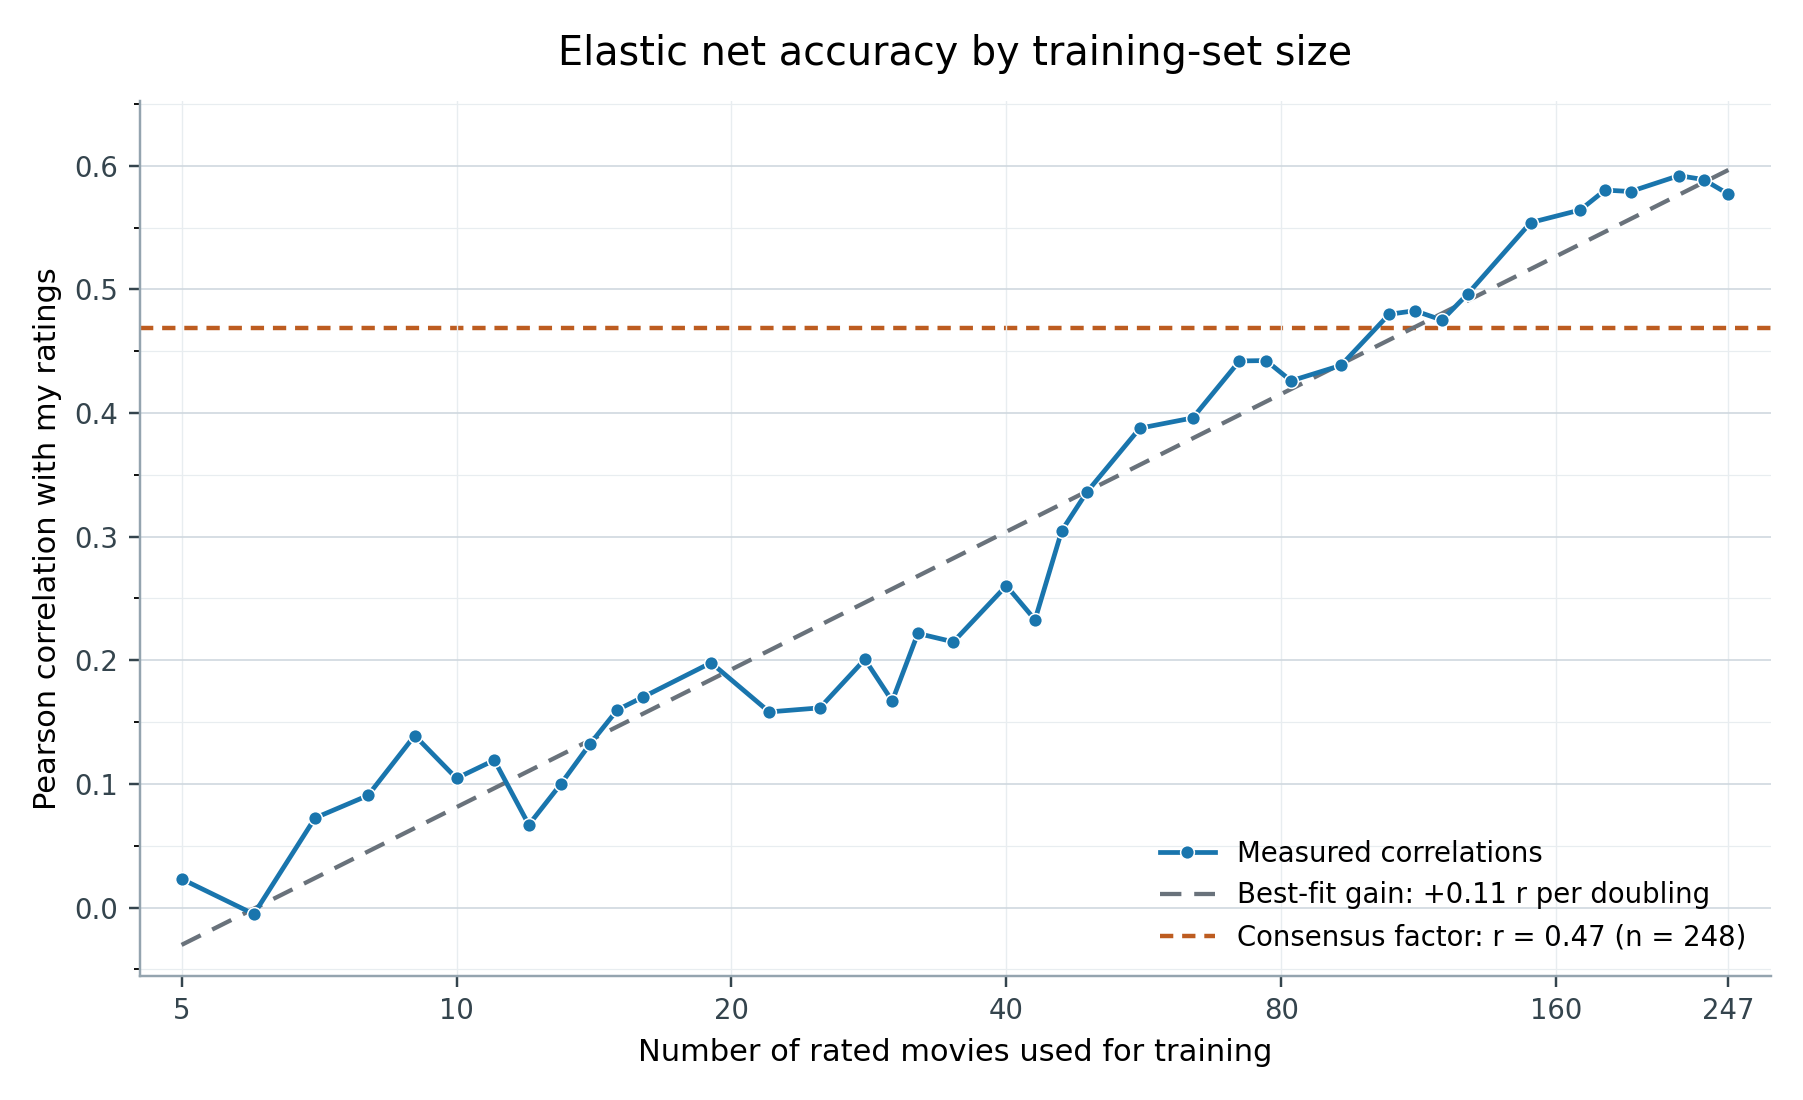
The correlation between the elastic-net predictor’s predictions and my ratings seems to increase by ~0.11 with every doubling of the training-set size. It also seems to overtake the movie-site consensus factor at around ~100 movies (give or take 10). So, I guess if you’ve rated fewer than 100 movies, you might be better off just using movie-site ratings to pick your movies, whereas if you’ve rated more, you can build a personalized predictor that performs better.
However, there’s a problem with this model: it predicts that we’ll get perfect predictions (r = 1) once I’ve rated roughly 3,000 movies. Sure, that is a lot of movies, but even still, perfect prediction? That’s just too much to expect. And yeah, there’s the problem that a linear fit to this data is eventually going to give bad predictions because its outputs are unbounded, while correlations are restricted to [-1, 1] (and given our problem, we shouldn’t really expect negative correlations). But still, one has to wonder: what’s the practical limit?
Tailcalled has a post about playing around with “gendermetricity”, a measure of how much variance in an outcome can, in theory, be explained by a set of masculinity/femininity-related variables. The underlying idea, also used in morphometricity, is more general: given some measure of similarity between observations, we can estimate how much of the variance in an outcome is associated with that similarity.
In our case, we can use the similarity between movies’ MovieLens genome tags to estimate how much of the variance in my ratings is attributable to tag-related differences. Let’s call this tagmetricity. Taking its square root puts it on a correlation-equivalent scale, giving us a rough estimate of how well we could expect to predict my ratings from tags, even with ~infinite training data.
Since I’m using elastic net on z-scored tags, the most relevant similarity measure is the standardized linear kernel. But I’ve included other kernels too, so we can see the limits of different prediction methods:
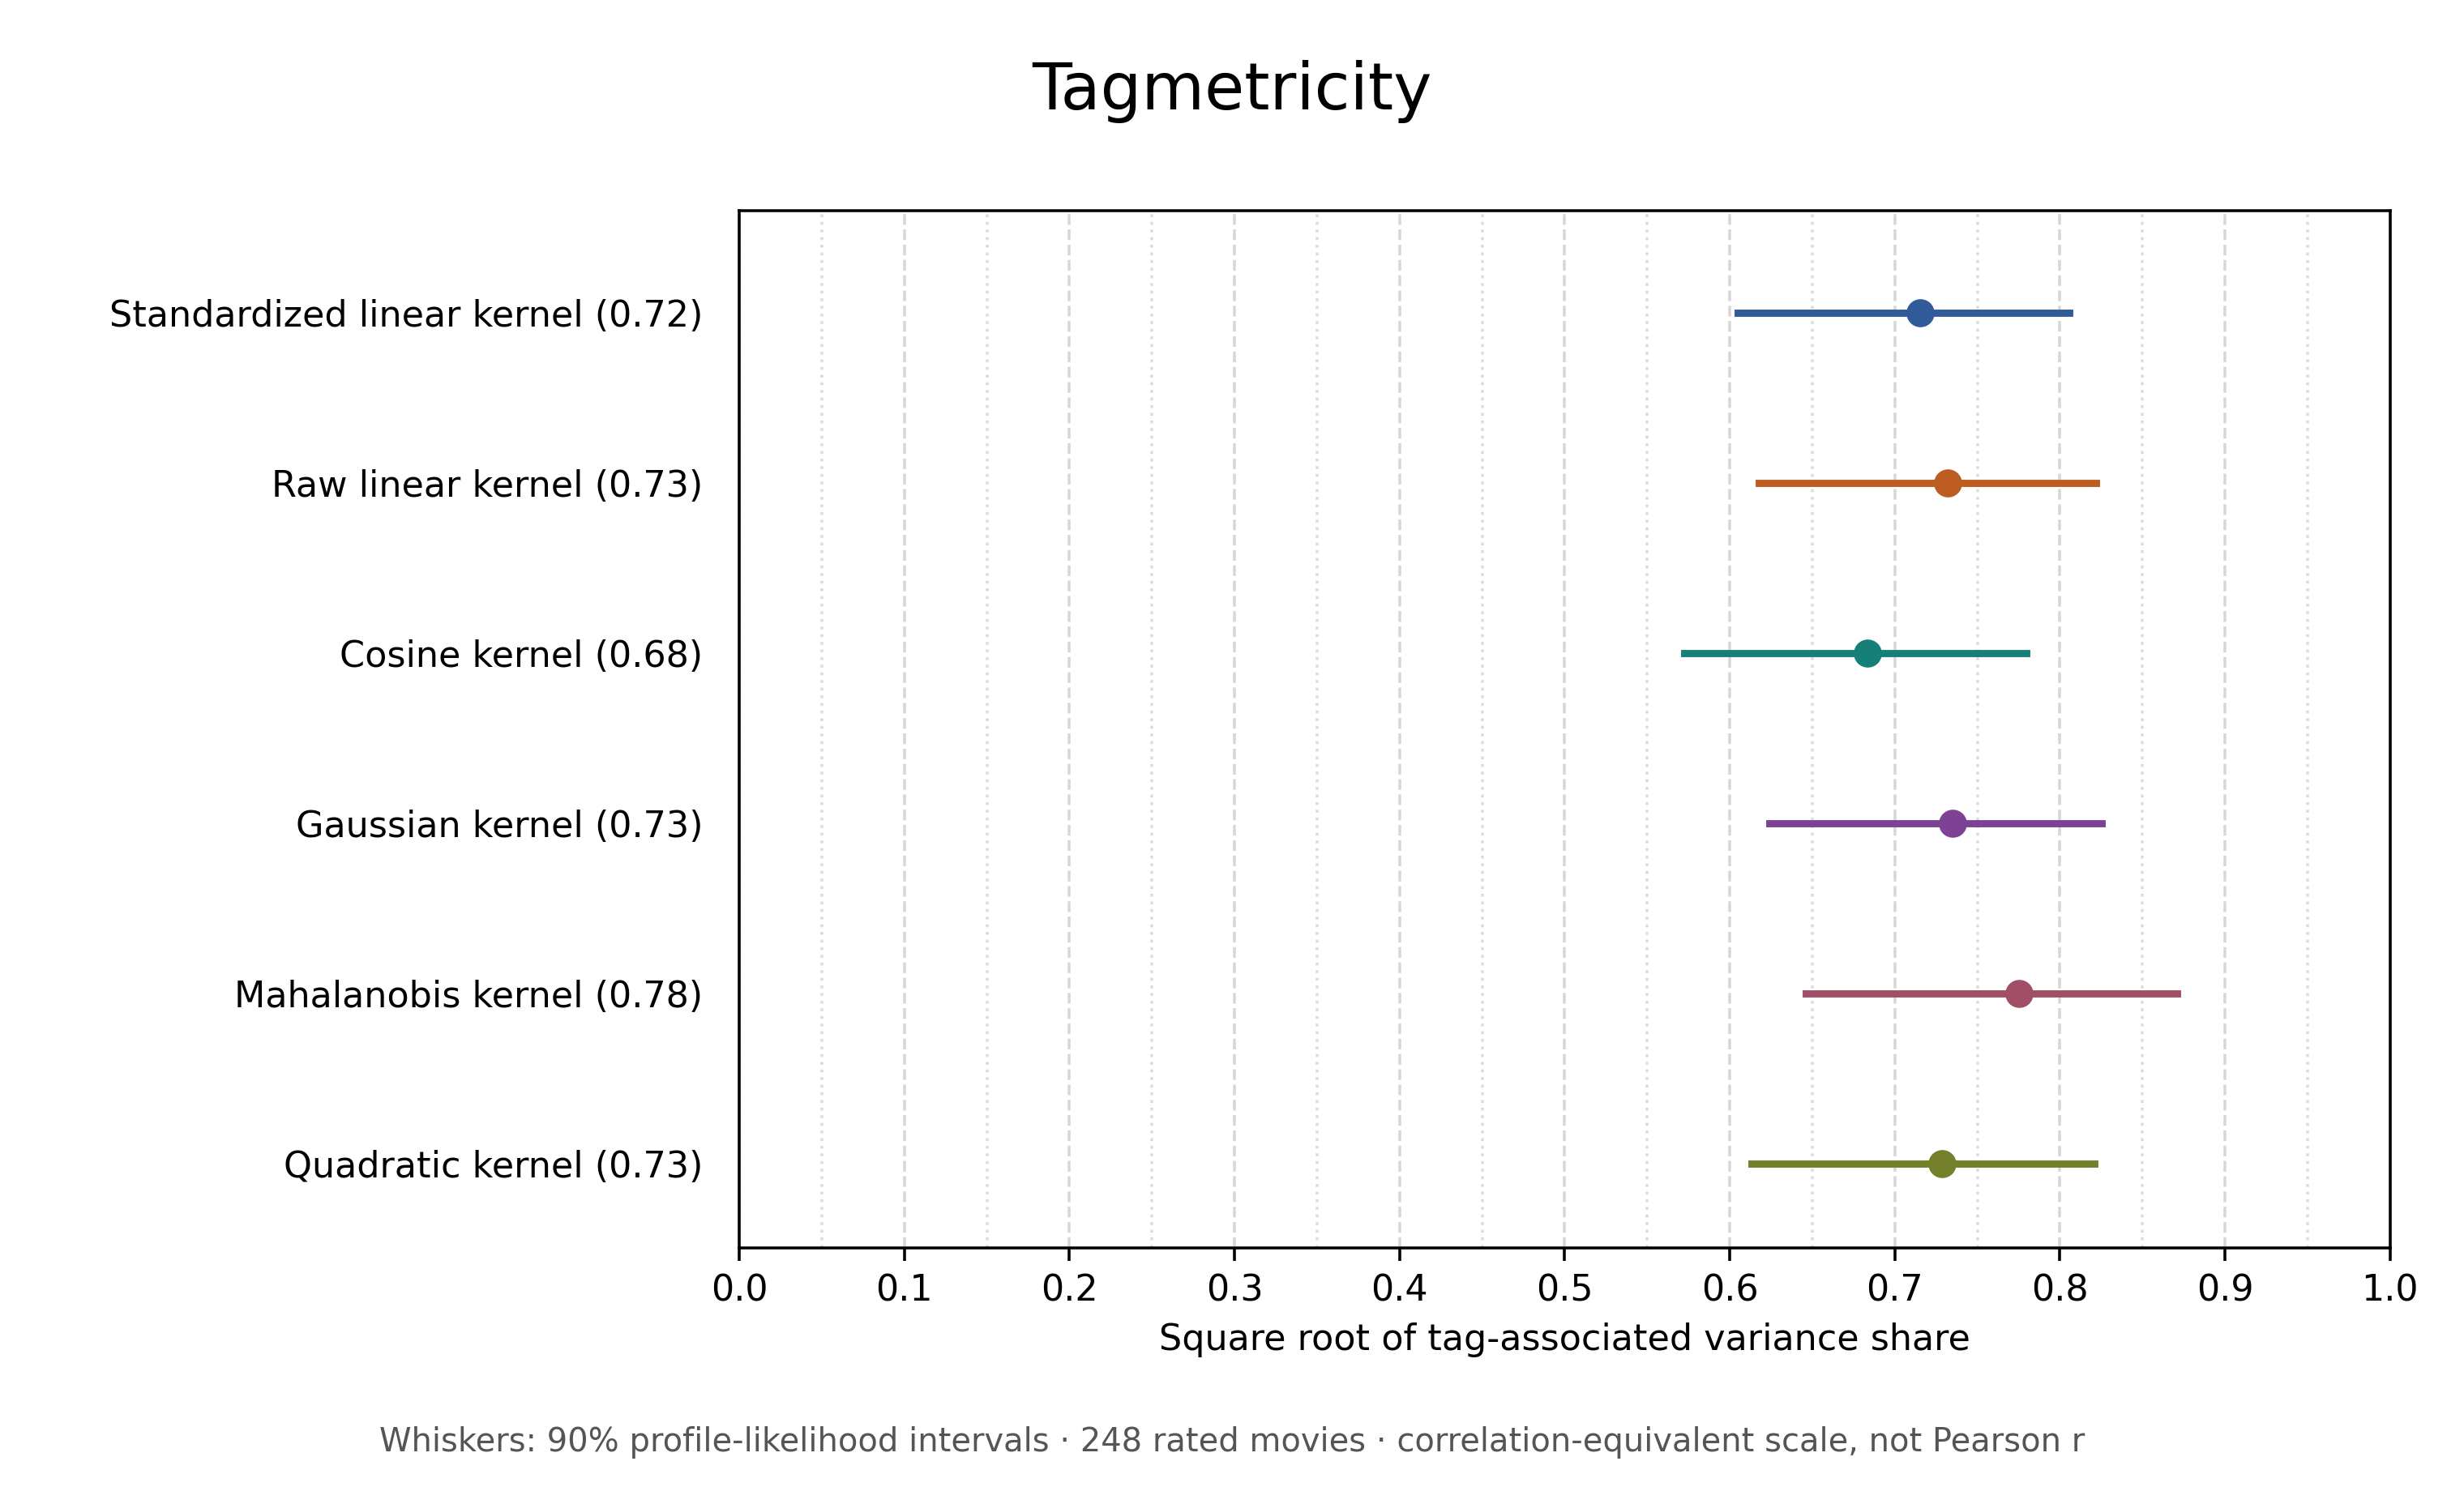
So, the standardized linear kernel gives us an estimate of ~0.72, suggesting that we shouldn’t expect elastic net to get much above that. Other kernels give estimates as high as ~0.78, suggesting there might be somewhat more predictive information available if we use a different prediction method.
Here’s what that looks like compared to the predictors we’ve got so far:
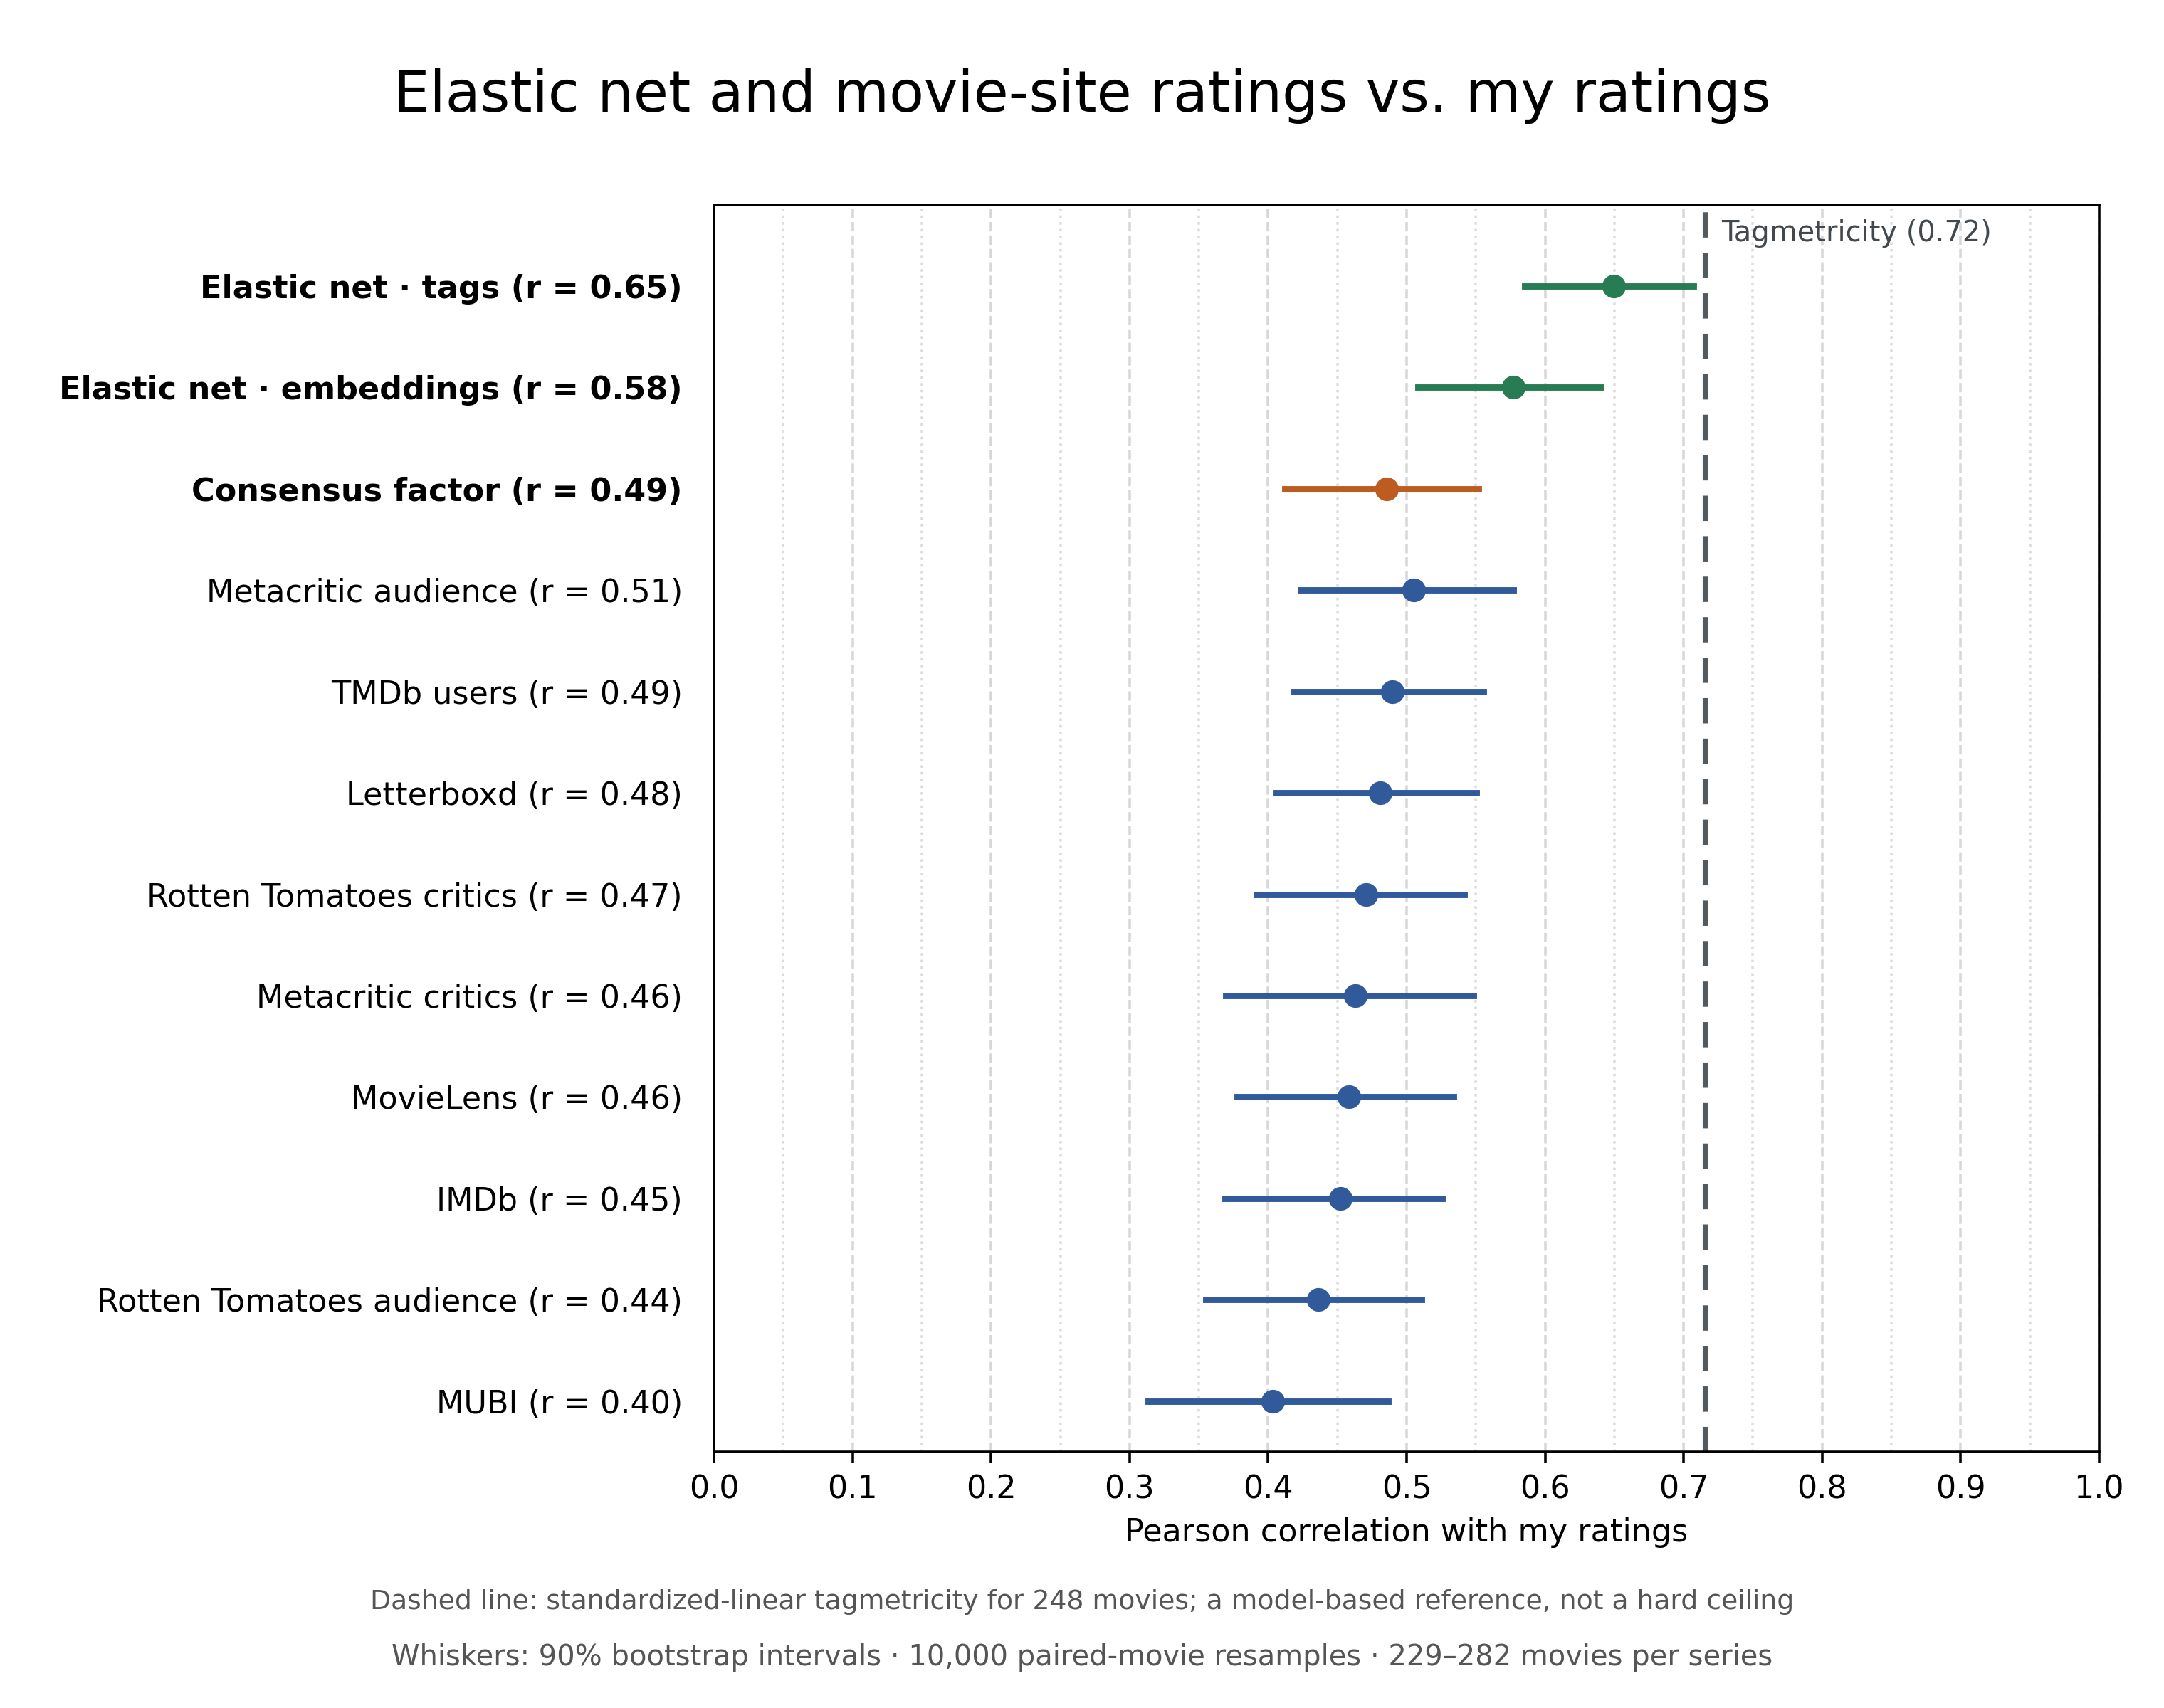
So, it looks like we’ve already squeezed out most of the predictiveness that we can reasonably expect from a linear model using these tags.
I’d be remiss if I didn’t mention AI. Can AI predict how much I’ll like a movie? How does its predictive ability depend on the model and reasoning effort? Let’s see:
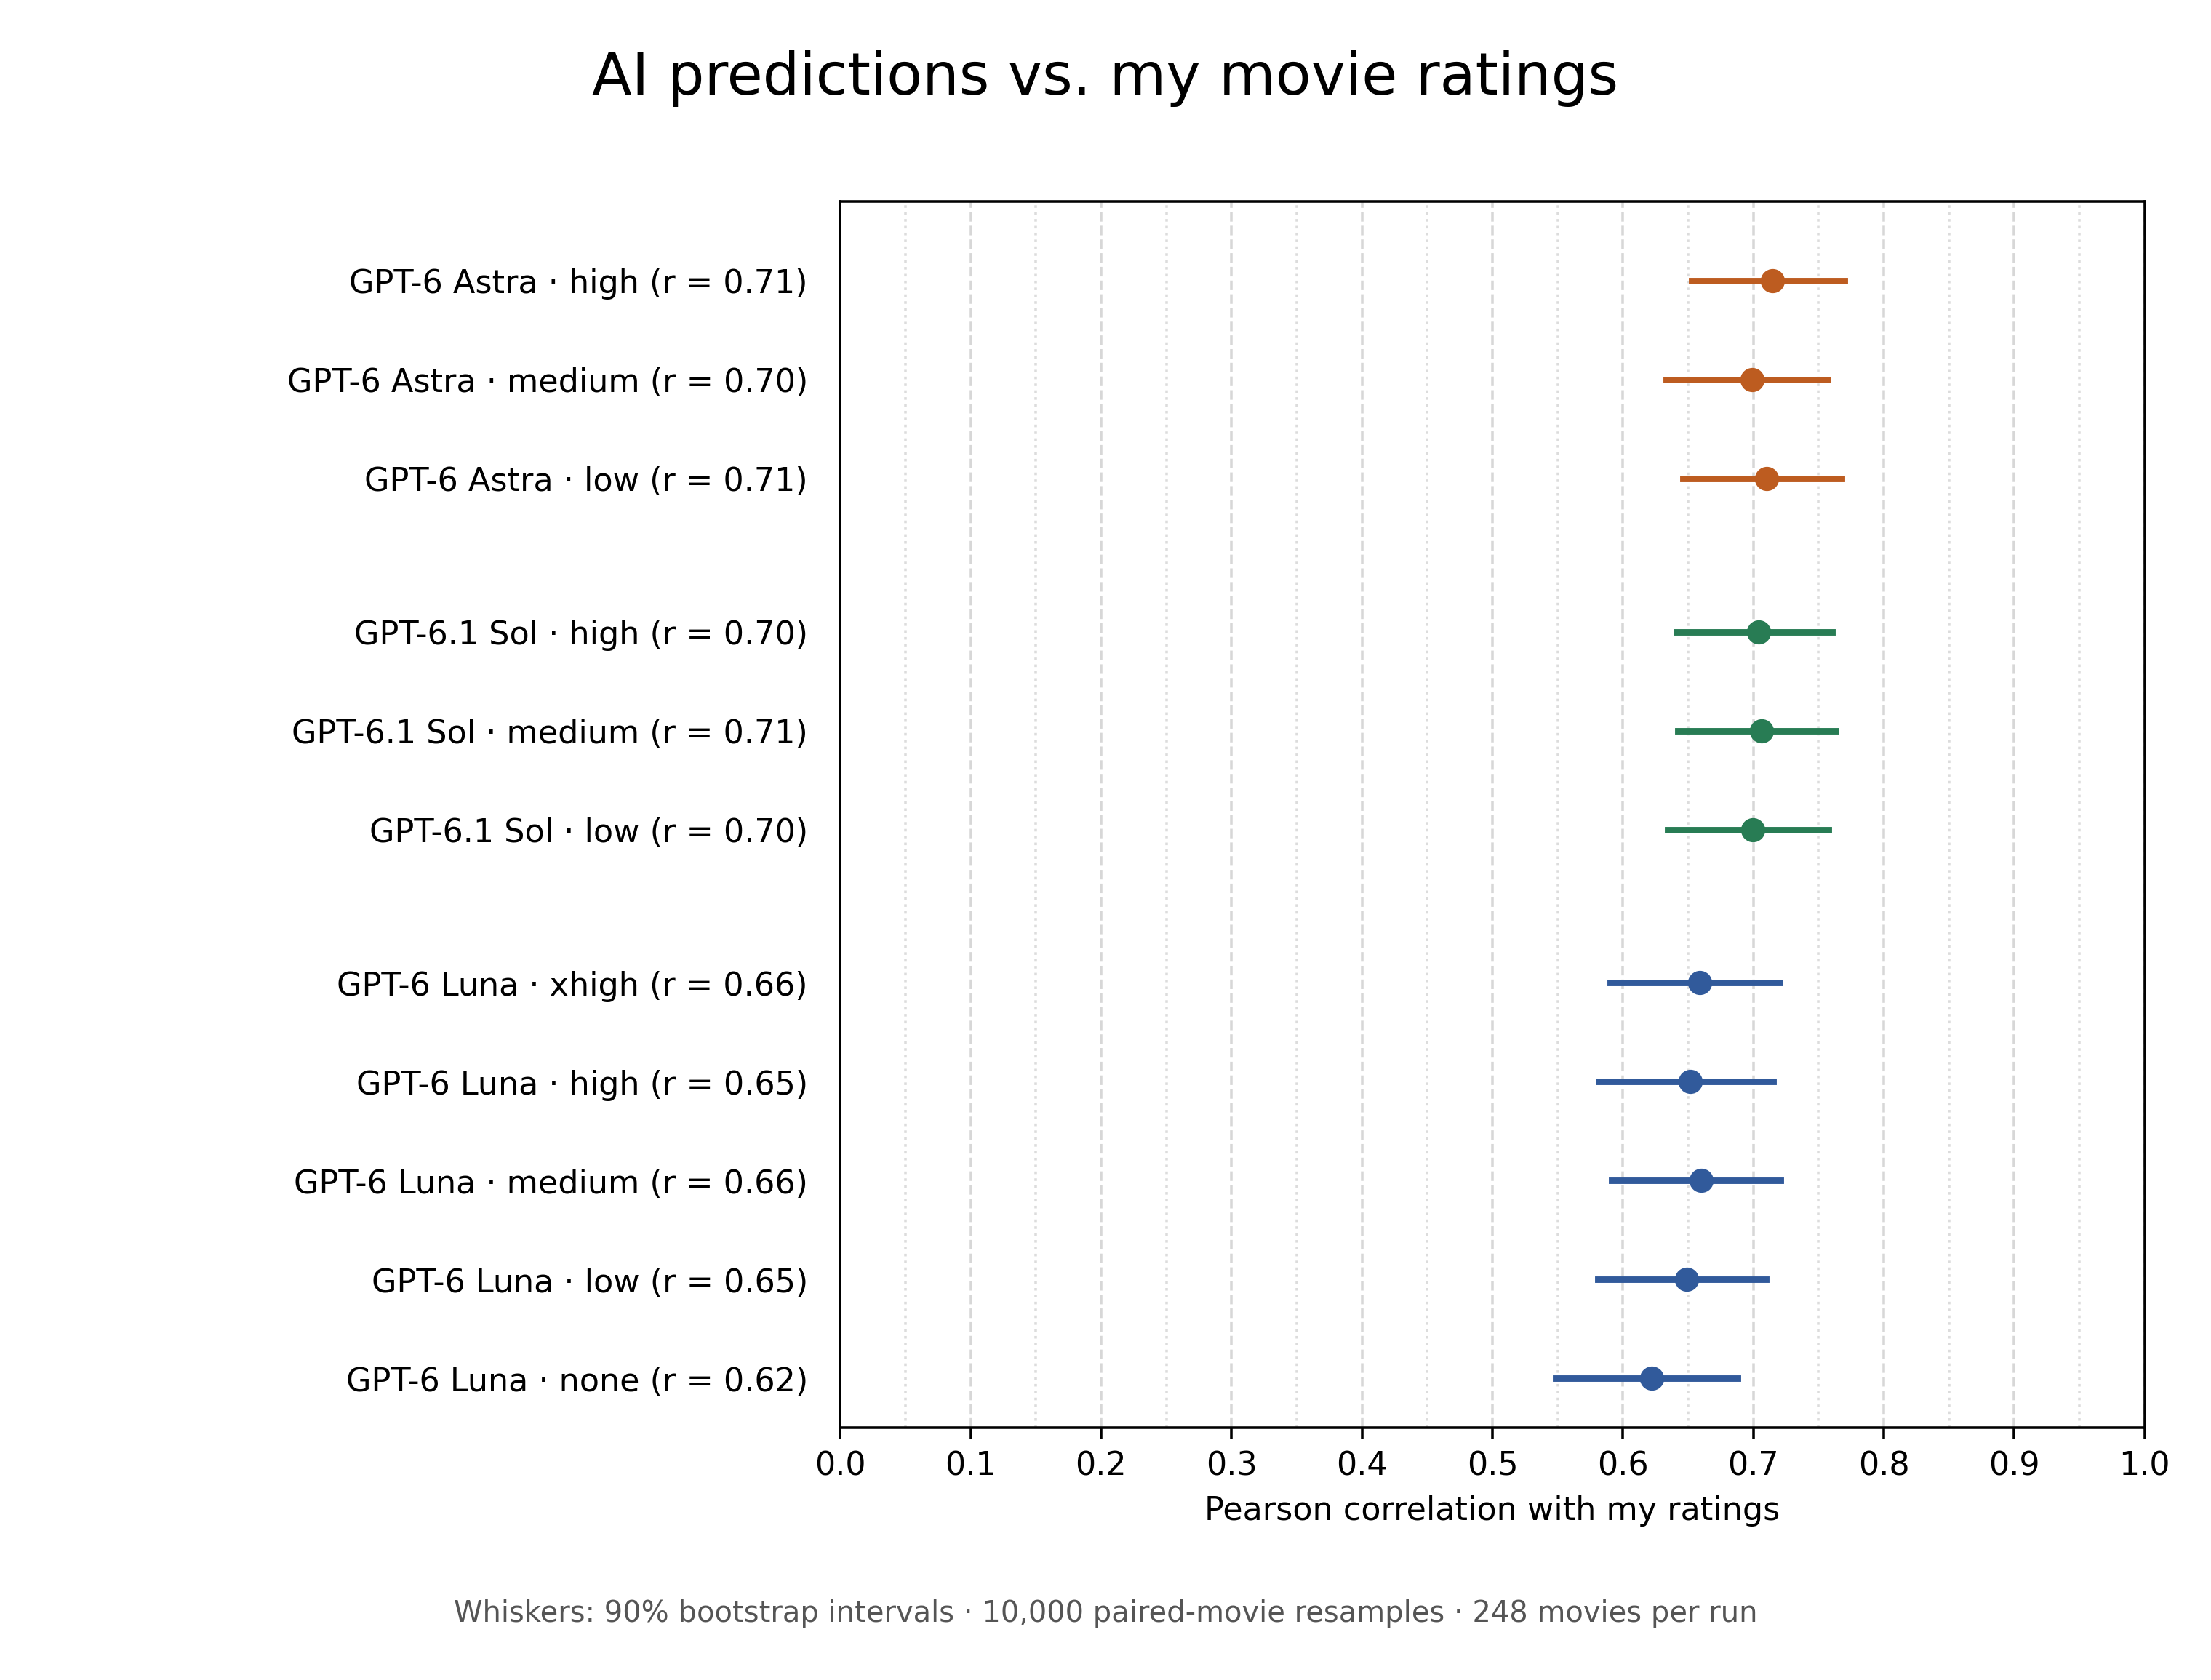
AI is much better at predicting my movie ratings than all the other methods we’ve looked at. But other than Sol and Astra being better than Luna, and Luna with reasoning effort being better than Luna without reasoning effort, it doesn’t seem like anything else matters much; increasing reasoning effort beyond low doesn’t seem to improve performance. Perhaps deep learning has hit a wall. Anyway, here are all the results together:
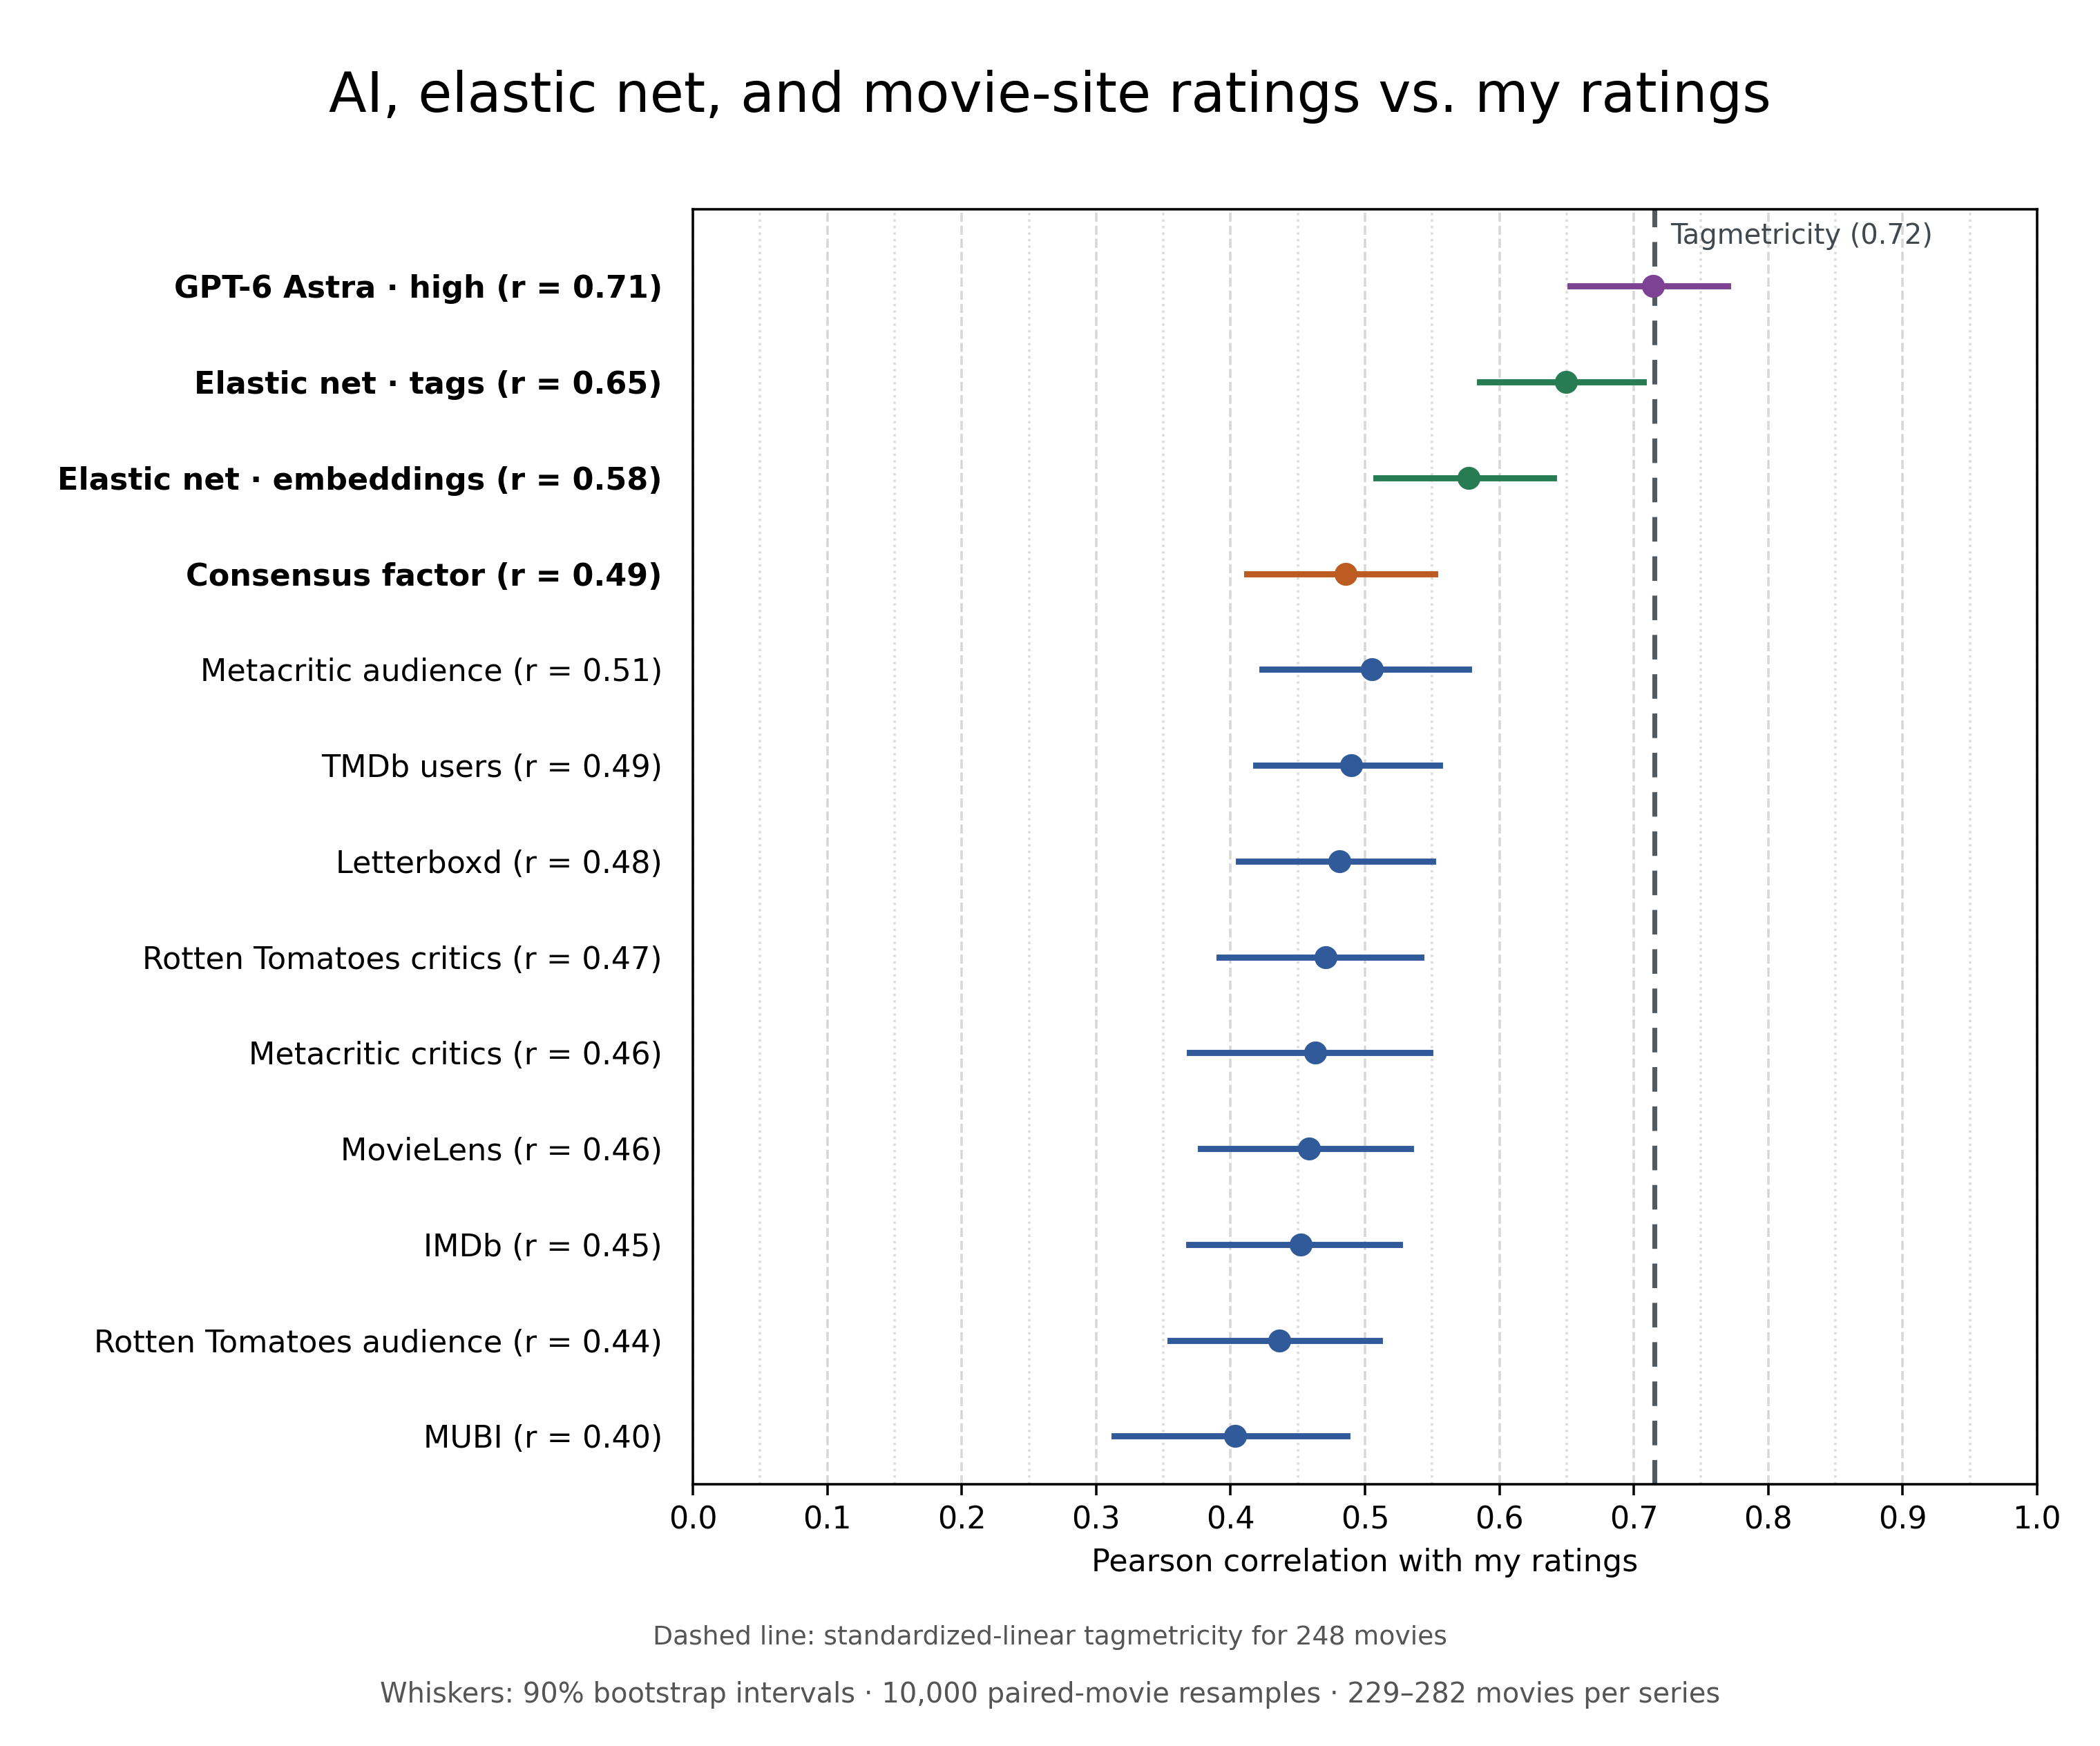
The best-performing OpenAI model is right at the level implied by tagmetricity. It wouldn’t be out of the question for it to exceed that level, since it has more information available to it than just tags. Though I suspect further improvements will be modest, given how little performance seems to vary between the better models or across reasoning-effort levels.
So, was trying to predict which movies I’ll like a waste of time? Yes.
Though elastic net is better than using movie-site ratings, it’s roughly matched by the cheapest model I checked (GPT-6 Luna) and beaten by even GPT-6.1 Sol on low reasoning effort. And while I expect AI’s performance to also depend on how many movies I’ve rated, there’s no particular reason to expect it to be worse than elastic net at an equivalent training-set size. In fact, we should expect it to perform pretty well even with little information about my preferences. After all, it can draw on movie-site ratings, which are already moderately correlated with my preferences, so it should have a decent predictive baseline even before learning much about my tastes.
I suspect this pattern generalizes to other domains. At this point, I really see no reason not to let AI decide what media I consume3. After all, its judgment is superhuman, if not now, then soon. Perhaps it’s time to consider surrendering the rest of my free will to the AIs.
Appendix
Factor Structure of Movie Site Ratings
As previously mentioned, movie-site ratings are strongly unidimensional. With nine movie-site rating measures, the first factor explains 85% of the variance. So, what does the factor structure look like, and what are the factor loadings?
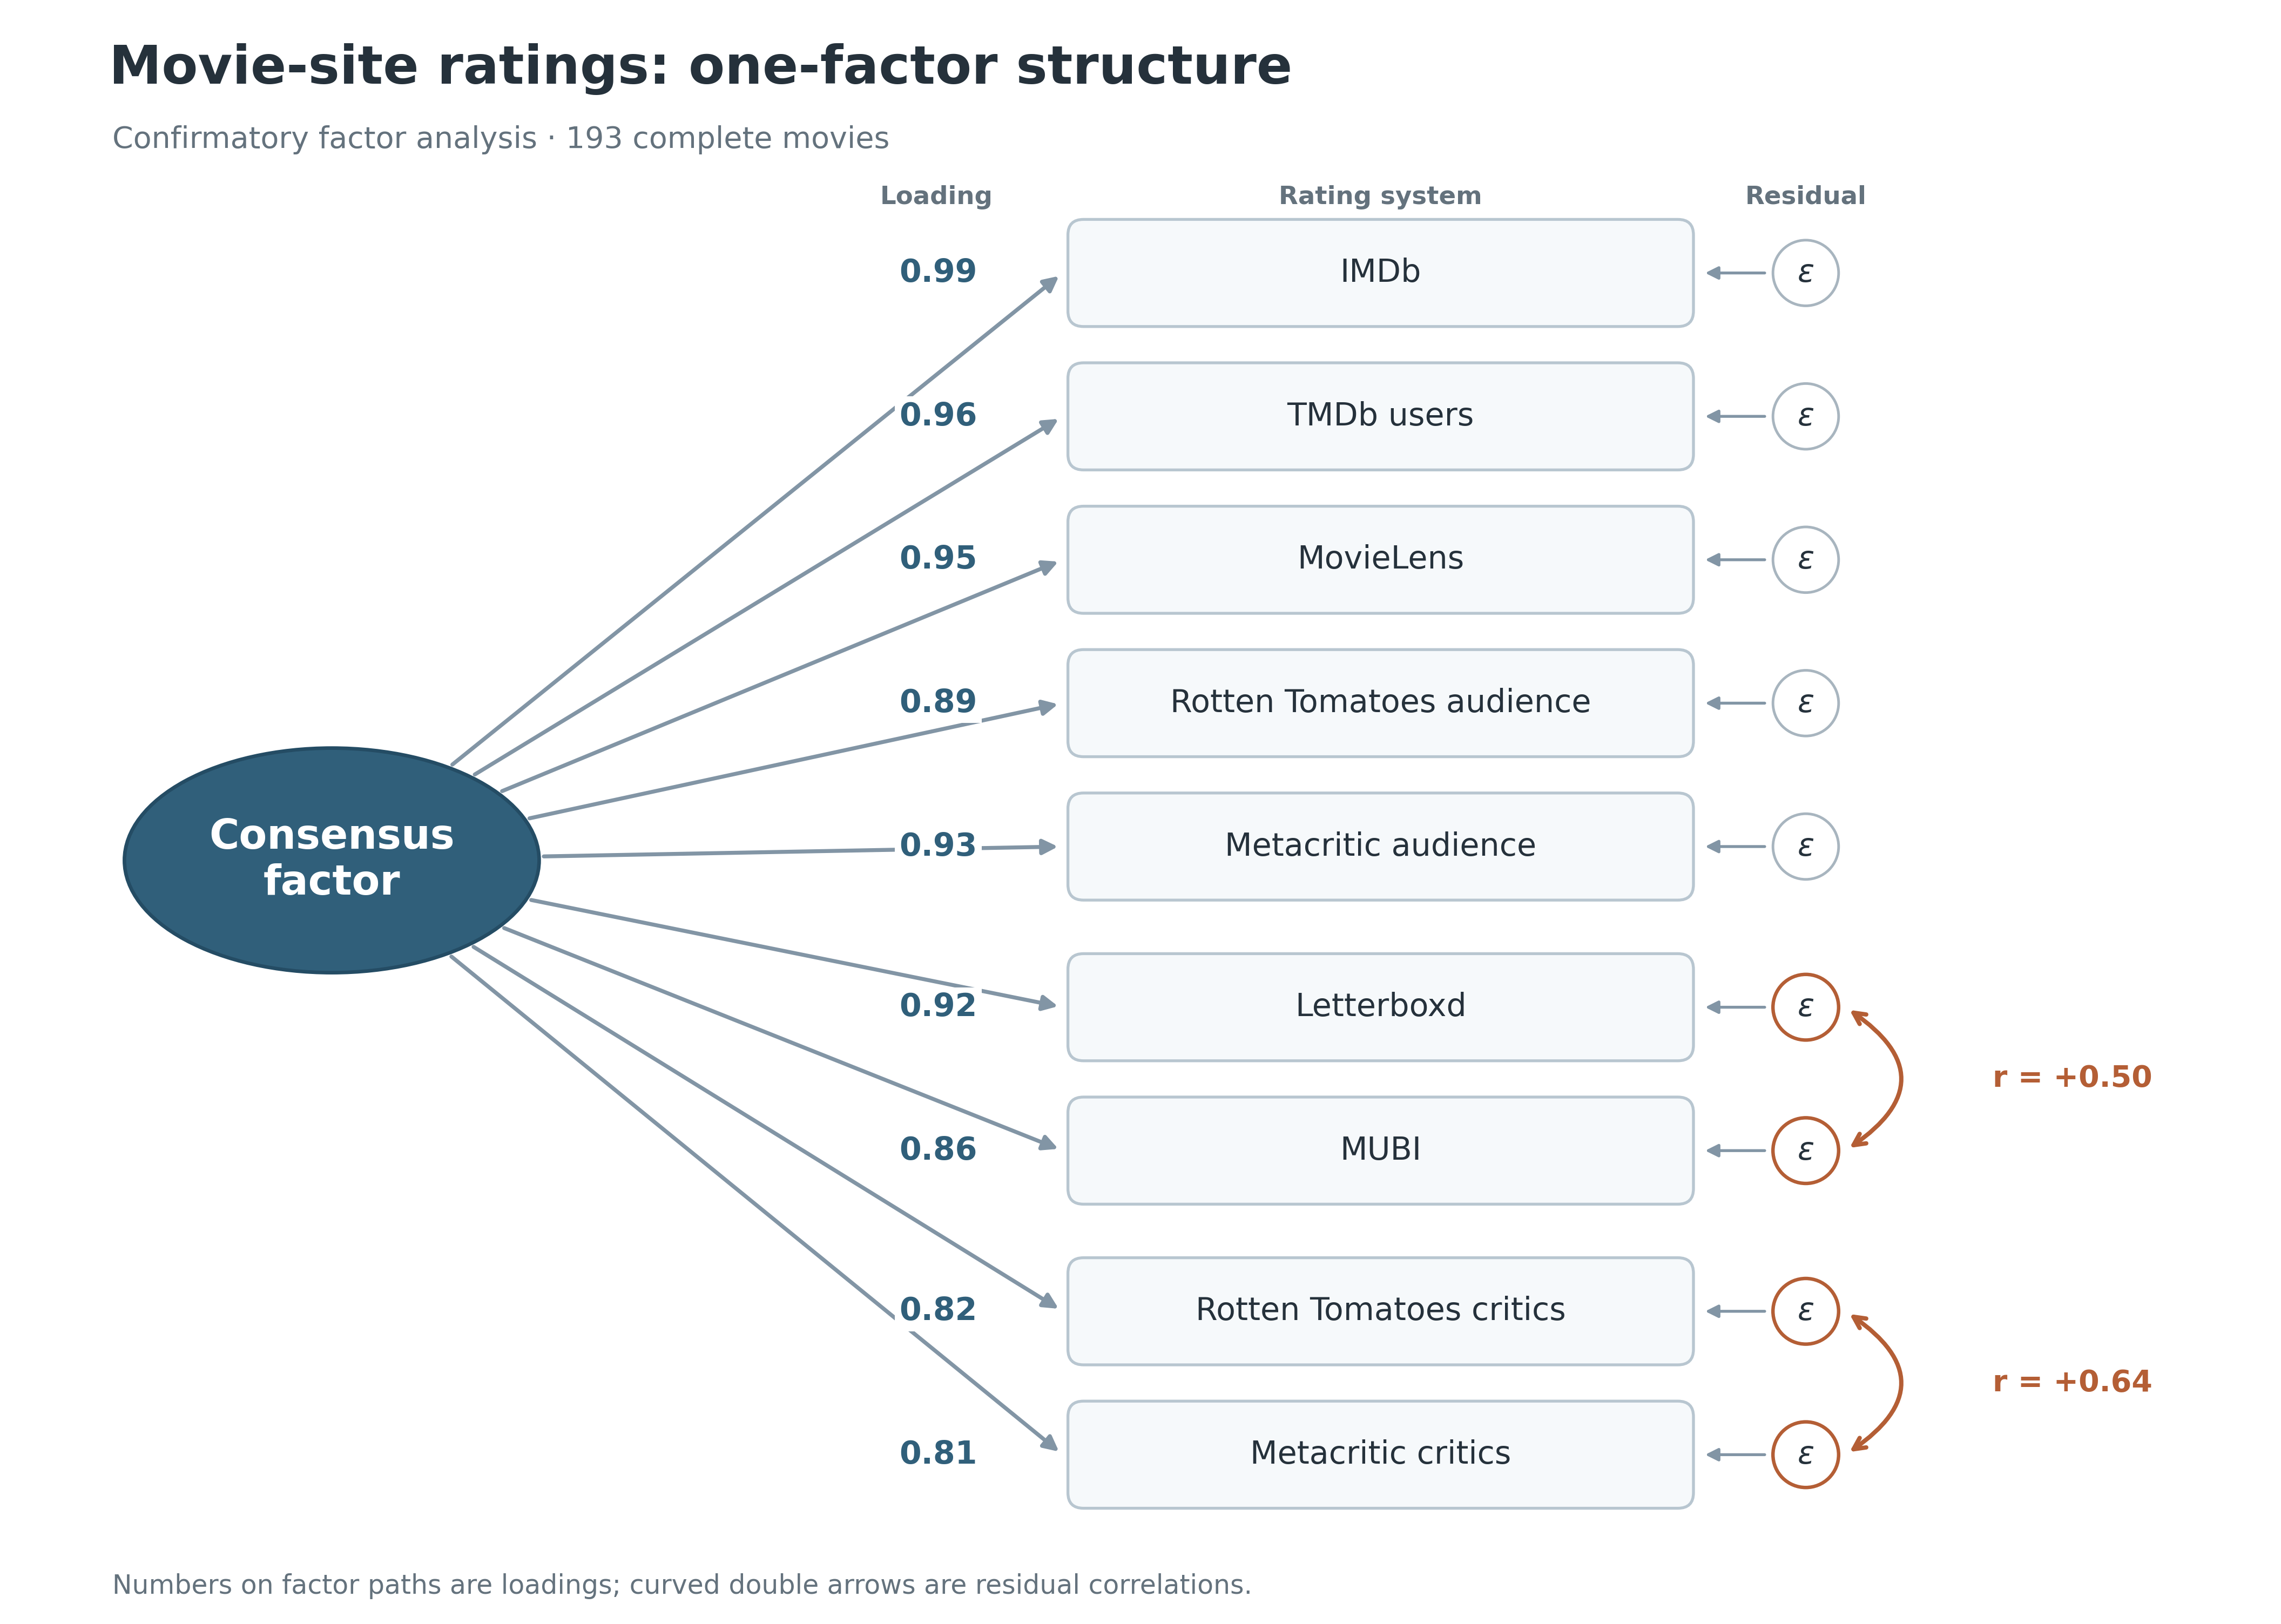
Overall, high loadings all around. Though I did have to allow for some residual correlations between Letterboxd and MUBI, and between the Rotten Tomatoes and Metacritic critic ratings, which got me thinking. Letterboxd and MUBI are both targeted towards movie snobs cinephiles. And the Rotten Tomatoes and Metacritic critic ratings are both, well, critic ratings. So, what if we model the ratings using three correlated factors: a popular consensus factor, a cinephile consensus factor, and a critic consensus factor?
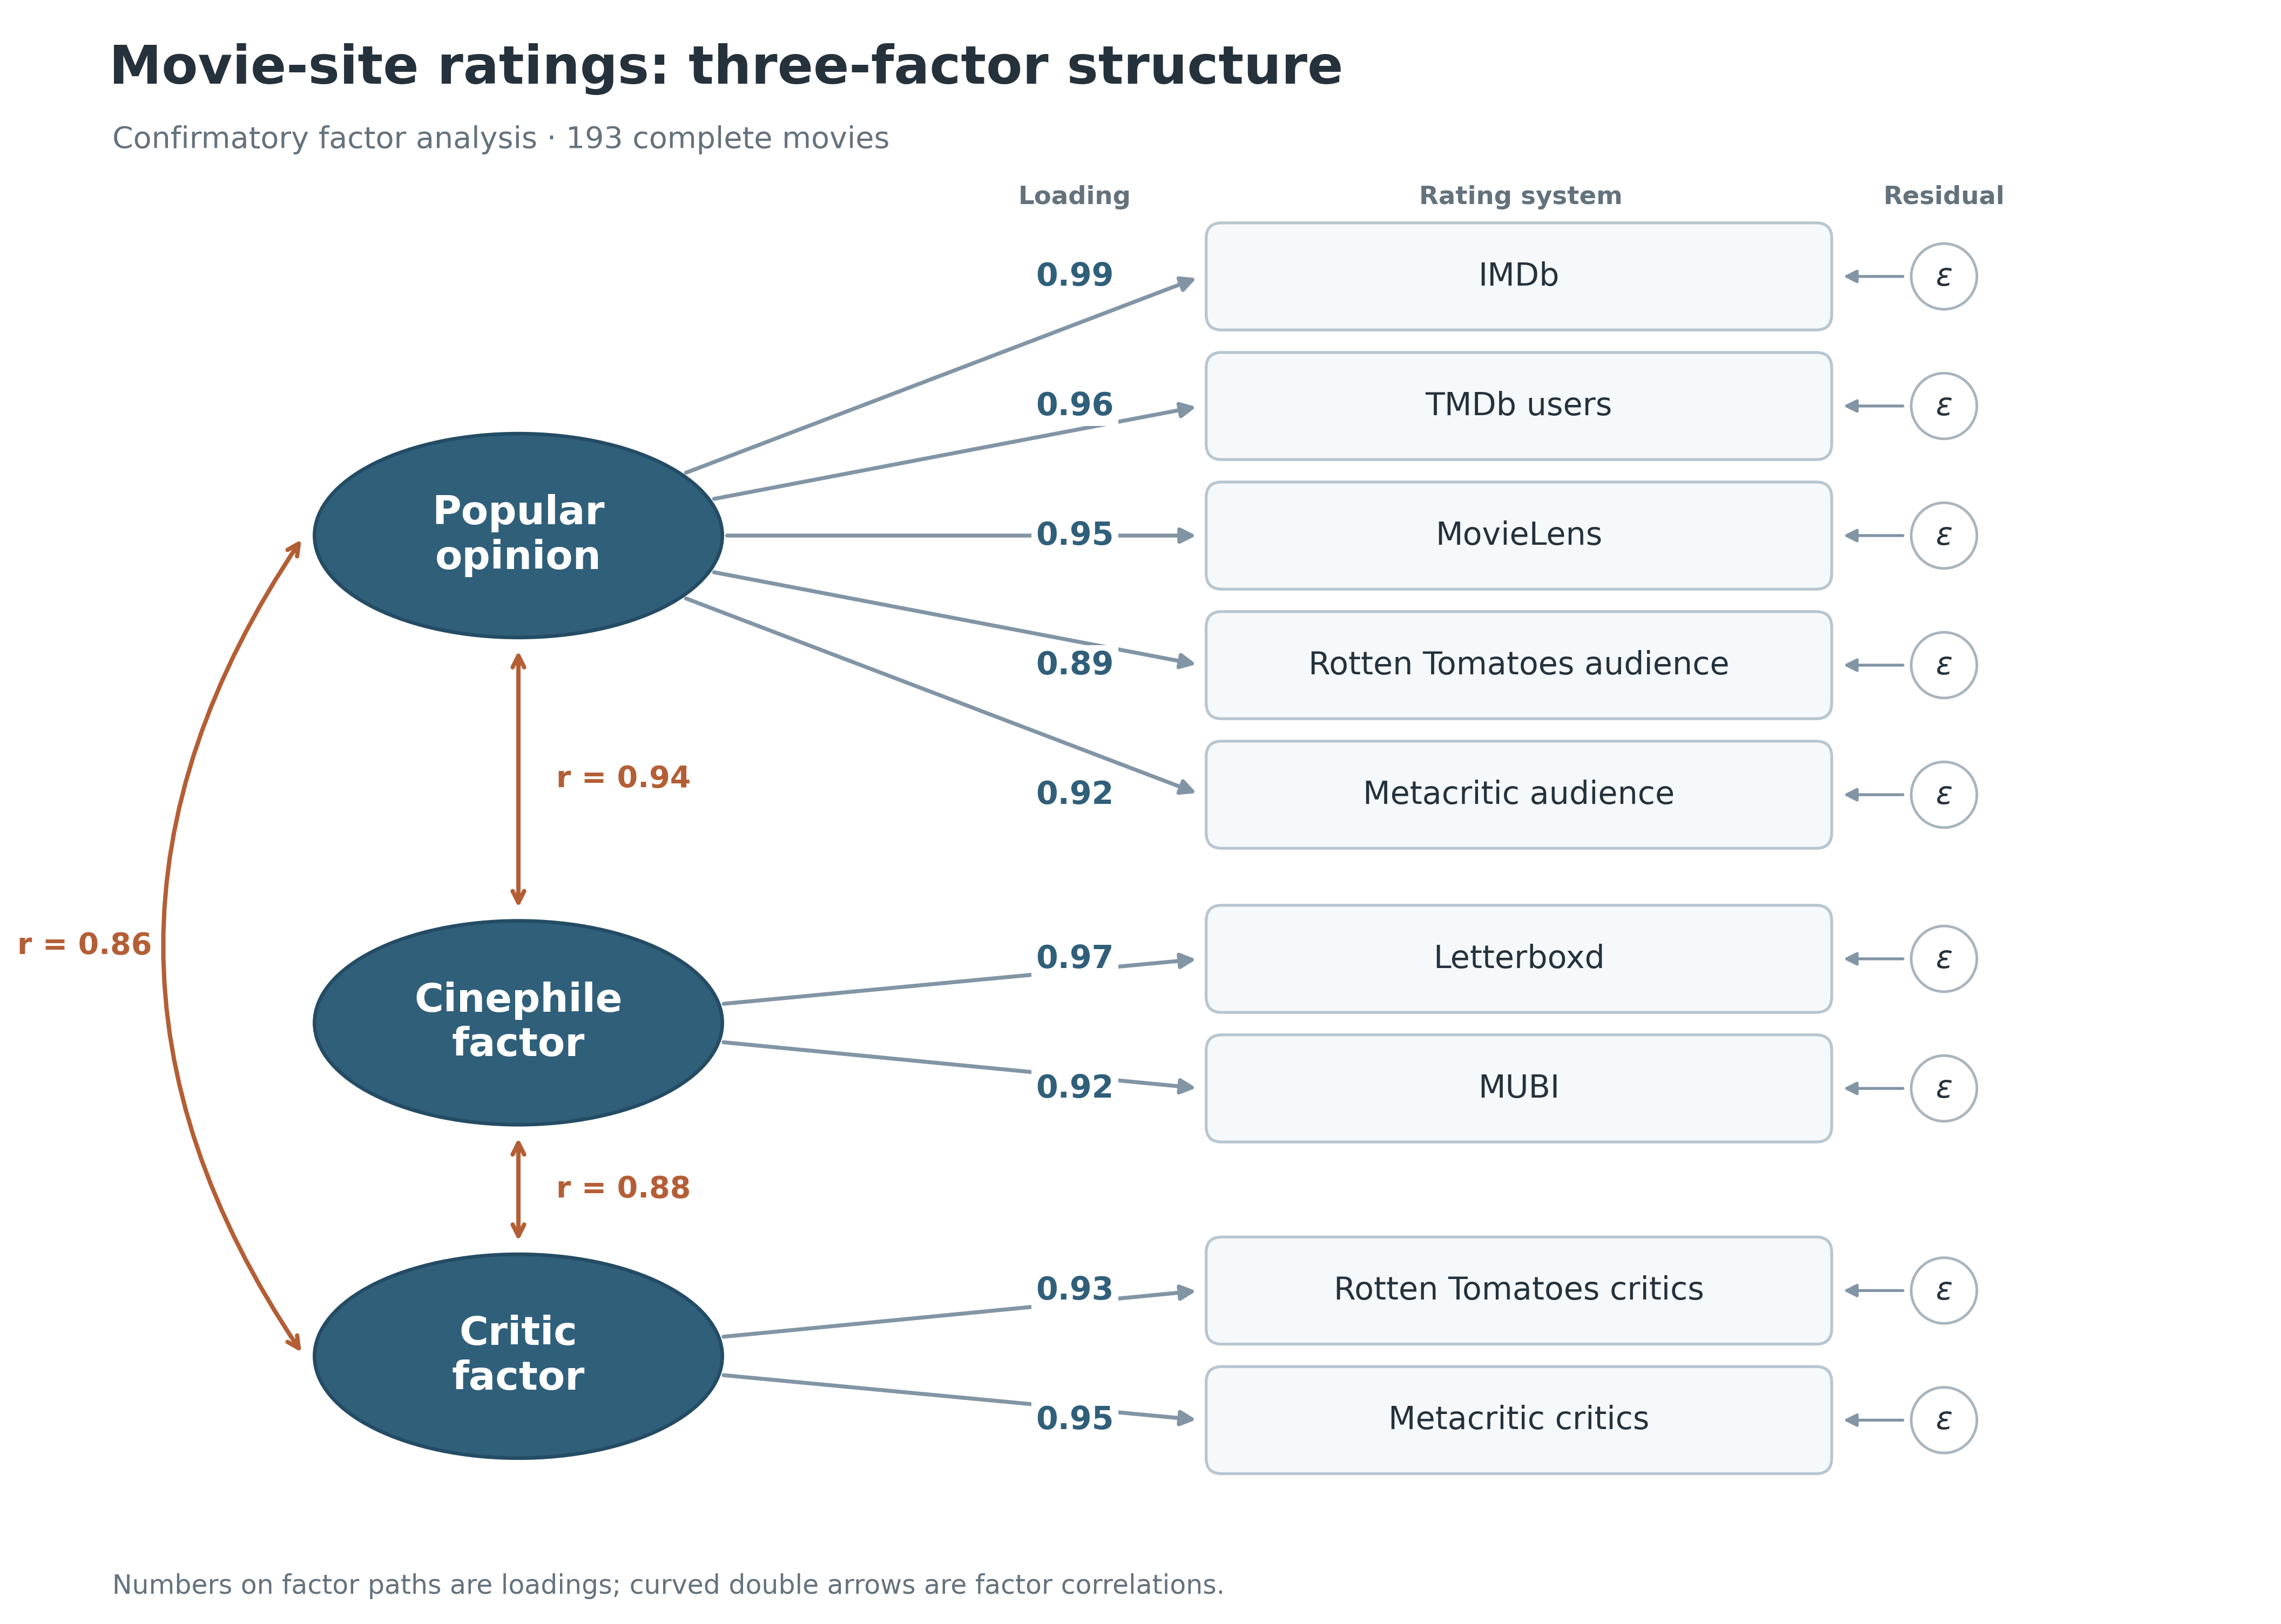
This model fits better than the one-factor model, but only by the teensiest of margins. That said, let’s see which of these factors predicts my ratings best.
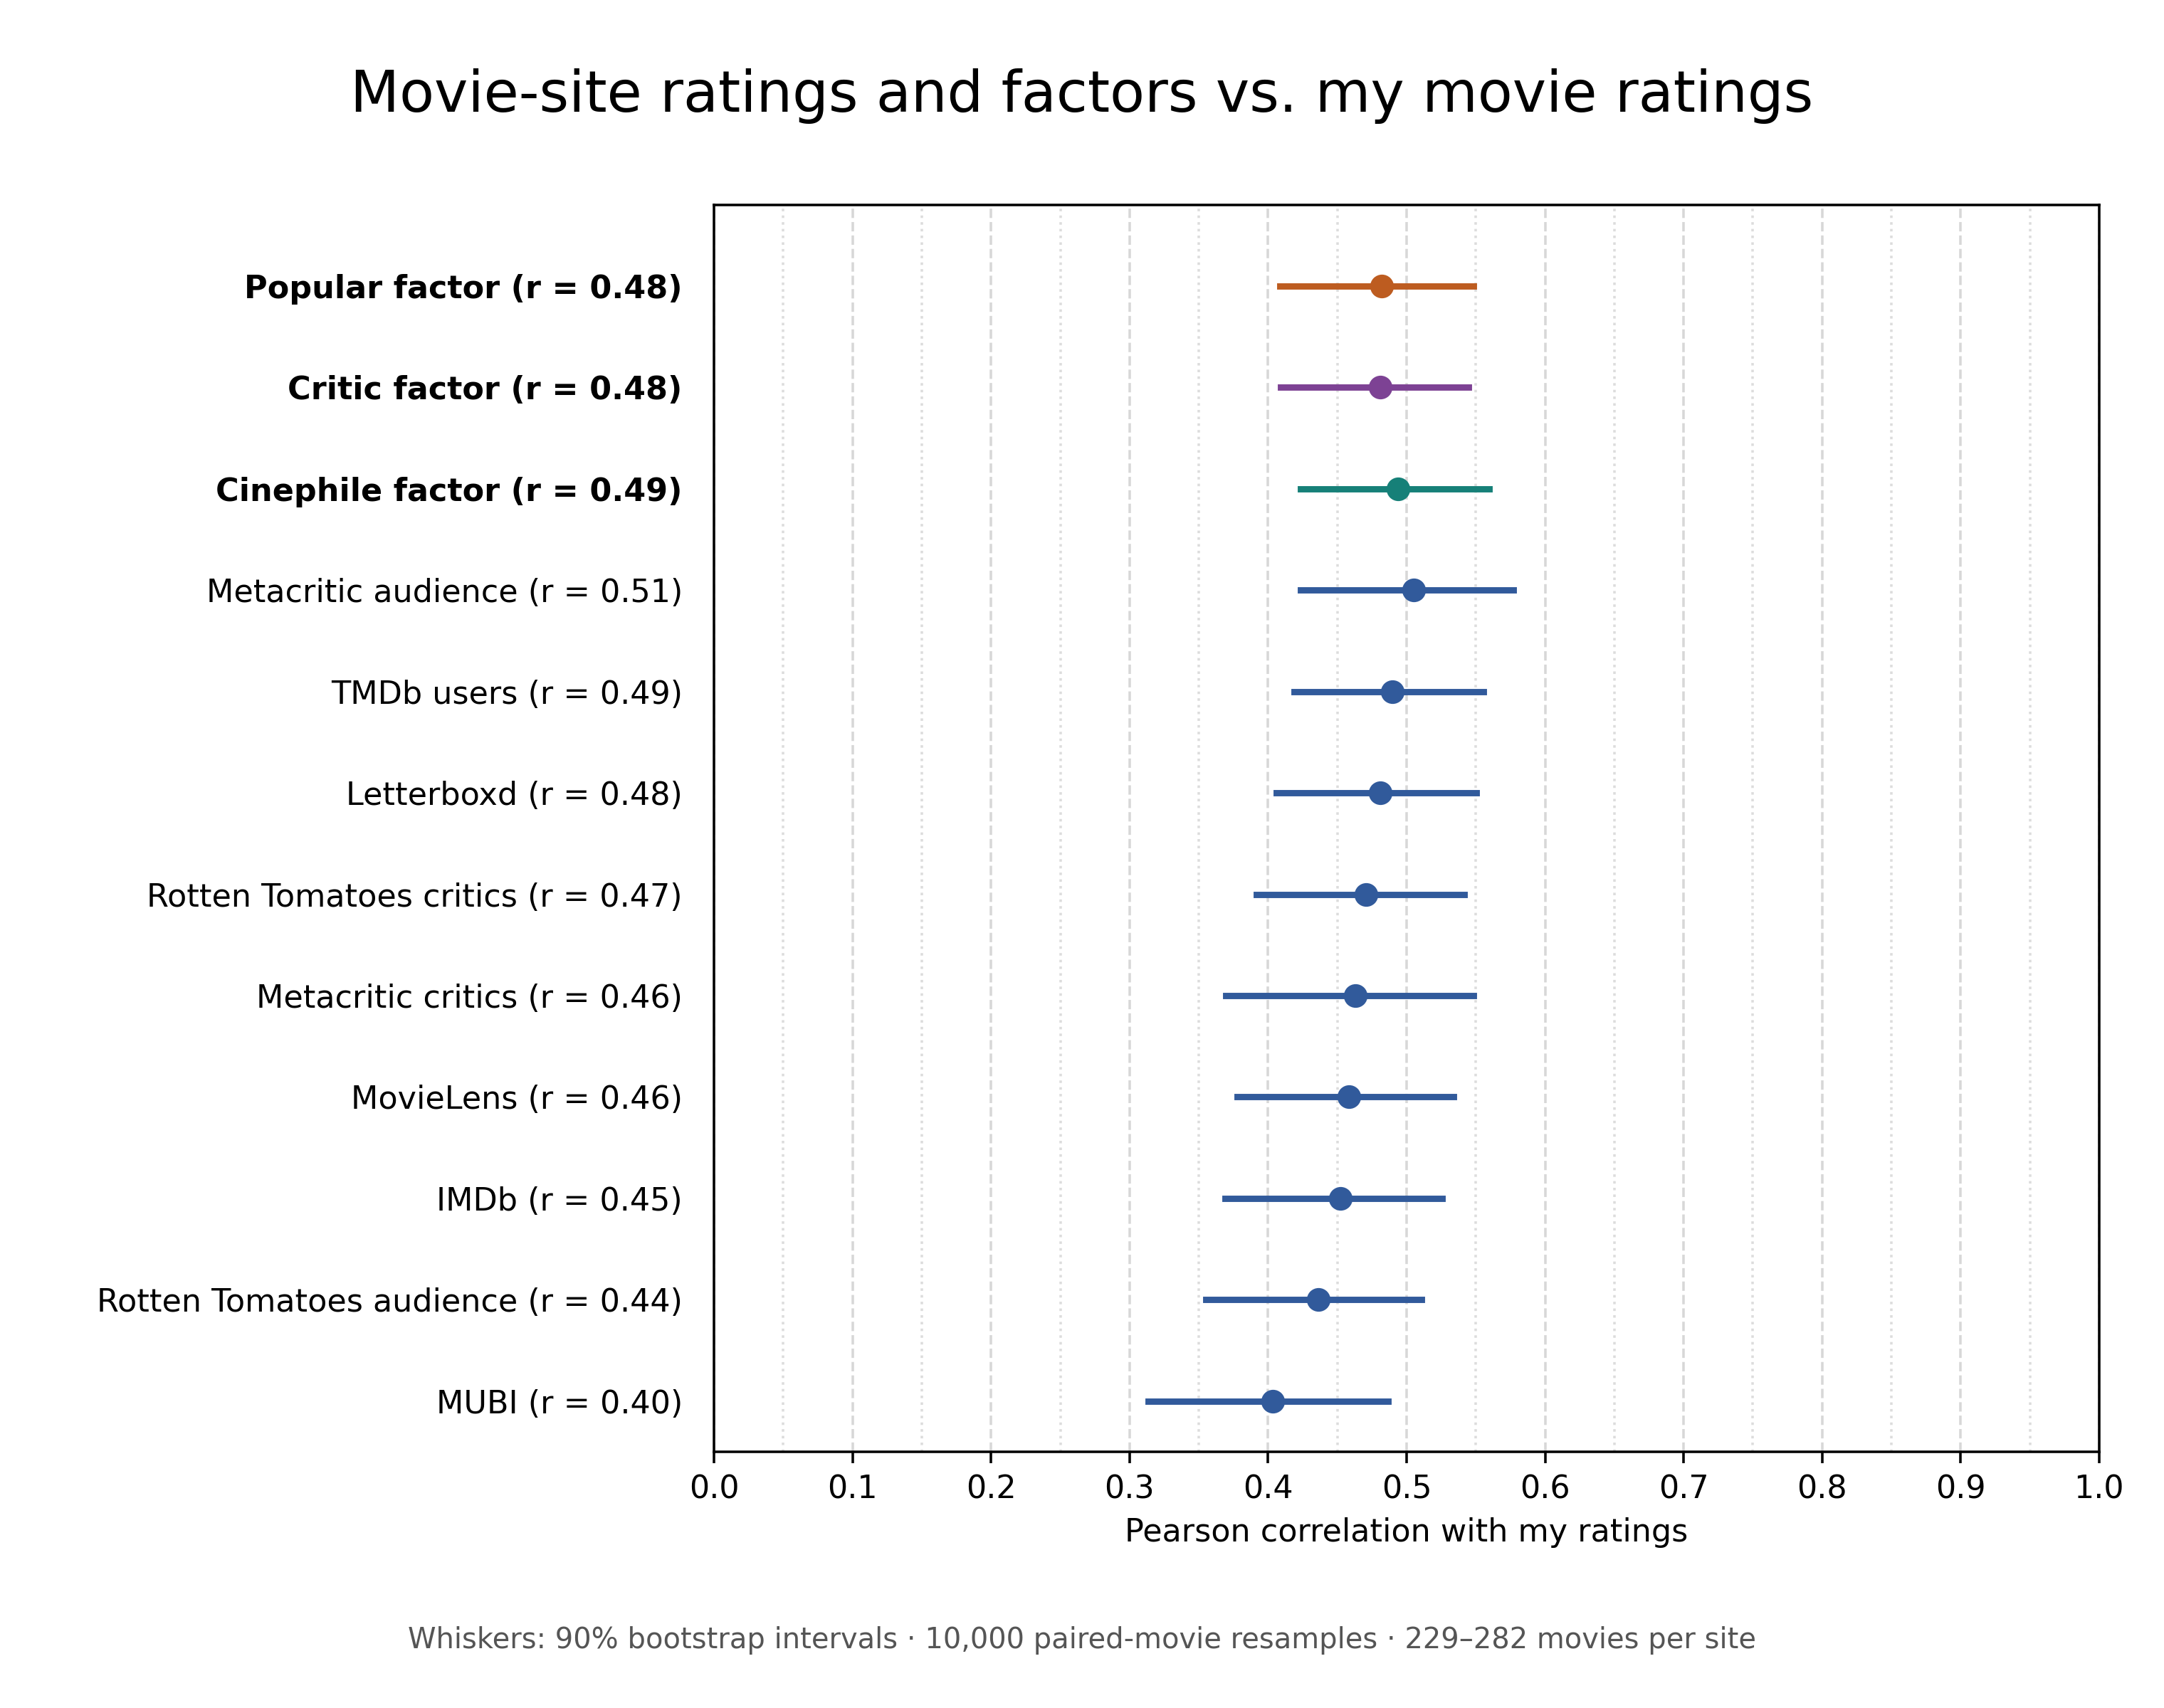
They all have pretty much the same performance. This makes sense, seeing as the factors are all very highly correlated with each other. But perhaps some of them contain predictive information that the others don’t? What if we throw all three into a linear regression?
Well, for reasons4, I decided to use a bifactor model instead, separating the general movie-consensus factor from the variation specific to popular audiences, cinephiles, and critics. This lets us see whether any of these groups’ preferences predict my ratings above and beyond the general consensus.
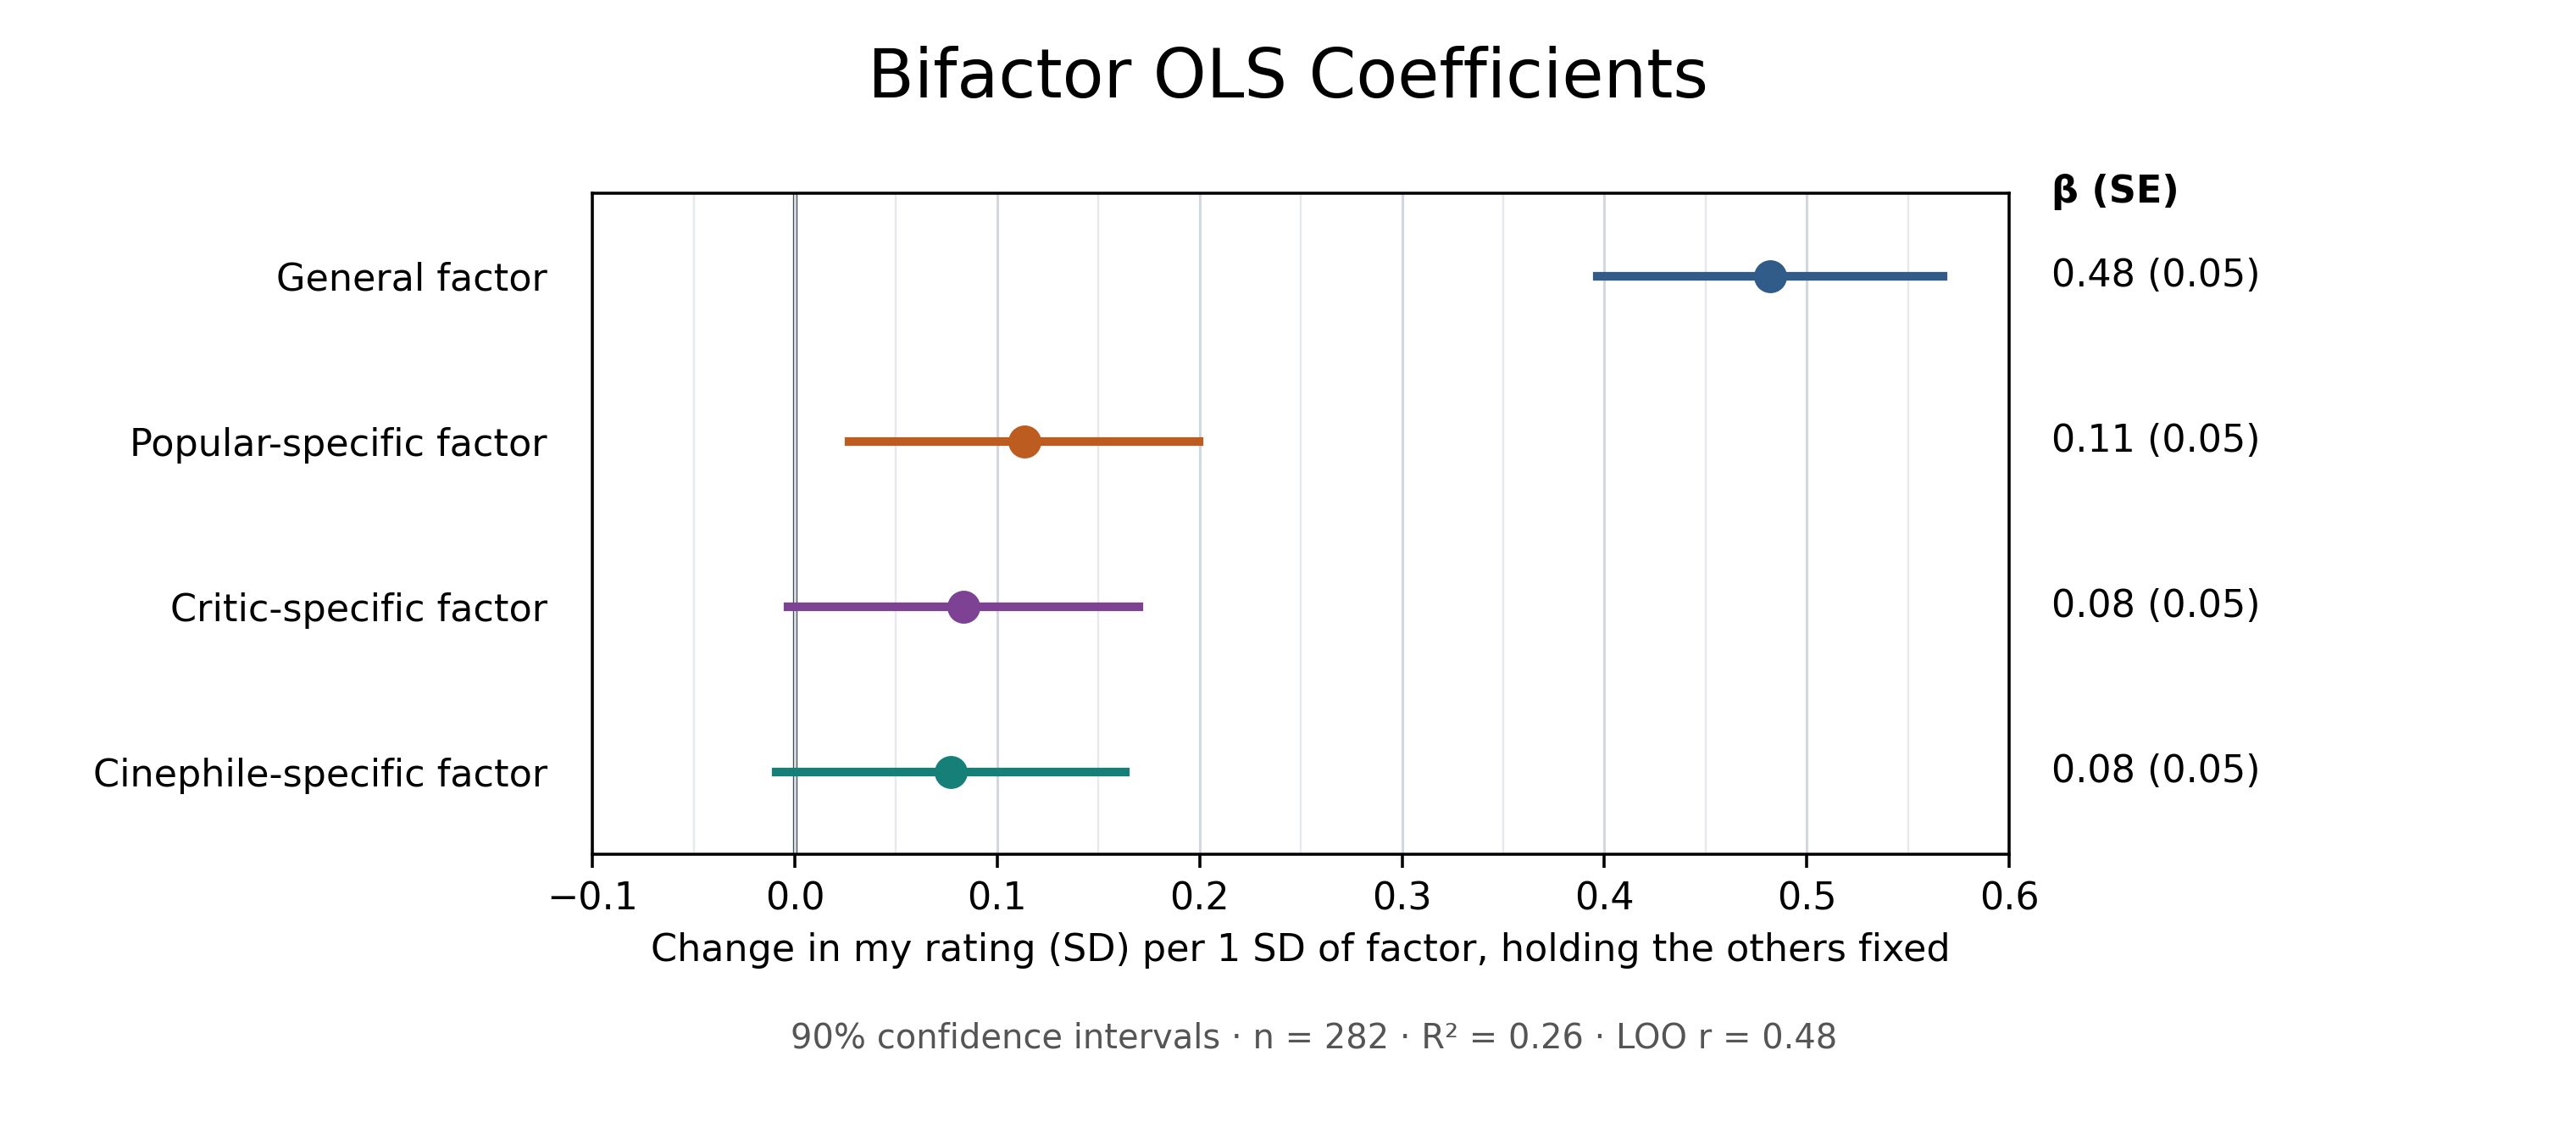
Alas, that didn’t help either. I like movies that everyone else likes, and it doesn’t seem to matter much how you define ‘everyone else’.
Explanation of Similarity Kernels
Each of the kernels is a different way of measuring how similar two movies are, using the 1,128 MovieLens tags. For each one, I center the similarity matrix and rescale it so the average diagonal is 1. Then, I use tagmetricity to estimate how much of the variance in my ratings can be explained by that particular notion of similarity.
The formulas below are for the similarity of movies $i$ and $j$ before that final centering and rescaling. Let $x_i$ be a movie’s raw tag vector, $z_i$ its tag-by-tag z-scored vector, and $p=1128$ the number of tags.
- Standardized linear: Z-score each tag, then take the dot product of the movies’ tag vectors: $K_{ij}^{(0)}=z_i^\top z_j/p$. This is the most relevant kernel for elastic net, since that’s also trained on z-scored tags.
- Raw linear: Same as above, except we don’t z-score the tags: $K_{ij}^{(0)}=x_i^\top x_j/p$.
- Cosine: Z-score the tags, then normalize each movie’s tag vector to have length 1: $K_{ij}^{(0)}=z_i^\top z_j/(\lVert z_i\rVert\lVert z_j\rVert)$.
- Gaussian: Instead of using dot products, we look at the distance between movies in the z-scored tag space: $K_{ij}^{(0)}=\exp\left(-\lVert z_i-z_j\rVert^2/(2\ell^2)\right)$, where $\ell$ is the median pairwise distance.
- Mahalanobis: Similar to standardized linear, except we also account for the correlations between tags: $K_{ij}^{(0)}=z_i^\top\Sigma^{-1}z_j/p$, where $\Sigma$ is the shrinkage-estimated tag covariance matrix.
- Quadratic: Take the standardized dot product, add 1, and square it: $K_{ij}^{(0)}=(1+z_i^\top z_j/p)^2$.
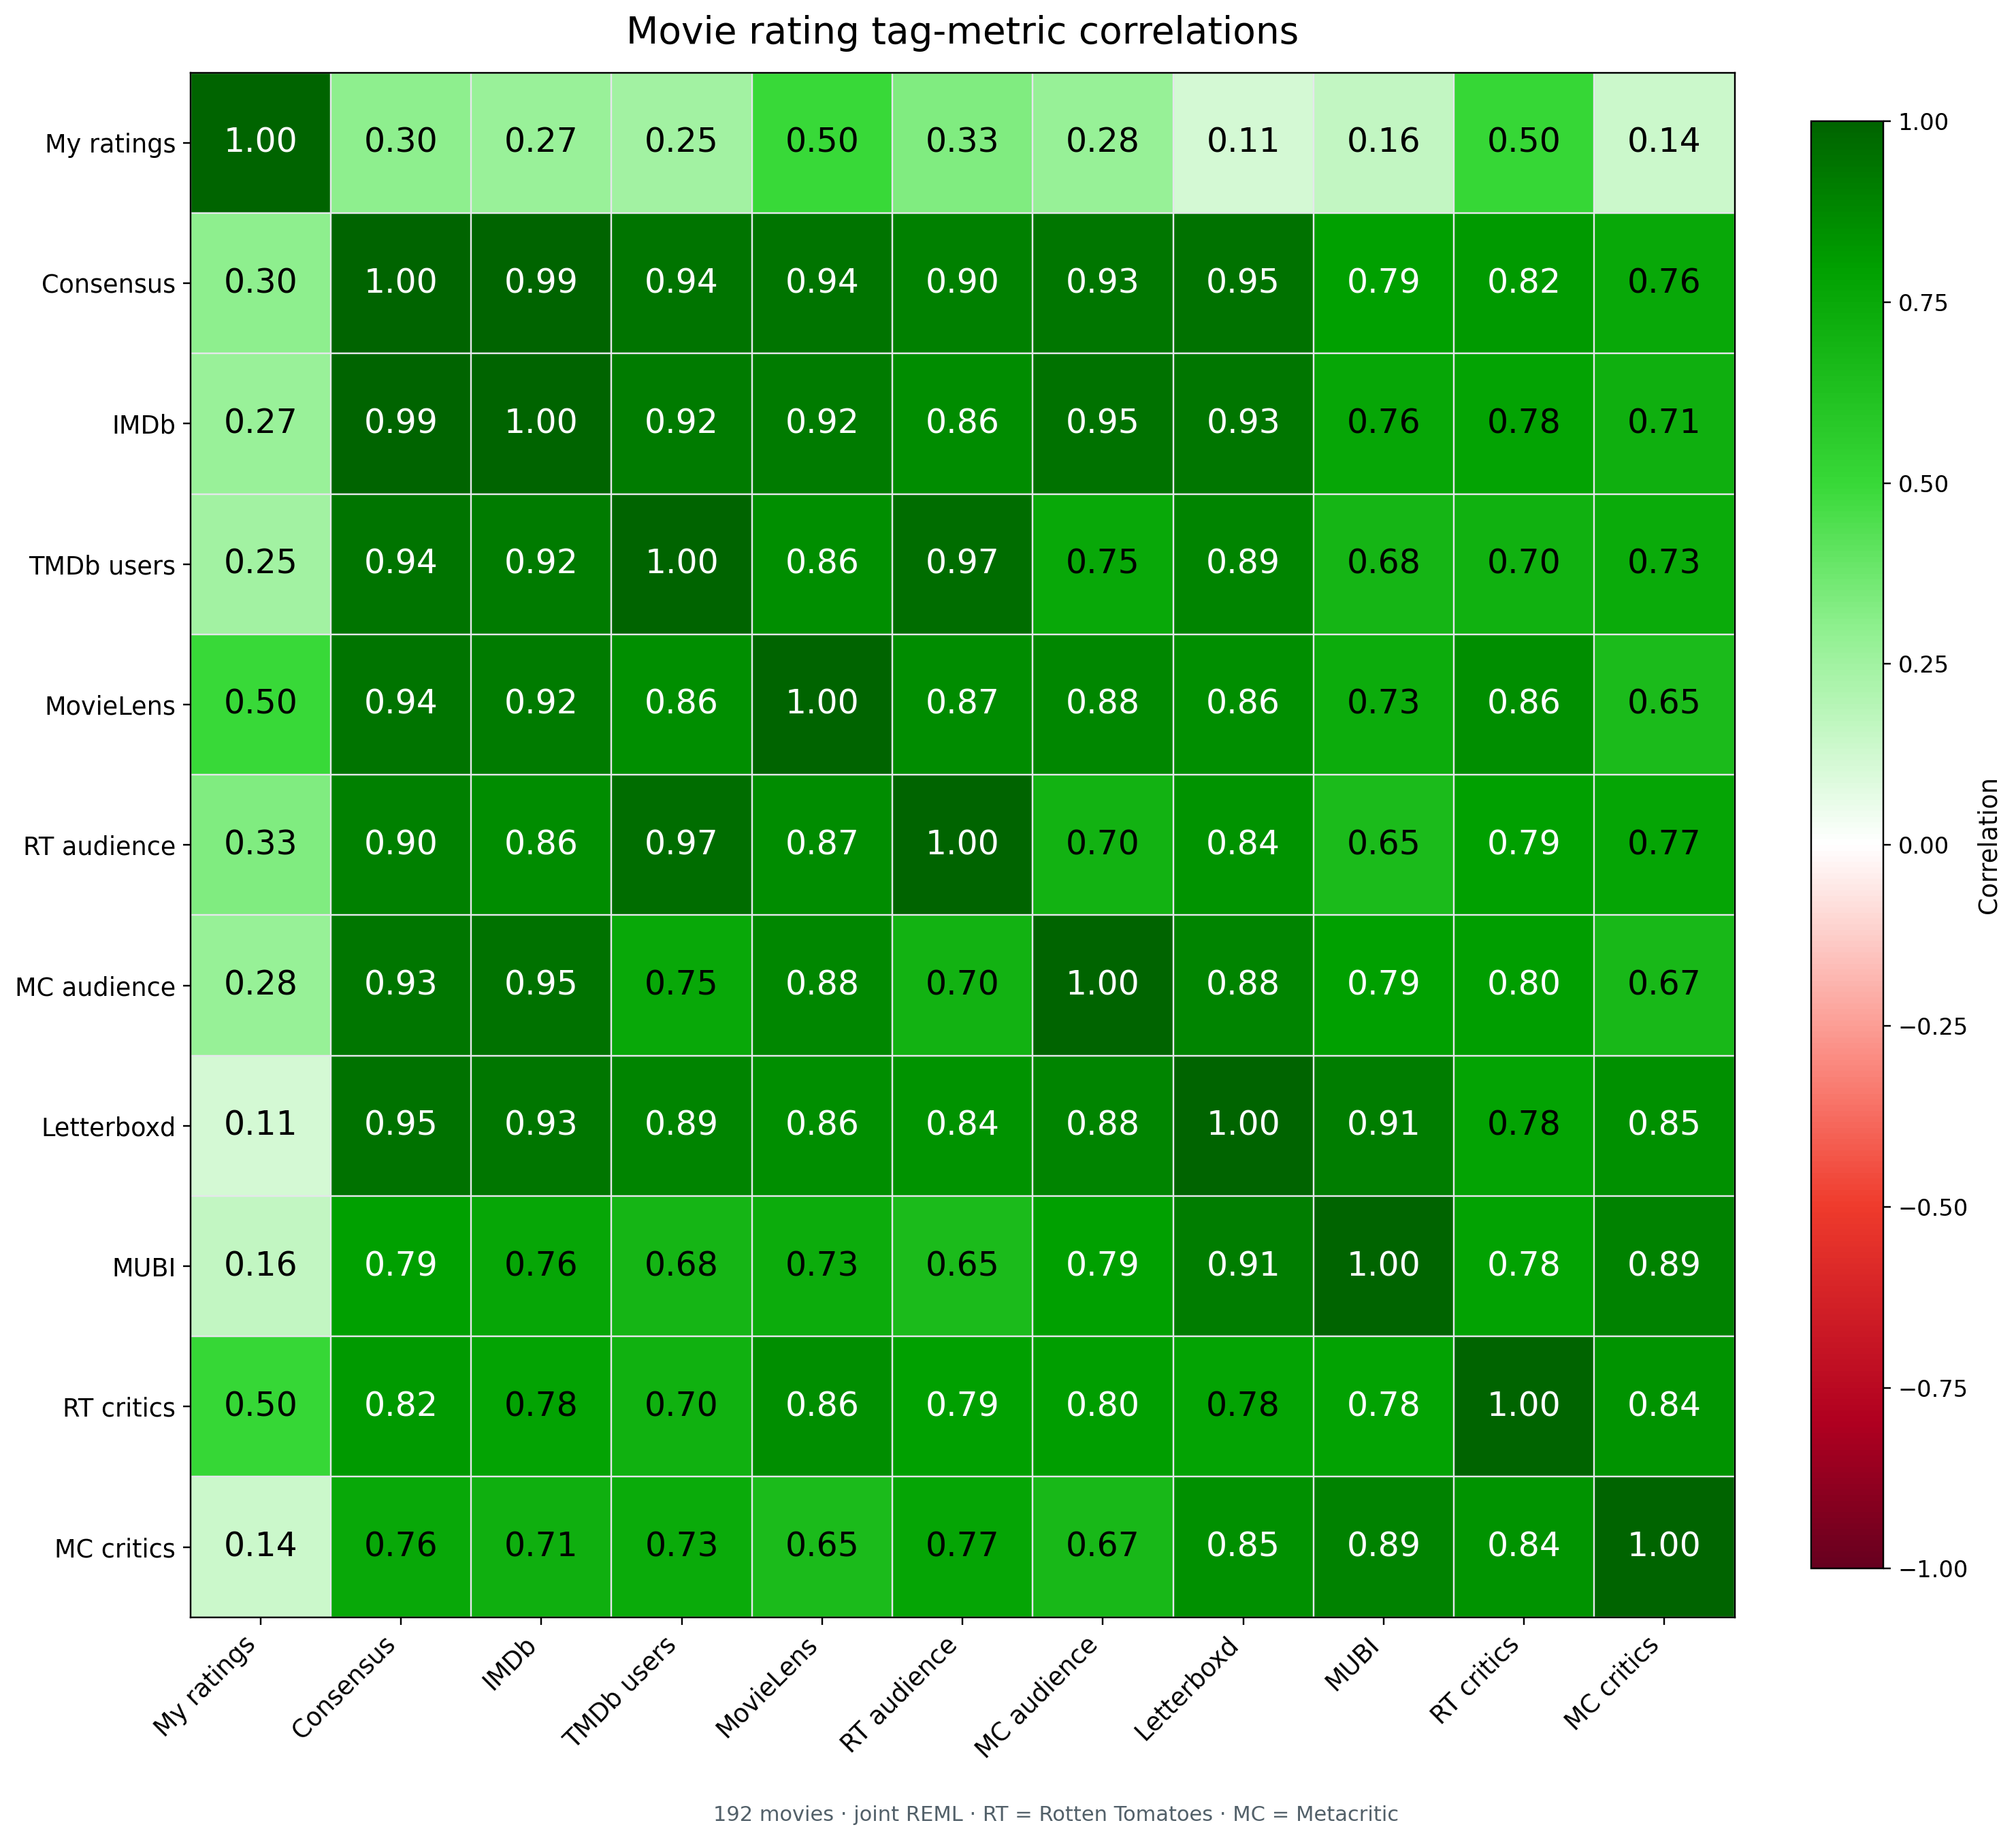
Tag-metric Correlations
-
Though increasingly irrelevant in this age of abundant intelligence. ↩
-
Embeddings with 115 dimensions, created by performing factor analysis with varimax rotation on 1,128 z-scored tags. ↩
-
Well, besides the obvious principal-agent problems. ↩
-
Initially, I wanted to use a hierarchical factor model, extracting the general consensus factor and the residuals of the popular, cinephile, and critic factors. However, extracting scores for those residuals turned out to be less straightforward than I’d expected, so I used a bifactor model instead, which estimates the general and group-specific factors directly. ↩