Gwern Was Wrong About Star Ratings
Gwern says that star ratings suck. And everyone else seems to agree with him.
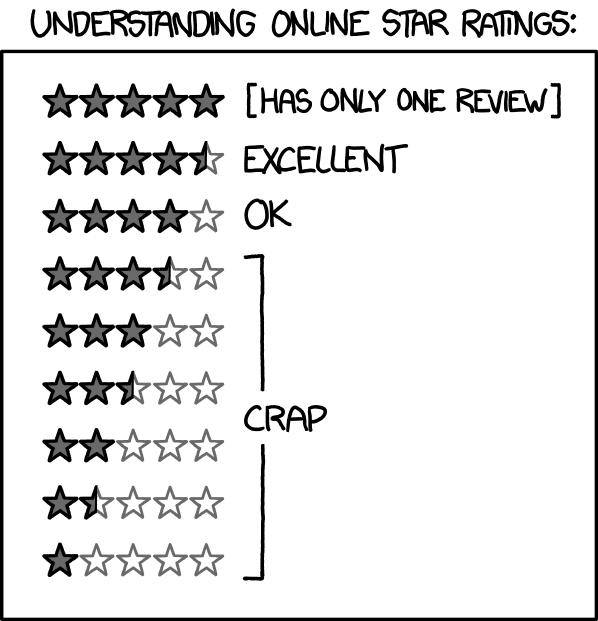
The main criticism is that star ratings suffer from rating inflation: ratings tend to cluster at the high end of the scale, making it hard to distinguish between items. When everything is 5 stars, nothing is. I used to think this made them inferior to comparison-based ratings. Now I have data to put that idea to the test: I’ve rated a couple hundred movies I’ve seen using both systems to see which works better.
Rating systems
Star ratings
The labels run from 1 to the maximum for each scale.
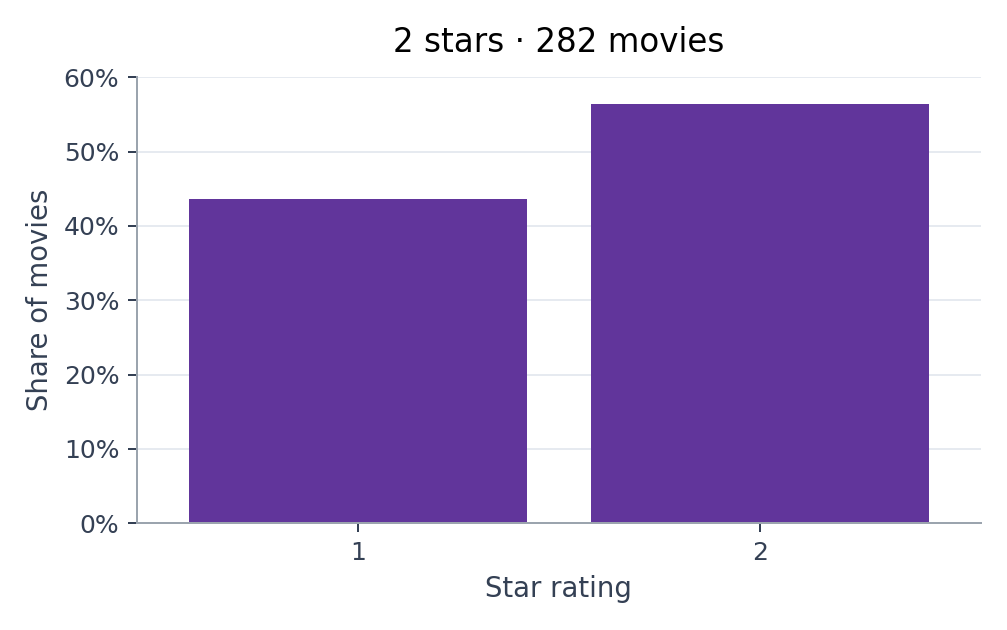
2 stars
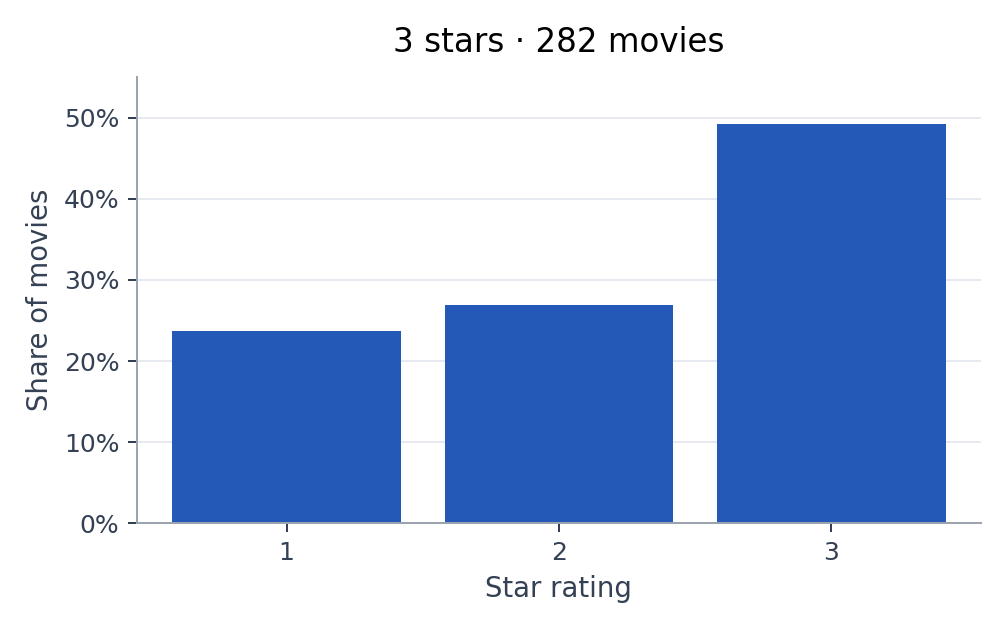
3 stars
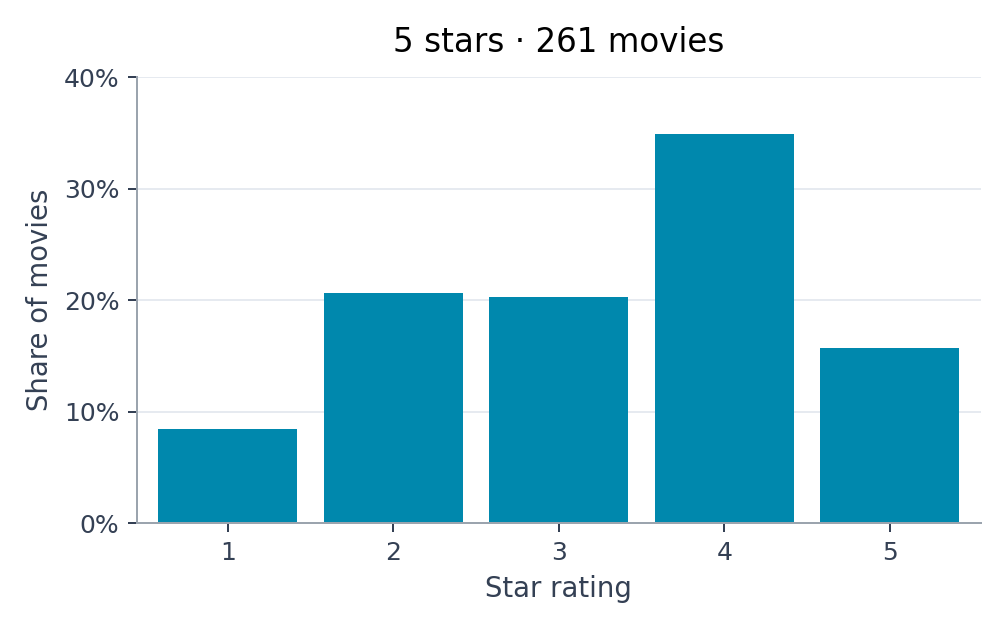
5 stars
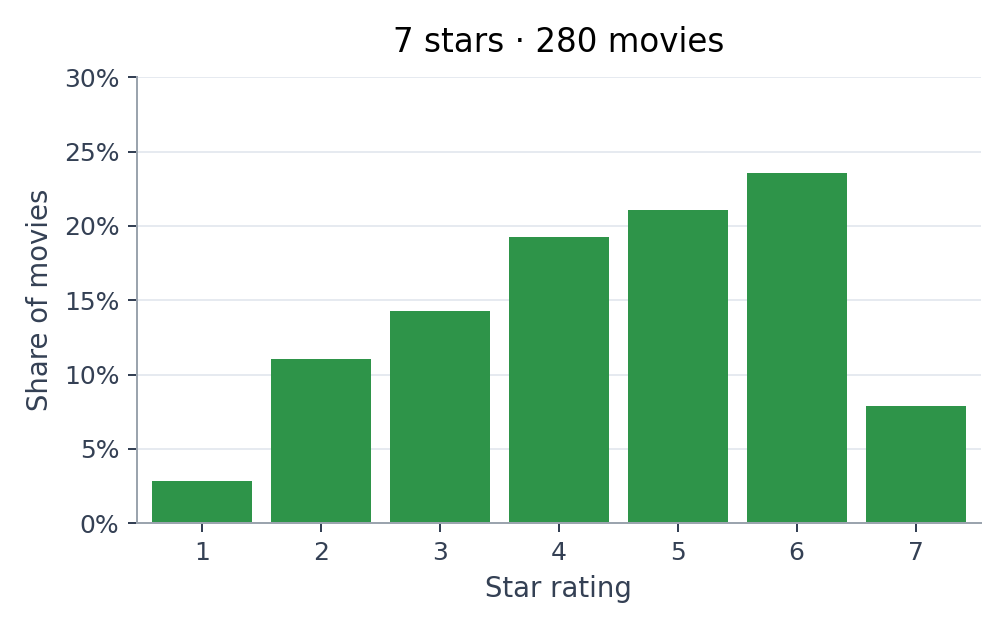
7 stars
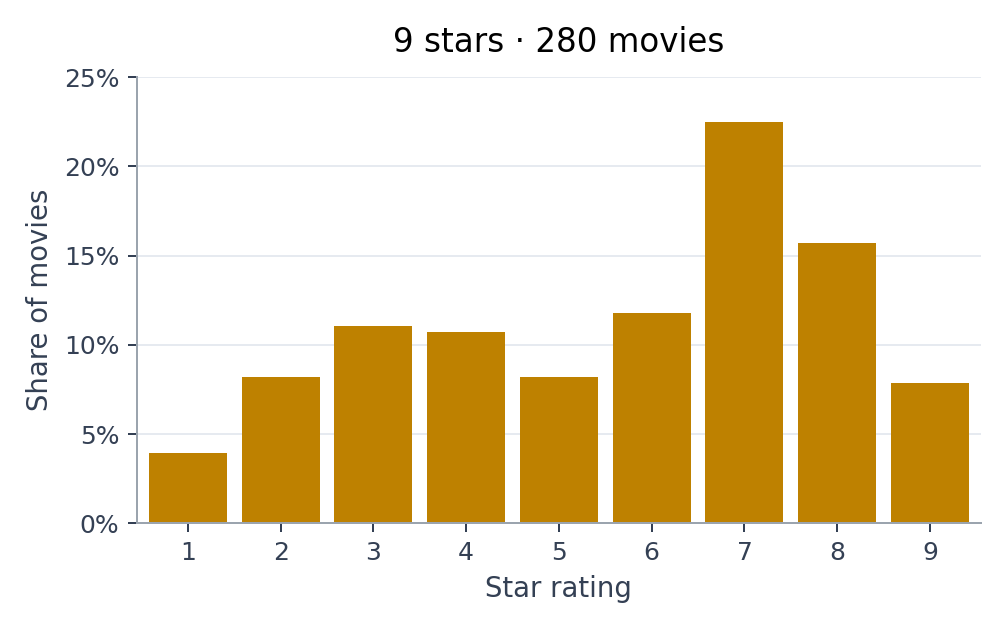
9 stars
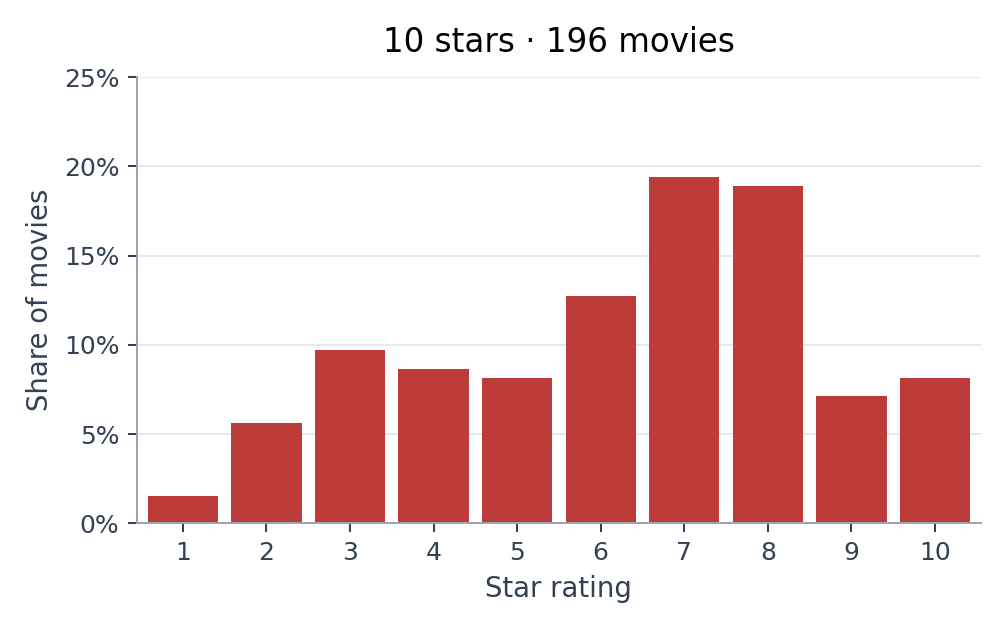
10 stars
- An Abomination: Shouldn’t exist; I find it repulsive, deeply offensive, and/or a complete waste of time and resources.
- Hated It: Self-explanatory.
- Plain Bad: Glaringly amateur or lazy in all the worst ways. Has bad acting, cheesy visual effects, cringy dialogue, and/or a ridiculous story.
- Poor: Some things are done well in a technical sense, but just not very entertaining.
- Meh: Wasn’t completely bored to tears, but it didn’t exactly captivate me.
- Watchable: Not exactly a ‘good’ movie, but easy to watch and enjoy with the right mindset.
- Good: A solid, well-made movie. It didn’t just hold my attention, it also provided me with a good time.
- Great: Intrigued by and invested in the story. Would recommend to my friends.
- Outstanding: Instant classic.
- Riveting: Absolute cinema.
Comparison-based ratings
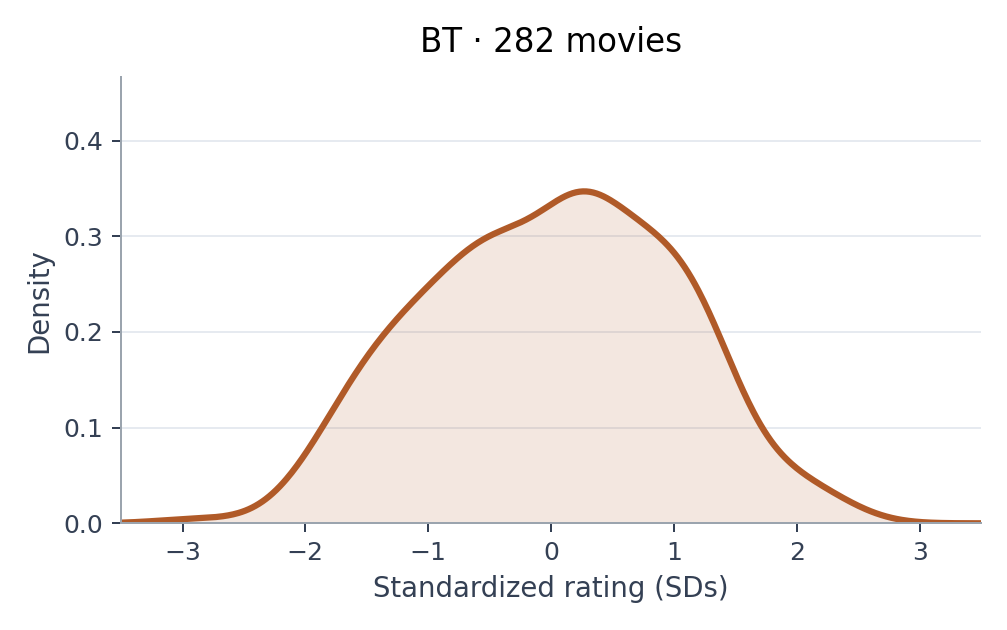
OpenSkill and BT produce continuous rather than discrete scores. Both scales have been standardized to N(0, 1).
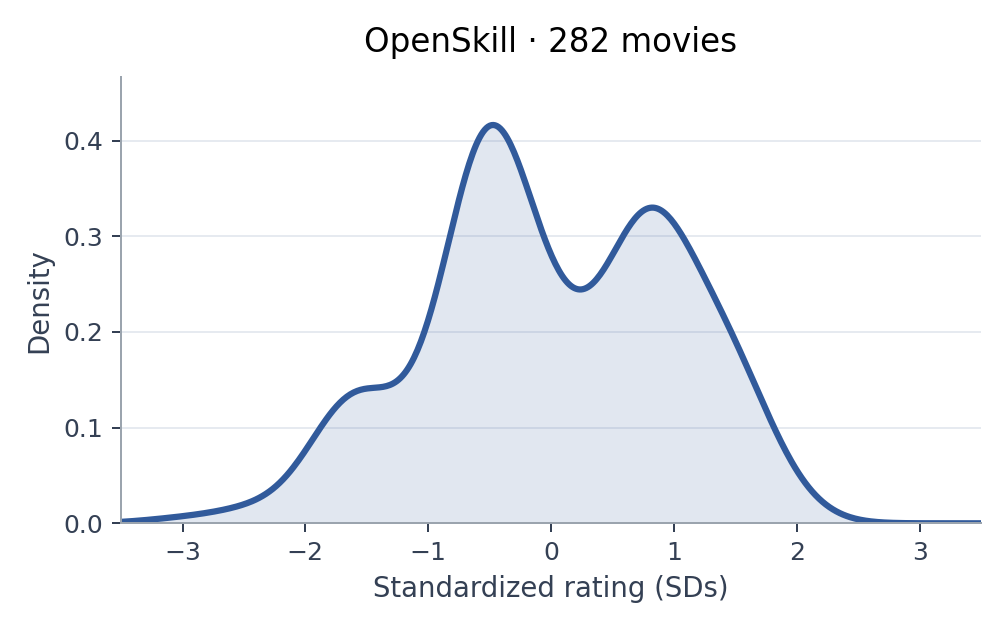
OpenSkill
I compared pairs of movies using OpenSkill, which was modeled after Microsoft’s TrueSkill system. For each pair, I chose the better movie or declared a tie. After each comparison, the ratings were normalized to have a mean of 50 and a standard deviation of 50/3.
Bradley–Terry
This uses the same comparisons (choosing the better movie or declaring a tie). However, it uses the Bradley–Terry–Davidson model, which differs from the standard BT model by allowing ties.
First, let’s take a look at the correlations between the rating systems.
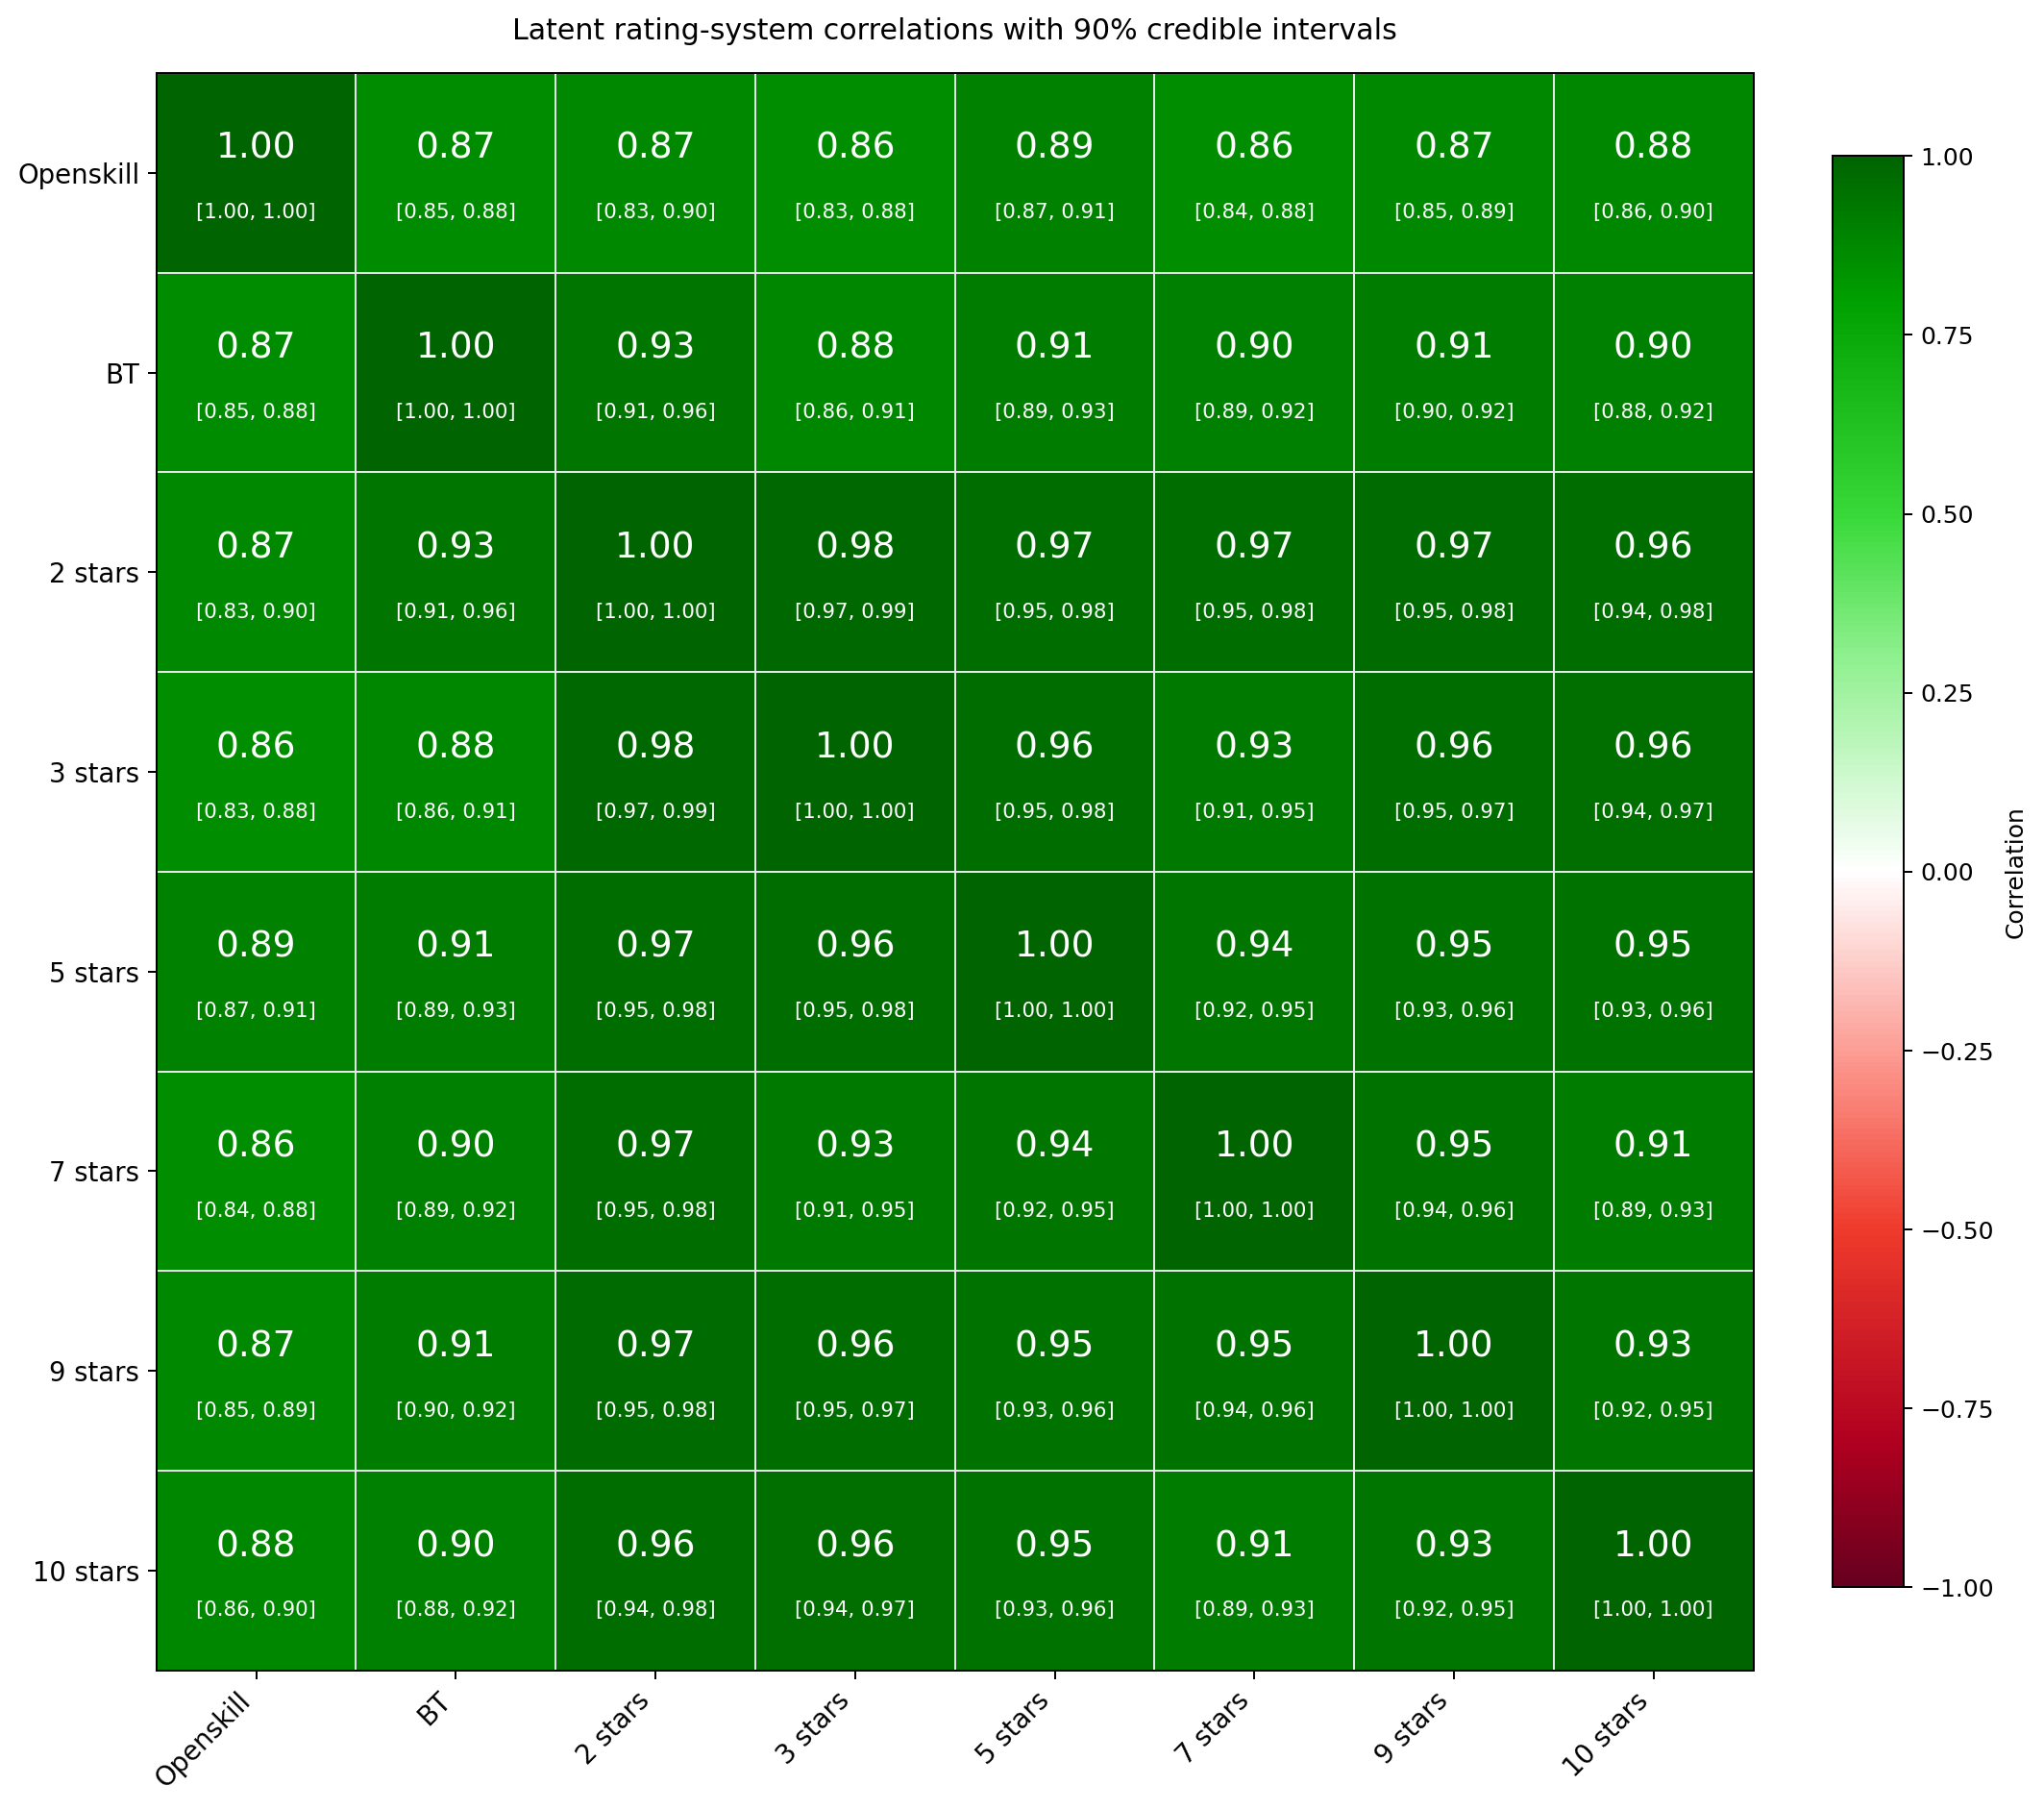
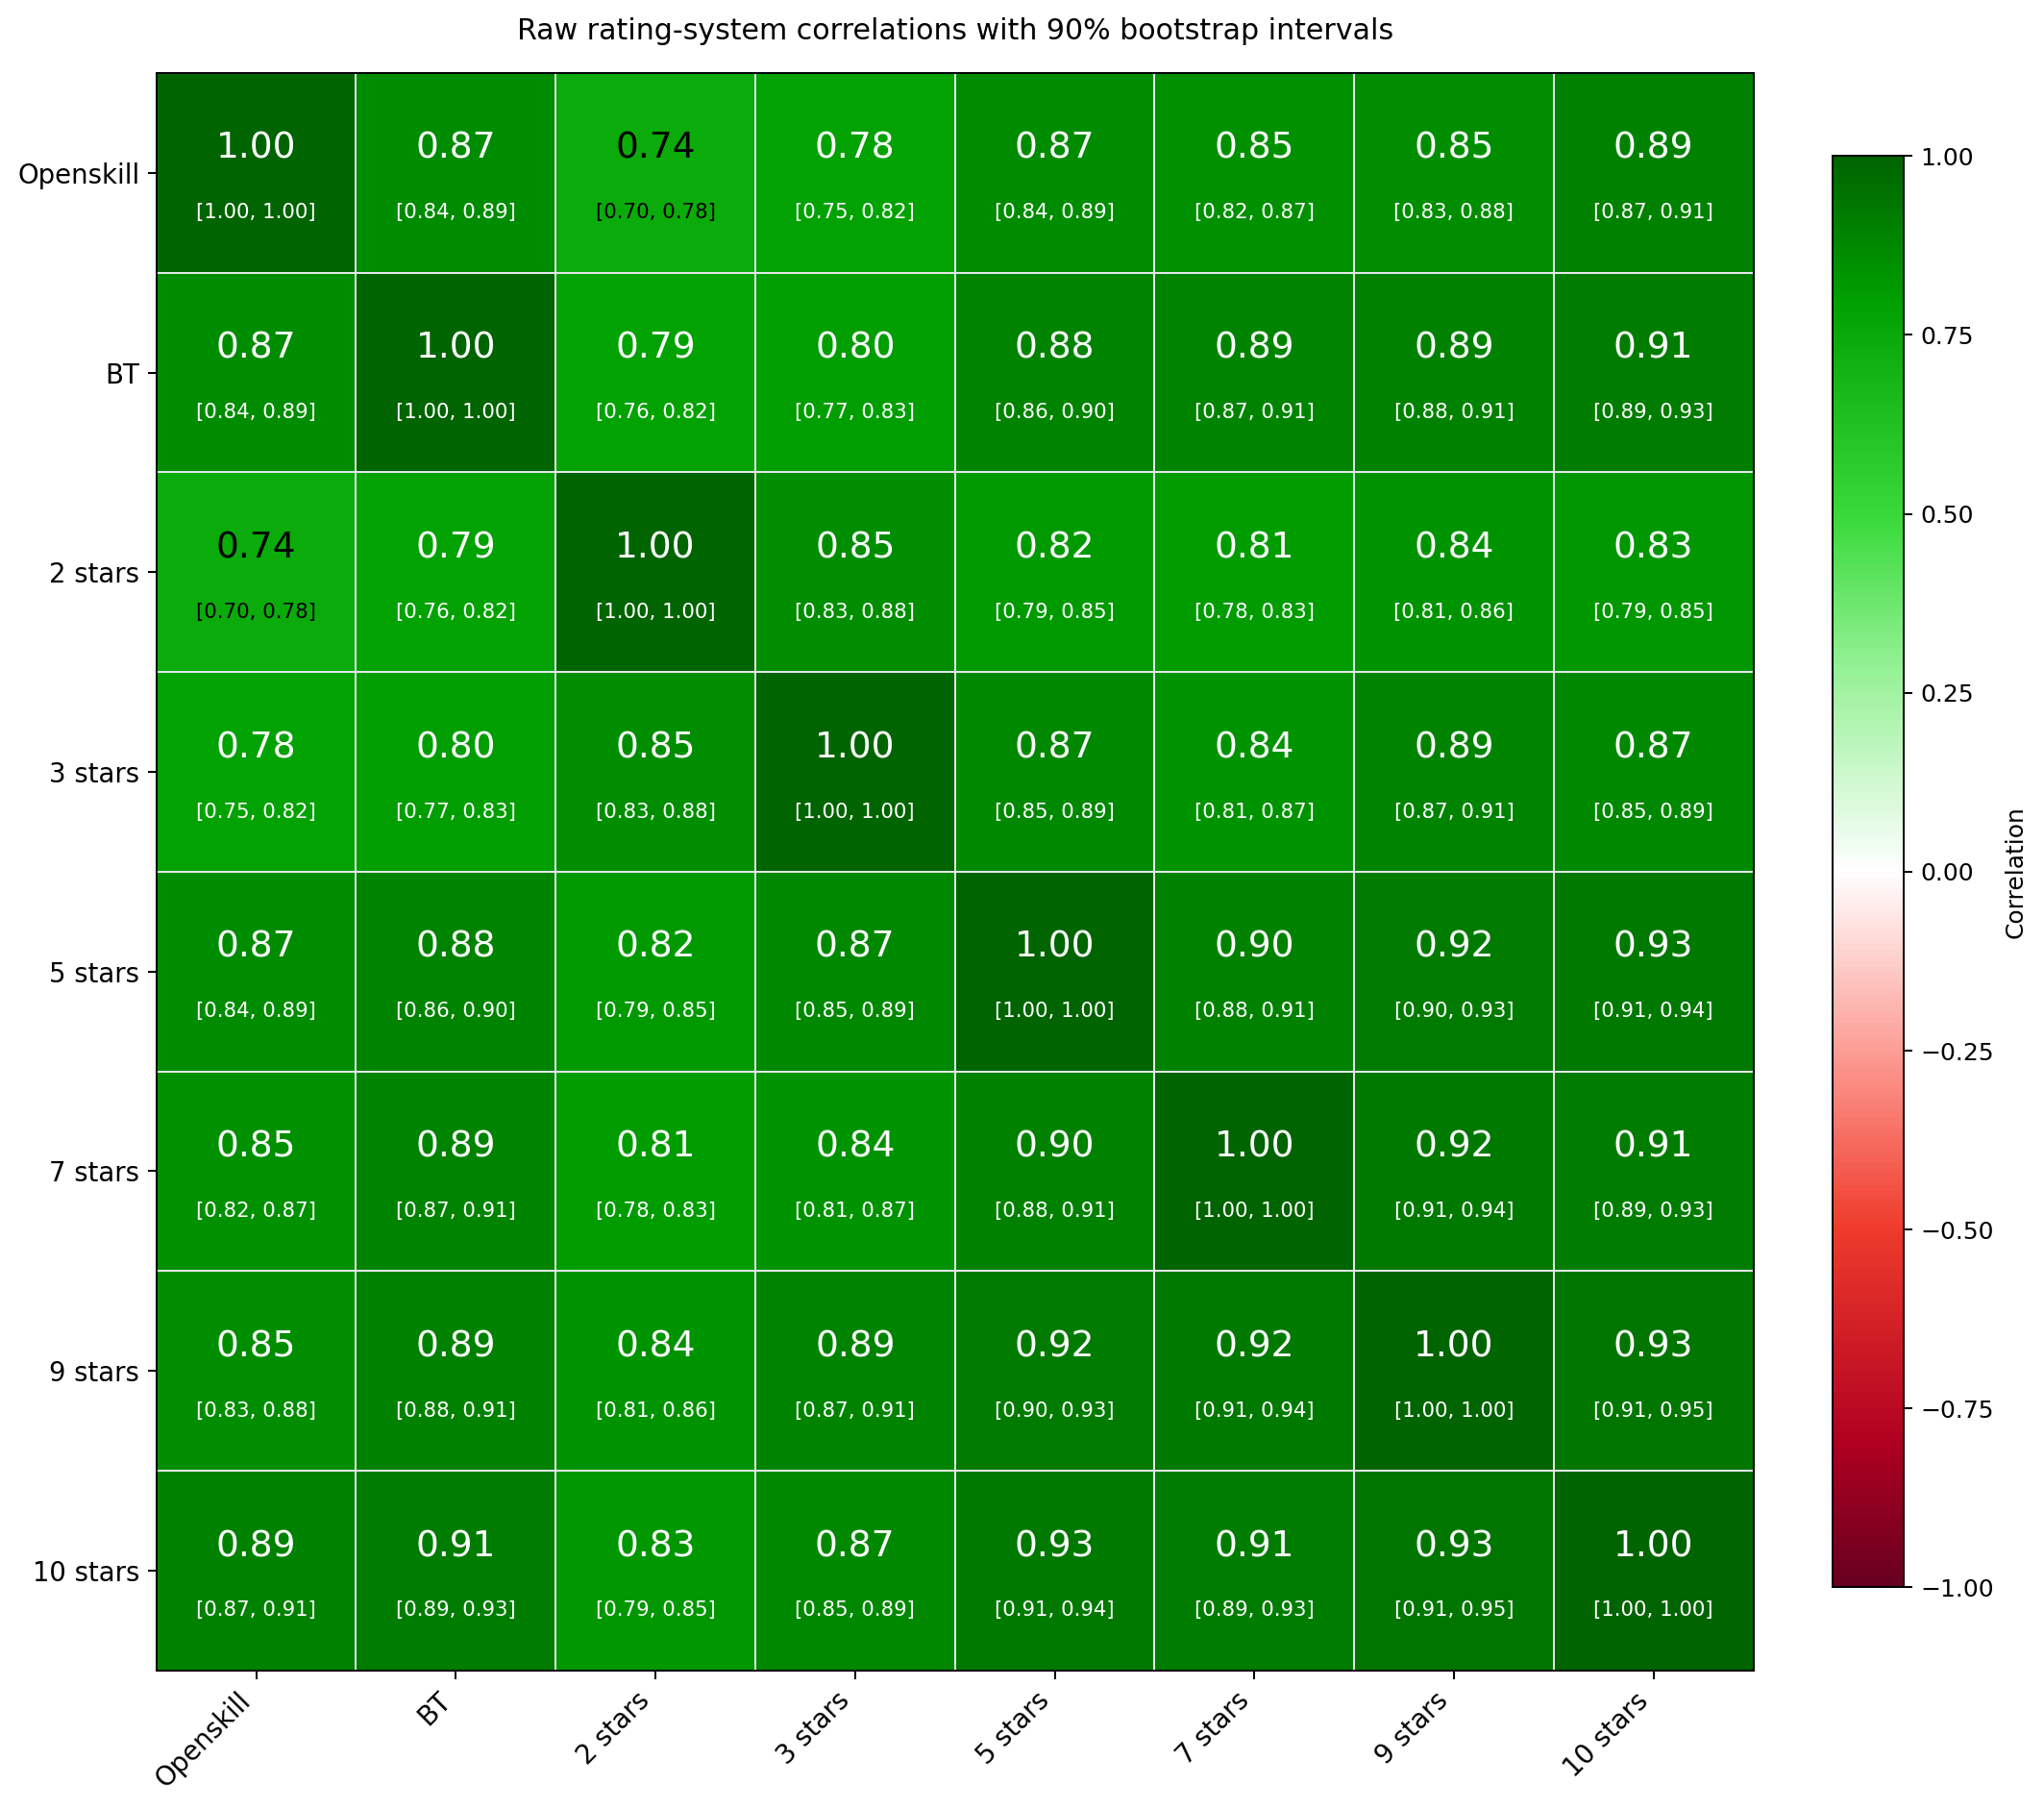
These are some pretty high correlations. In fact, the first principal component accounts for 93% of the variance in the latent correlation matrix. I had previously thought there might be separate method factors for star ratings and comparison-based ratings, but that wasn’t borne out by the data1. So it seems there really is only one factor.
Looking at the factor loadings, the weakest loadings (though still quite strong) belong to the comparison-based rating systems.
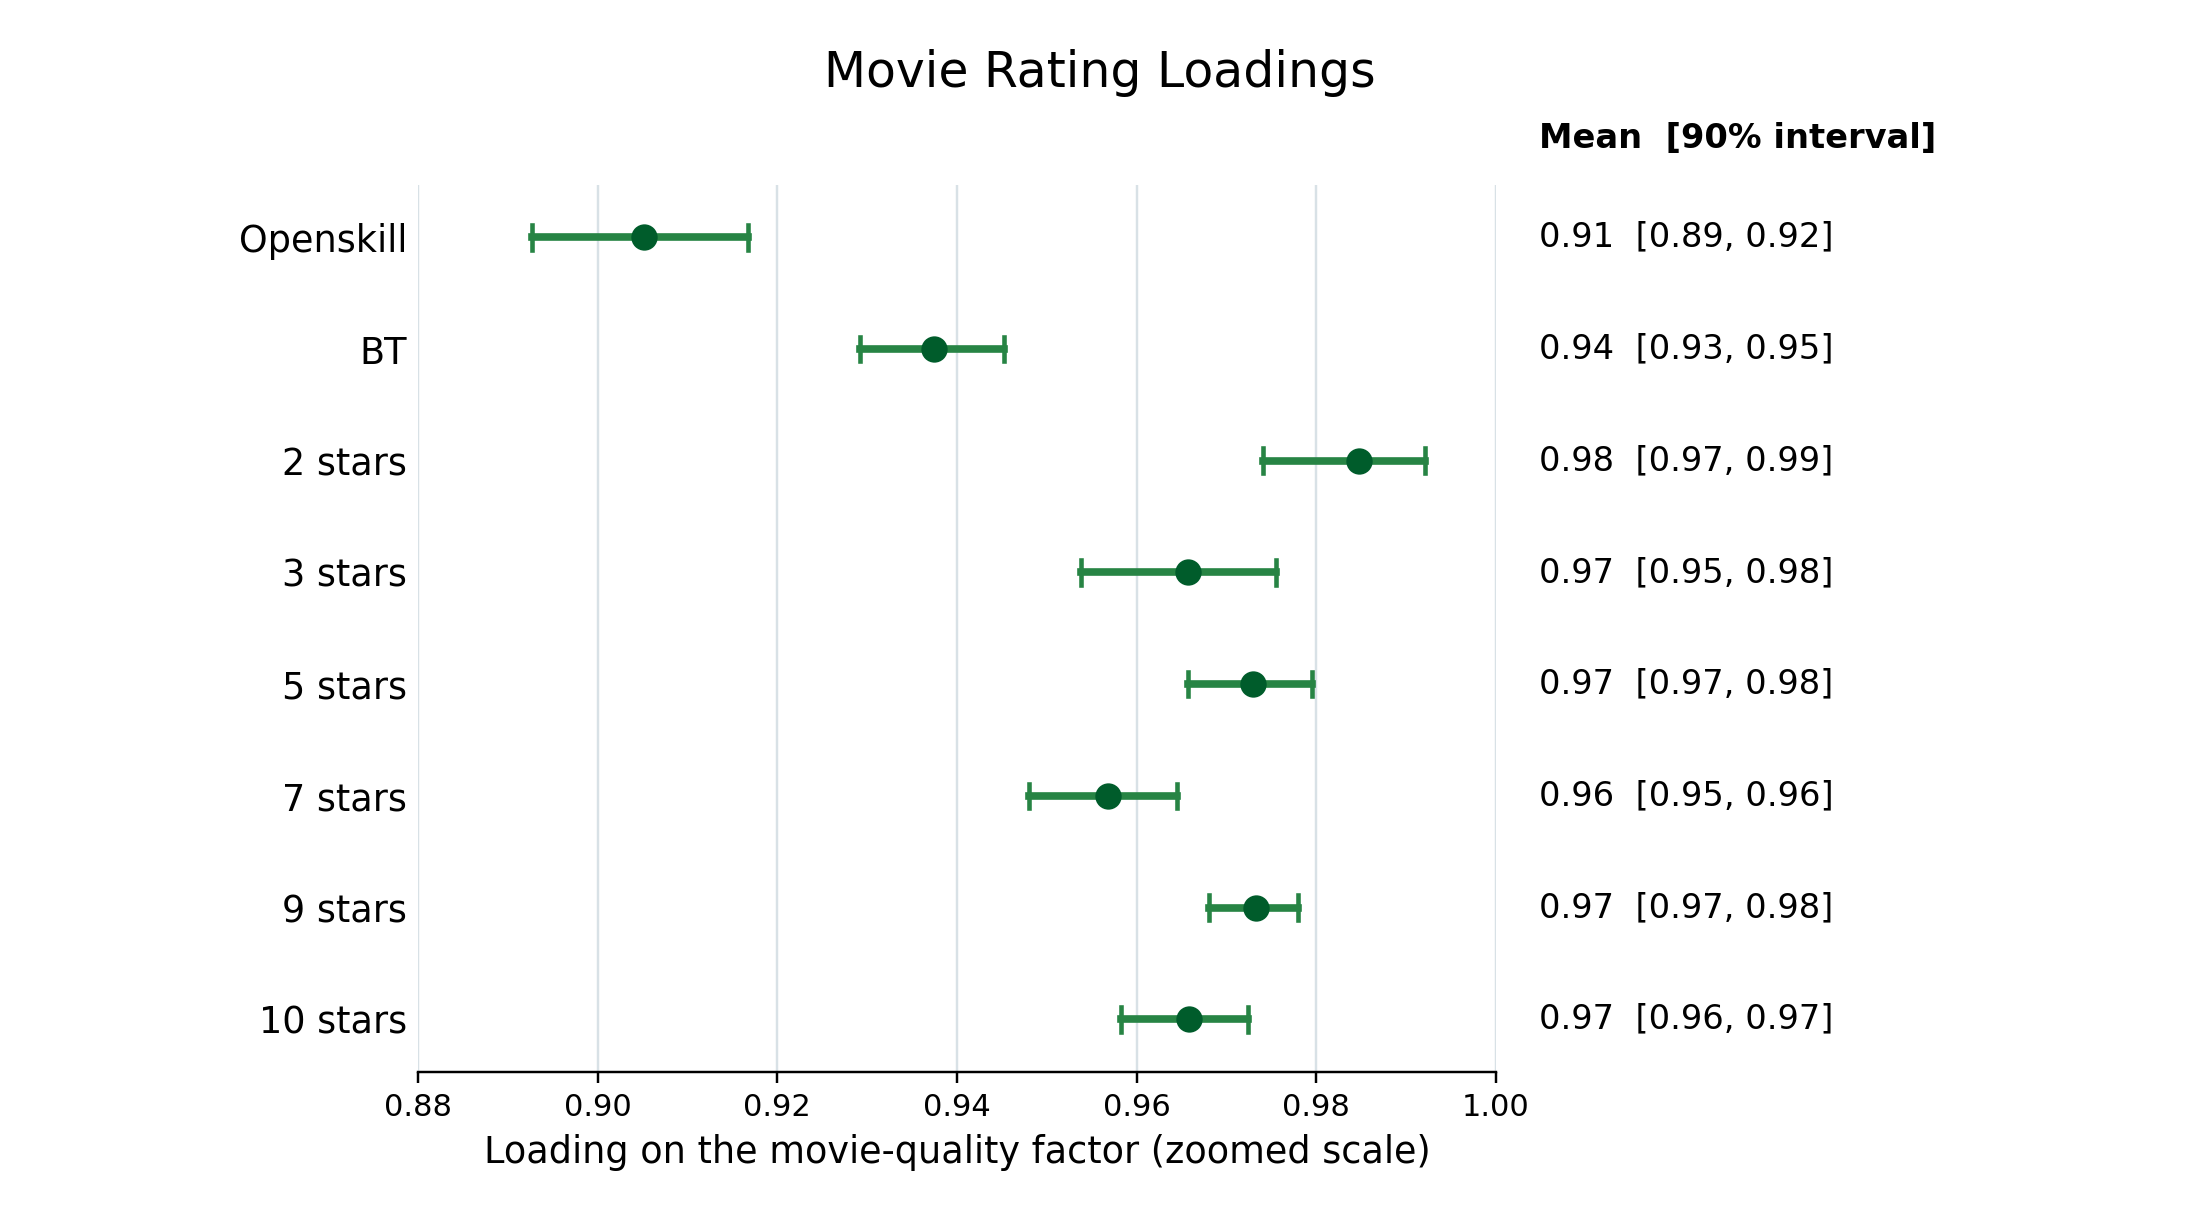
Why is this? I suspect there’s simply more noise in the comparison-based ratings. I find it pretty easy to rate movies using stars. Determining whether I liked a movie or not takes practically no effort. Even determining whether a movie is a 7 vs. 8 on a 10-point scale isn’t that hard. But comparison-based rating systems require more fine-grained judgments than simply placing movies into one of 10 buckets, and that’s harder. Sure, if I’m having a hard time choosing between two movies, I can declare a tie. But looking back, it seems that while sometimes I do declare a tie, other times I pick one movie over the other. This inconsistency introduces noise, weakening the relationship between the ratings and my underlying evaluation of movie quality.
So, star ratings seem to be better than comparison-based ratings, but which star ratings are best? For this, we’ll look at the information functions for each rating system.
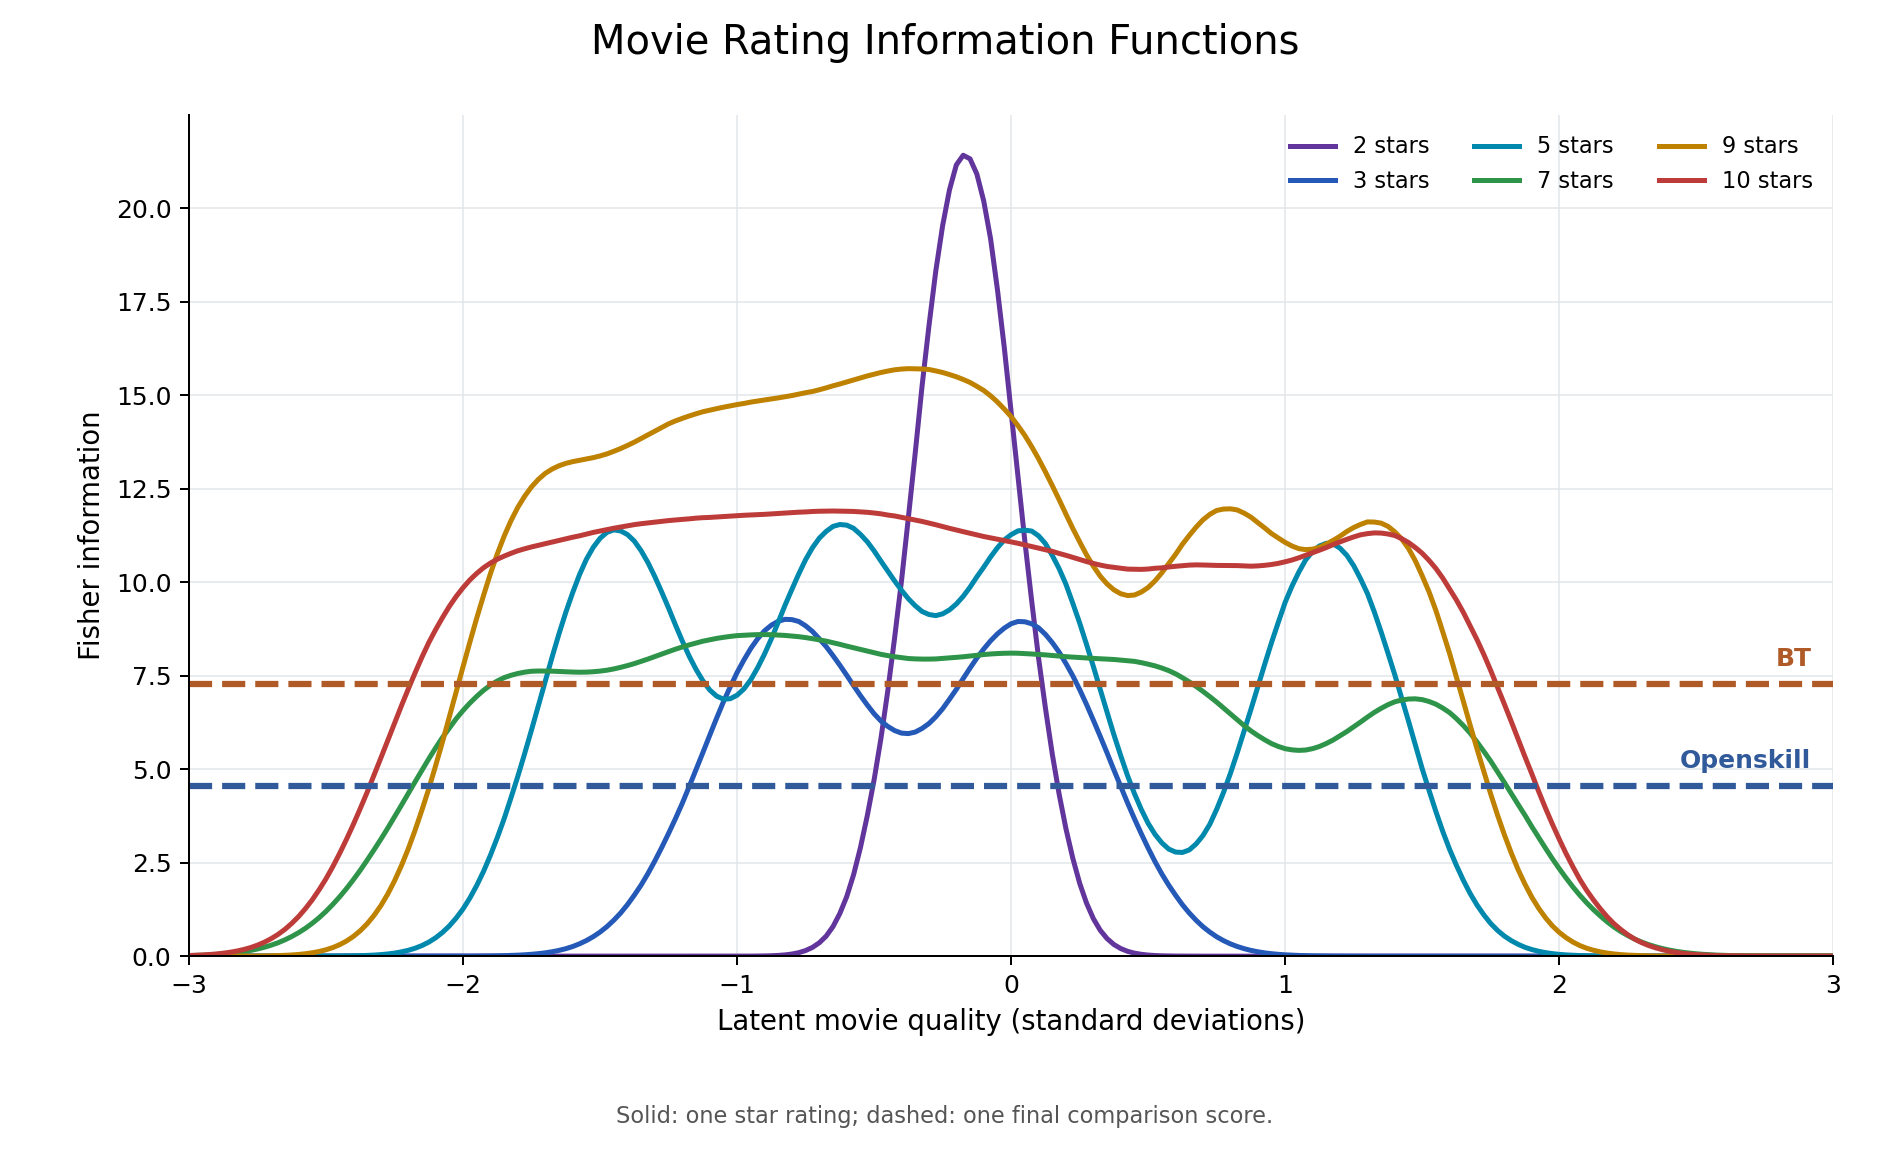
From the chart above, it’s obvious that, say, the 5-star rating system mogs the 3-star system, and the 9-star system mogs the 7-star system. But for other comparisons, it’s much harder to get a clear answer. For example, compared to the 5-star system, the 7-star system covers a broader range, but within the range where they substantially overlap, the 5-star system provides more information (except around a latent quality of ~0.5). And comparing the 2-star system to the 3-star system, while the 2-star system is much better around ~0.2, once we get farther from that, the 3-star system is better. So, let’s use mutual information to summarize how much information we get from each rating system.
| Rating system | Mutual information (bits) |
|---|---|
| 2 stars | 0.81 |
| 3 stars | 1.04 |
| 5 stars | 1.51 |
| 7 stars | 1.51 |
| 9 stars | 1.82 |
| 10 stars | 1.75 |
| Openskill | 1.24 |
| BT | 1.53 |
The 9-star system is the best, closely followed by the 10-star system, with the 5-star, 7-star, and BT rating systems in the middle of the pack. It should come as no surprise that the 2-star system performs the worst.
However, I’m unsatisfied with this method of ranking rating systems. Intuitively, it seems that what I really care about is how well a rating system distinguishes between good movies. Ideally, I’m never going to rewatch bad movies or recommend them to others, so why does it matter how well a rating system distinguishes “bad” from “really bad”? What we really care about is how much information rating systems give us about good movies. A latent quality of ~0.3 seems to be roughly the threshold for what I’d consider a “good” movie, so let’s see how much mutual information each system provides when we restrict our attention to movies with a latent quality of at least 0.3 SD above average.
| Rating system | Conditional mutual information (bits) |
|---|---|
| 2 stars | 0.00 |
| 3 stars | 0.04 |
| 5 stars | 0.62 |
| 7 stars | 0.66 |
| 9 stars | 0.86 |
| 10 stars | 0.88 |
| Openskill | 0.60 |
| BT | 0.79 |
The best rating systems are now the 10-star and 9-star systems, followed by BT. In general, it seems that the more stars we have, the better.
Still, Gwern wasn’t exactly wrong. It does seem that, for most people, more stars don’t necessarily make for better ratings. YouTube famously had a 5-star rating system, which it eventually scrapped in favor of a binary like/dislike system after noticing that the vast majority of ratings were 5 stars, with 1 star a distant second and the other ratings practically nonexistent. Netflix later made a similar switch. Why do I get such different results?
Because I’m built different. And better2. I am simply better than everyone else. Except the Japanese.

The Japanese are, anecdotally, the only people who know how to properly use a 5-star rating system. In fact, they’re supposedly so strict with their ratings that you’re better off looking for places with 3–4 stars than places with 5; only tourists would be so uncouth as to give something 5 stars. And this seems to work out for them.
So, it seems we could fix rating systems if everyone would just be stricter with their ratings. But everyone won’t just. Rating platforms could adjust for individual users’ rating tendencies, but apparently this is considered “lacking in transparency” and “deceptive”. We could try comparison-based ratings instead, but they don’t seem to have caught on much outside a few niches, like LLM evaluation. Besides, as I’ve shown, star ratings, when used properly, are better.
In the end, I suppose we get the rating systems we deserve.

-
The 2-factor model fits marginally better than the 1-factor model, but the estimated correlation between the star-rating and comparison-based factors is 0.98… so they’re effectively the same factor. The significant modification indices for the 1-factor model all suggested negative residual correlations between rating systems, so I didn’t make any changes based on them. ↩
-
Maybe even better than the gods. ↩