LiveBench Mostly Measures One General Ability
LiveBench is an LLM benchmark with tasks grouped into categories. I’ll analyze its April 7, 2025 public release, which included 18 tasks across six categories. Item-level data were available for seven tasks across three categories: Coding (LCB Generation and Coding Completion), Language (Connections, Plot Unscrambling, and Typos), and Instruction Following (Paraphrase and Story Generation). Unfortunately, I can’t analyze the other tasks because LiveBench didn’t release their item-level data, which is essential for this kind of analysis.
Here’s what each task involves:
LCB Generation (Category: Coding)
The model receives a programming problem (typically from LiveCodeBench) and must write a complete solution which is then run against test cases. The model receives a score of 1 if it passes and 0 if it fails; there is no partial credit.
Coding Completion (Category: Coding)
The model receives a programming problem and a fragment of a correct solution, which it must complete. Scoring is the same as for LCB Generation.
Connections (Category: Language)
The Connections task works much like the NYT game of the same name. The model receives a shuffled list of words and must sort them into groups of four, with each group sharing a theme. For example:
bass, cod, salmon, trout→ fishapple, banana, pear, peach→ fruit
LiveBench uses 8 words (2 groups), 12 words (3 groups), or 16 words (4 groups). The score is the fraction of complete groups identified correctly.
Plot Unscrambling (Category: Language)
The model receives the sentences of a recent movie synopsis in random order and must reconstruct the original narrative. The evaluator fuzzy-matches the response to the original sentences, allowing minor transcription changes, then measures the edit distance between the proposed and correct orders:
\[\text{score} = 1 - \frac{d}{n}\]where $d$ is the ordering distance and $n$ is the number of sentences.
Typos (Category: Language)
The model receives text (usually based on a recent arXiv abstract) with synthetic spelling errors inserted. It must correct the misspellings while leaving everything else unchanged. That means it shouldn’t rewrite the text, change punctuation, change US spelling to UK spelling or vice versa, or add stylistic “improvements”. The scorer gives 1 if the ground-truth text appears anywhere in the output and 0 otherwise. Thus, despite the instruction, extra surrounding text does not necessarily cause a failure.
Paraphrase (Category: Instruction Following)
The model receives the beginning of a recent Guardian article and is asked to paraphrase it while following several mechanically verifiable instructions. For example:
Paraphrase this article. Include a title. Use the words “course,” “media,” and “sun.” Write exactly three paragraphs. Begin the first paragraph with “hand.”
LiveBench scores compliance with the explicit instructions, not the quality of the paraphrase. In fact, it doesn’t care about the actual paraphrase at all; models can receive full credit without ever attempting to paraphrase the article. It averages two components:
- Prompt-level accuracy:
1only if every instruction was followed; otherwise0. - Instruction-level accuracy: the fraction of individual instructions followed.
Story Generation (Category: Instruction Following)
The model receives a recent news article and is asked to generate a story based on it while following mechanically verifiable instructions. LiveBench uses the same two-component scoring method as Paraphrase.
The seven tasks report different kinds of item scores. Here is how LiveBench’s published scores relate to the responses I use in this analysis:
| Task | LiveBench’s published item score | Response used in this analysis |
|---|---|---|
| LCB Generation | Pass/fail: 0 or 1 | Binary, unchanged |
| Coding Completion | Pass/fail: 0 or 1 | Binary, unchanged |
| Connections | Fraction of complete four-word groups identified correctly; an item has two, three, or four groups | Ordered partial credit, unchanged |
| Typos | Exact-match pass/fail: 0 or 1 | Binary, unchanged |
| Plot Unscrambling | One minus ordering edit distance divided by the number of sentences; bounded between 0 and 1 | Count-adjusted logit of the score, treated as continuous |
| Paraphrase | Average of all-instructions-correct accuracy and the fraction of individual instructions followed | Instruction-level fraction only, modeled as ordered partial credit |
| Story Generation | Same two-component score as Paraphrase | Instruction-level fraction only, modeled as ordered partial credit |
I don’t like how Paraphrase and Story Generation are currently graded. Their published scores average instruction-level accuracy with an all-or-nothing prompt-level component, so missing just one instruction costs more than half the grade. I therefore use instruction-level accuracy alone.
For Plot Unscrambling, I logit-transform the score using this count-adjusted formula:
\[\text{transformed score} = \log\left(\frac{n - D + \frac{1}{2}}{D + \frac{1}{2}}\right)\]where $D$ is the edit distance and $n$ is the number of sentences.
Determining the Number of Factors
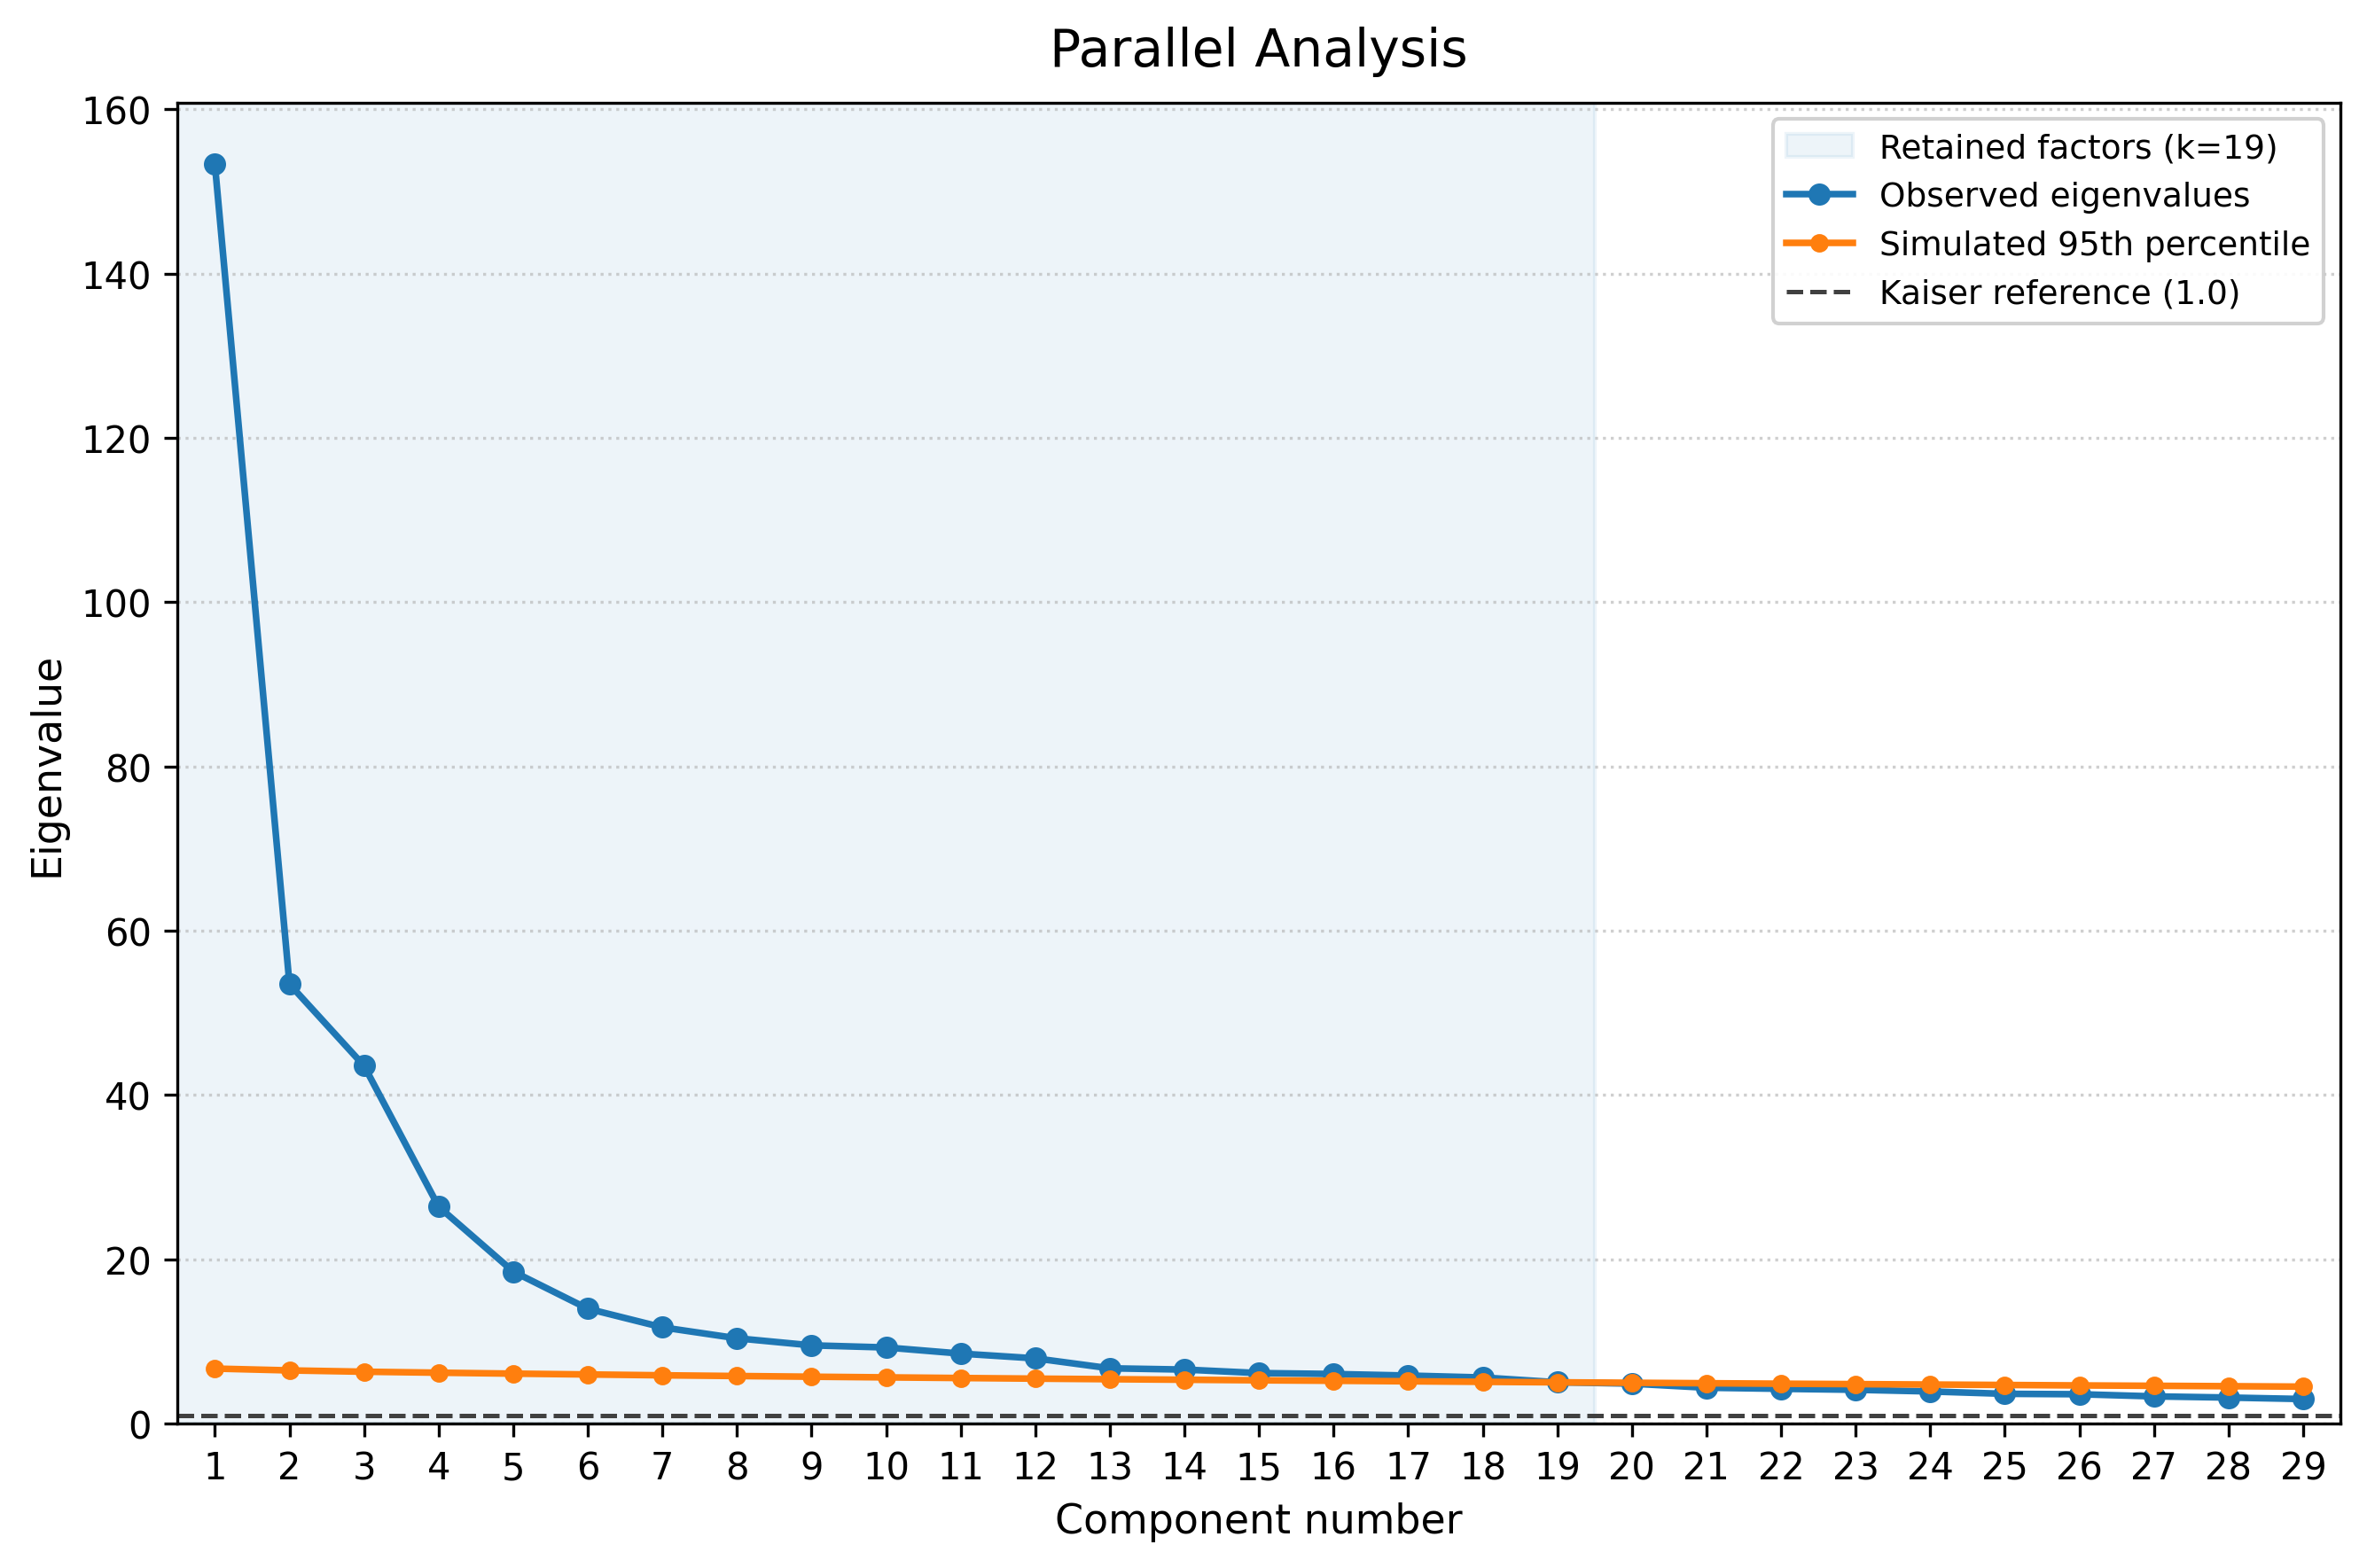
Naturally, I used parallel analysis to determine the number of factors. It yielded 19, which is a lot (see the plot).
However, some item pairs have no models in common, and others have only a few, making their correlations unavailable or imprecise. So I modeled the correlation matrix Bayesianly and repeated parallel analysis across posterior draws to see how much the recommended factor count varies. Each of the first 12 factors exceeds the chance threshold in at least 95% of posterior draws, and the 90% interval for the number retained is 12–13.
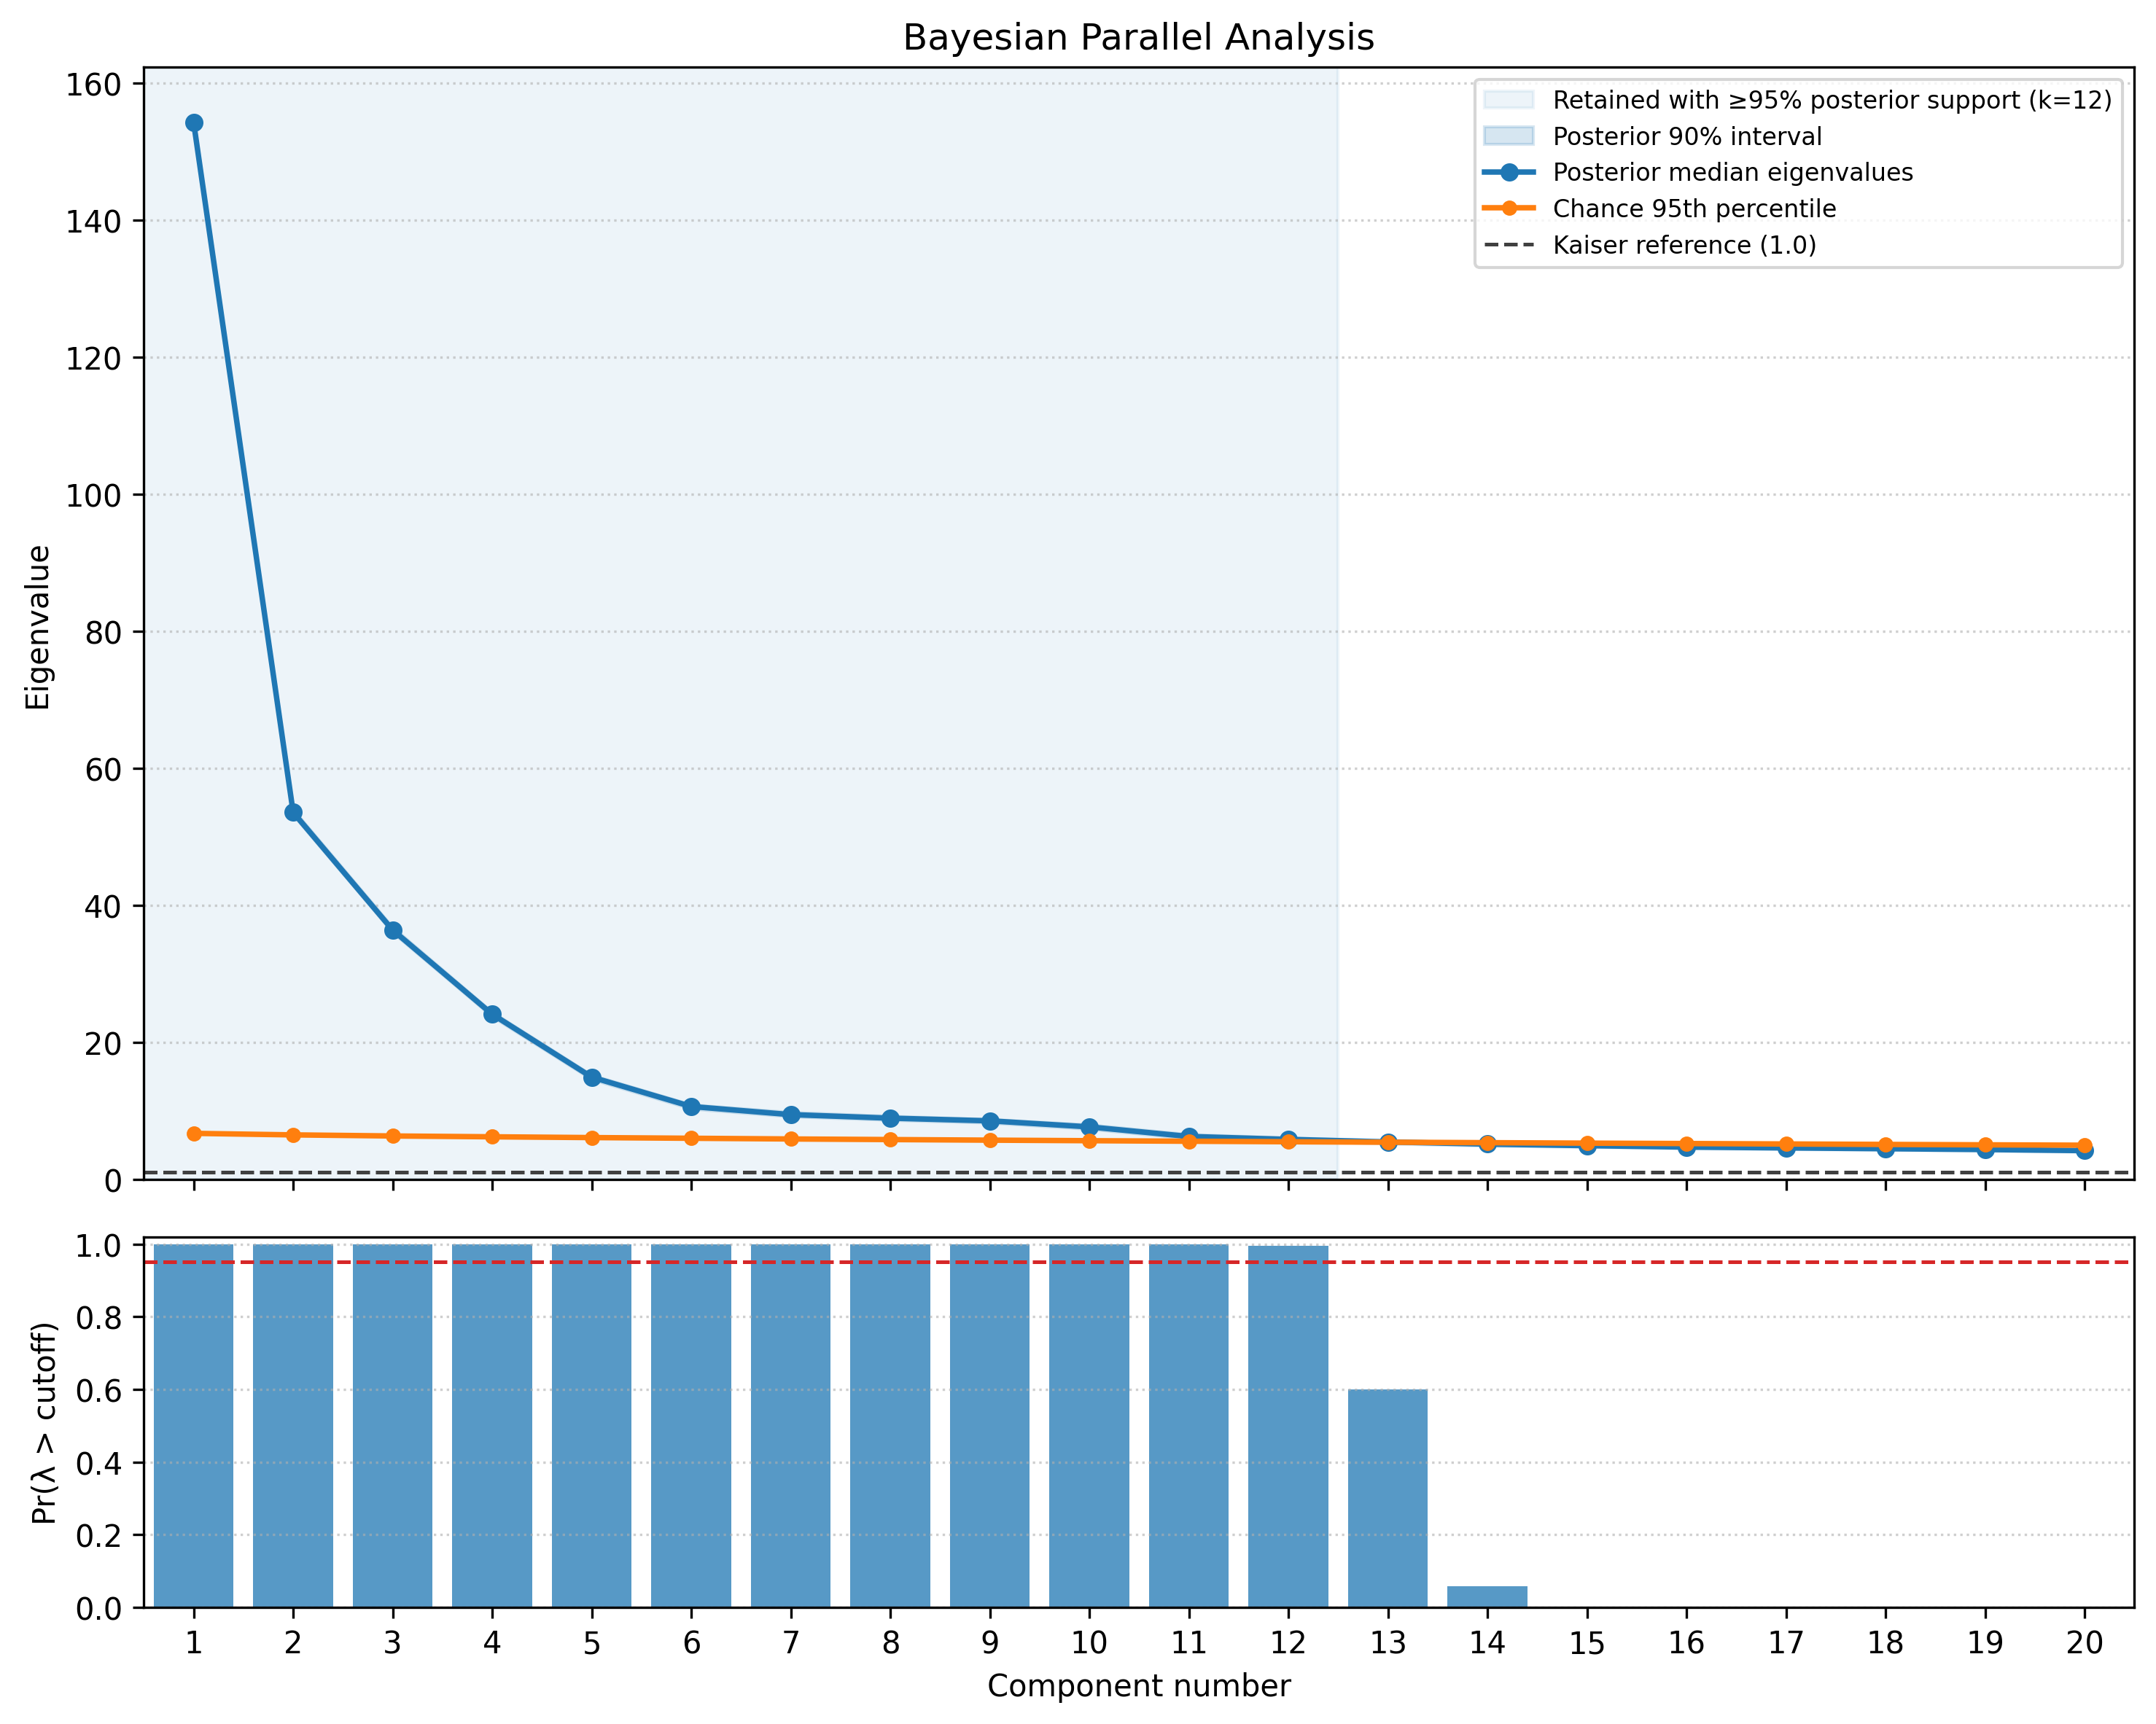
Even 12–13 factors is a lot for seven tasks. I would have expected something closer to seven, so let’s look at the tasks individually to see where the extra dimensions might be coming from.
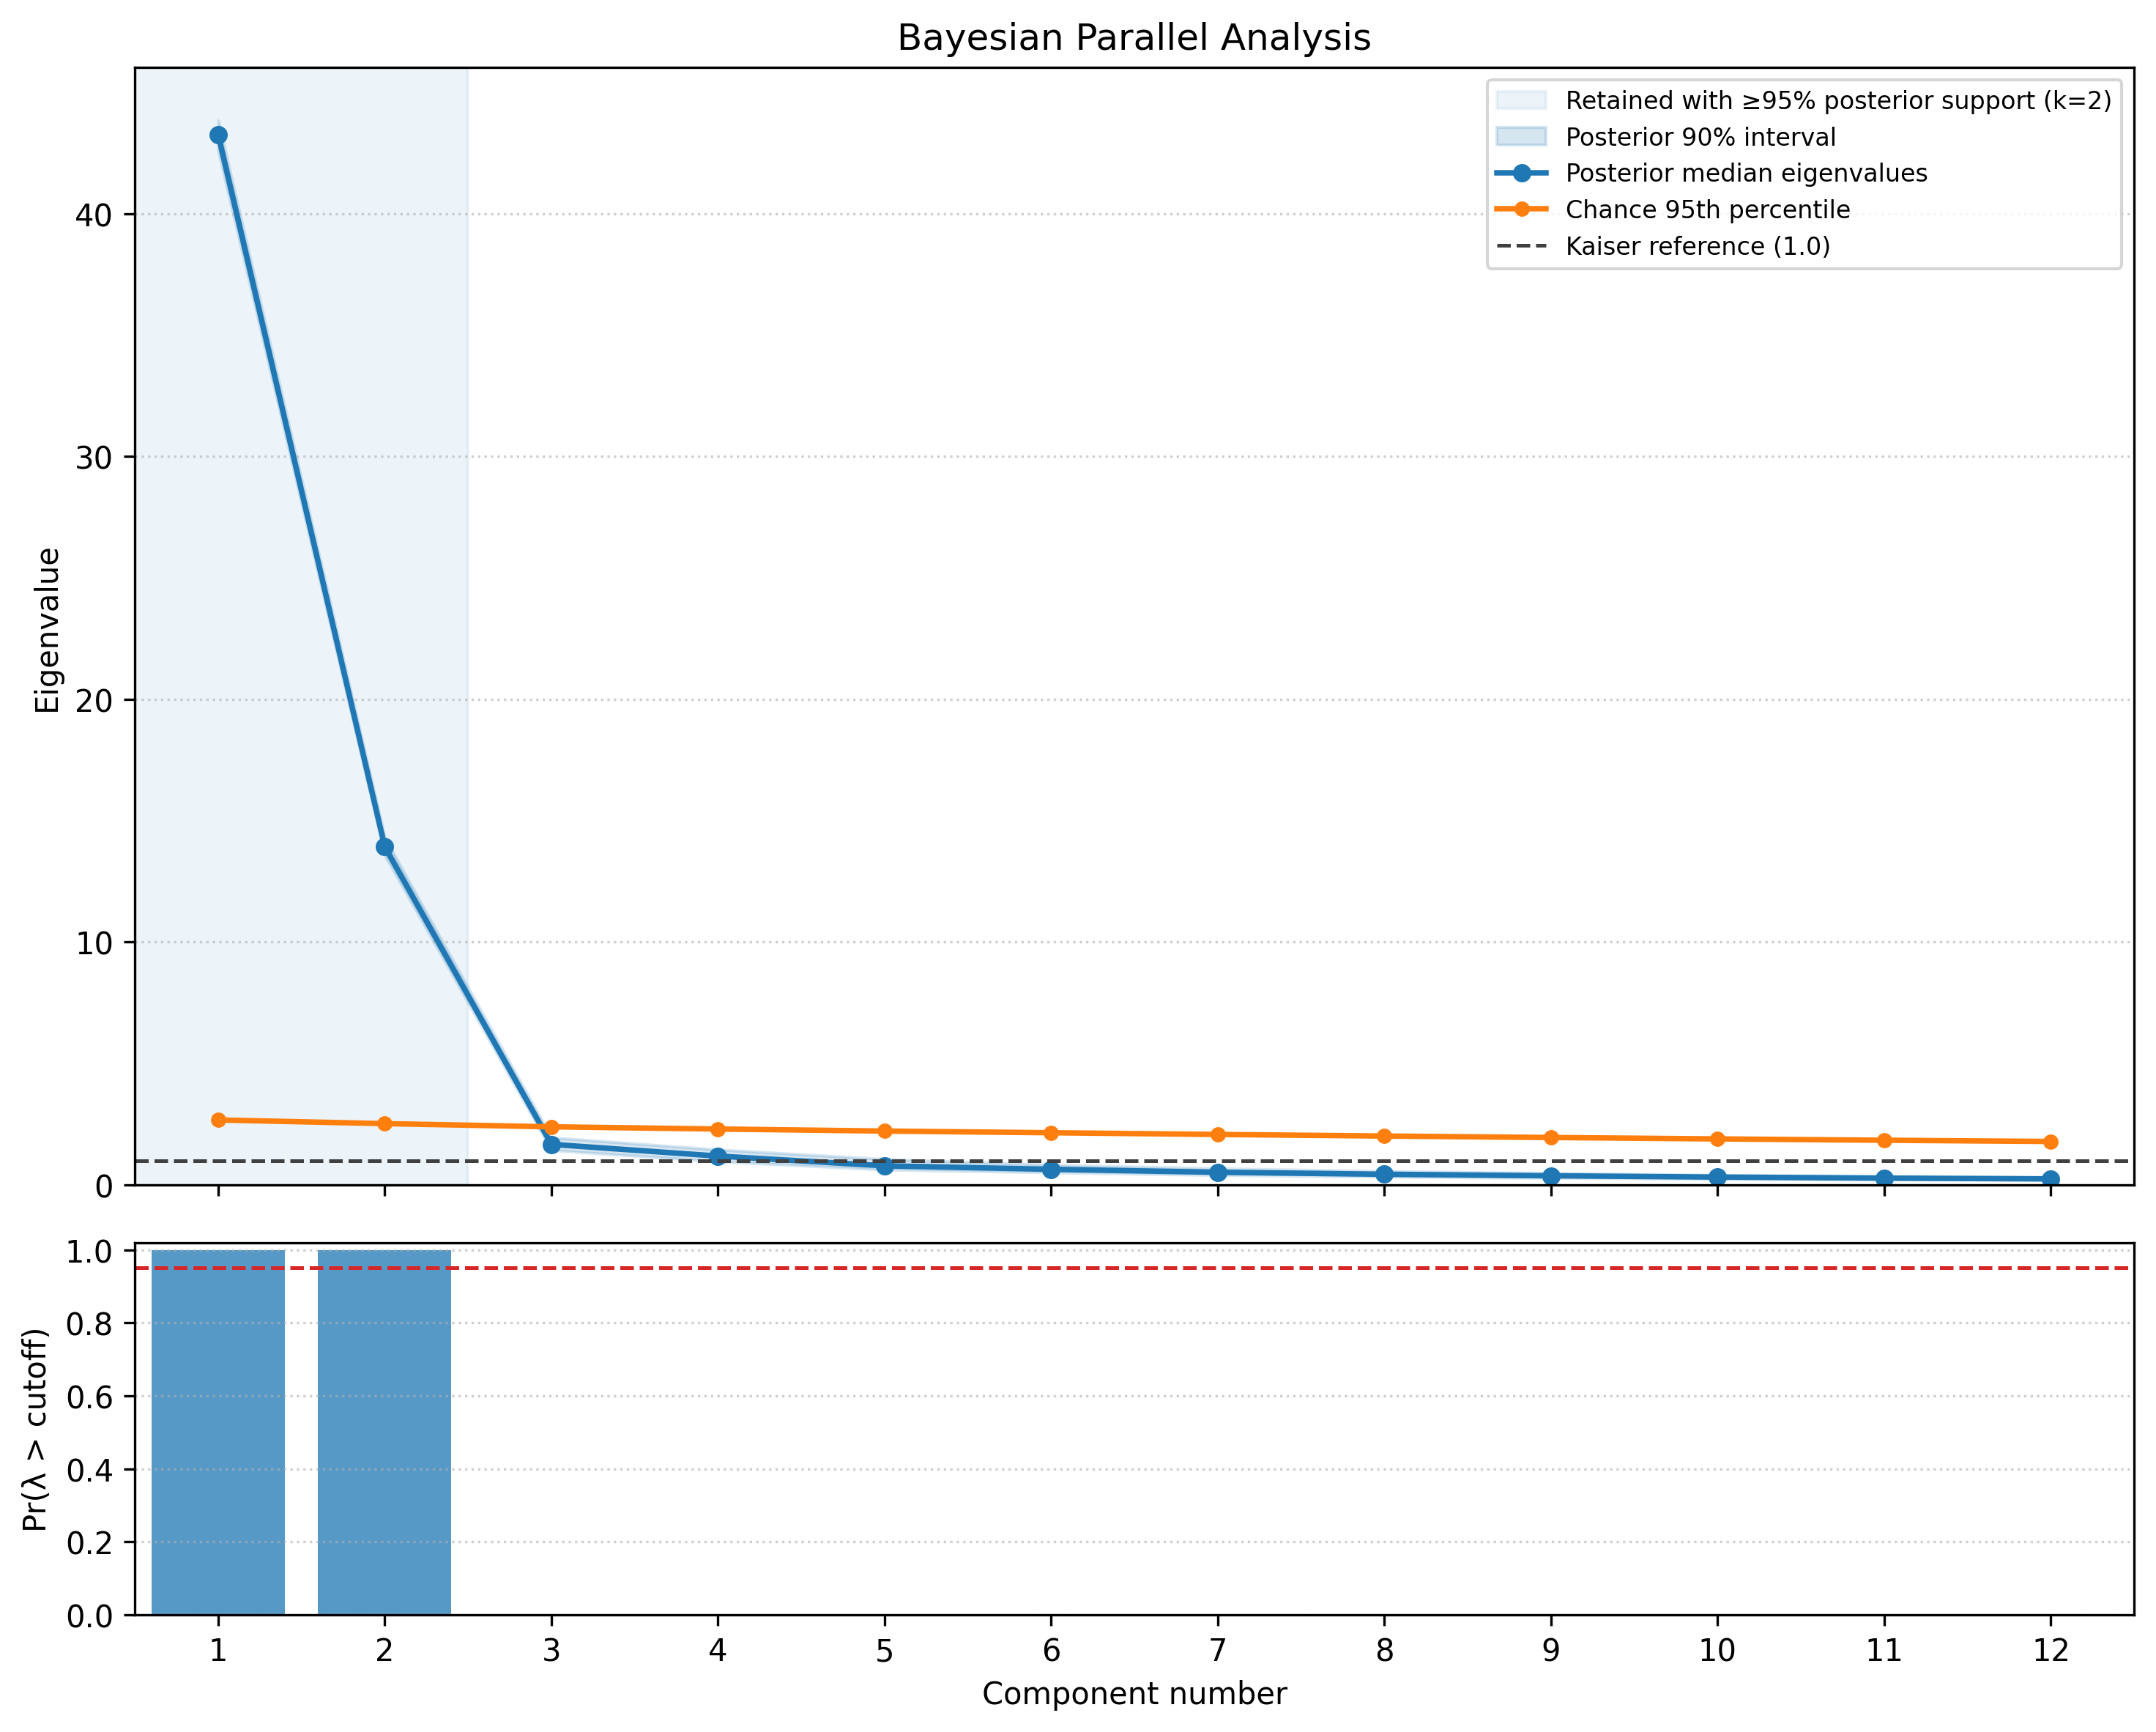
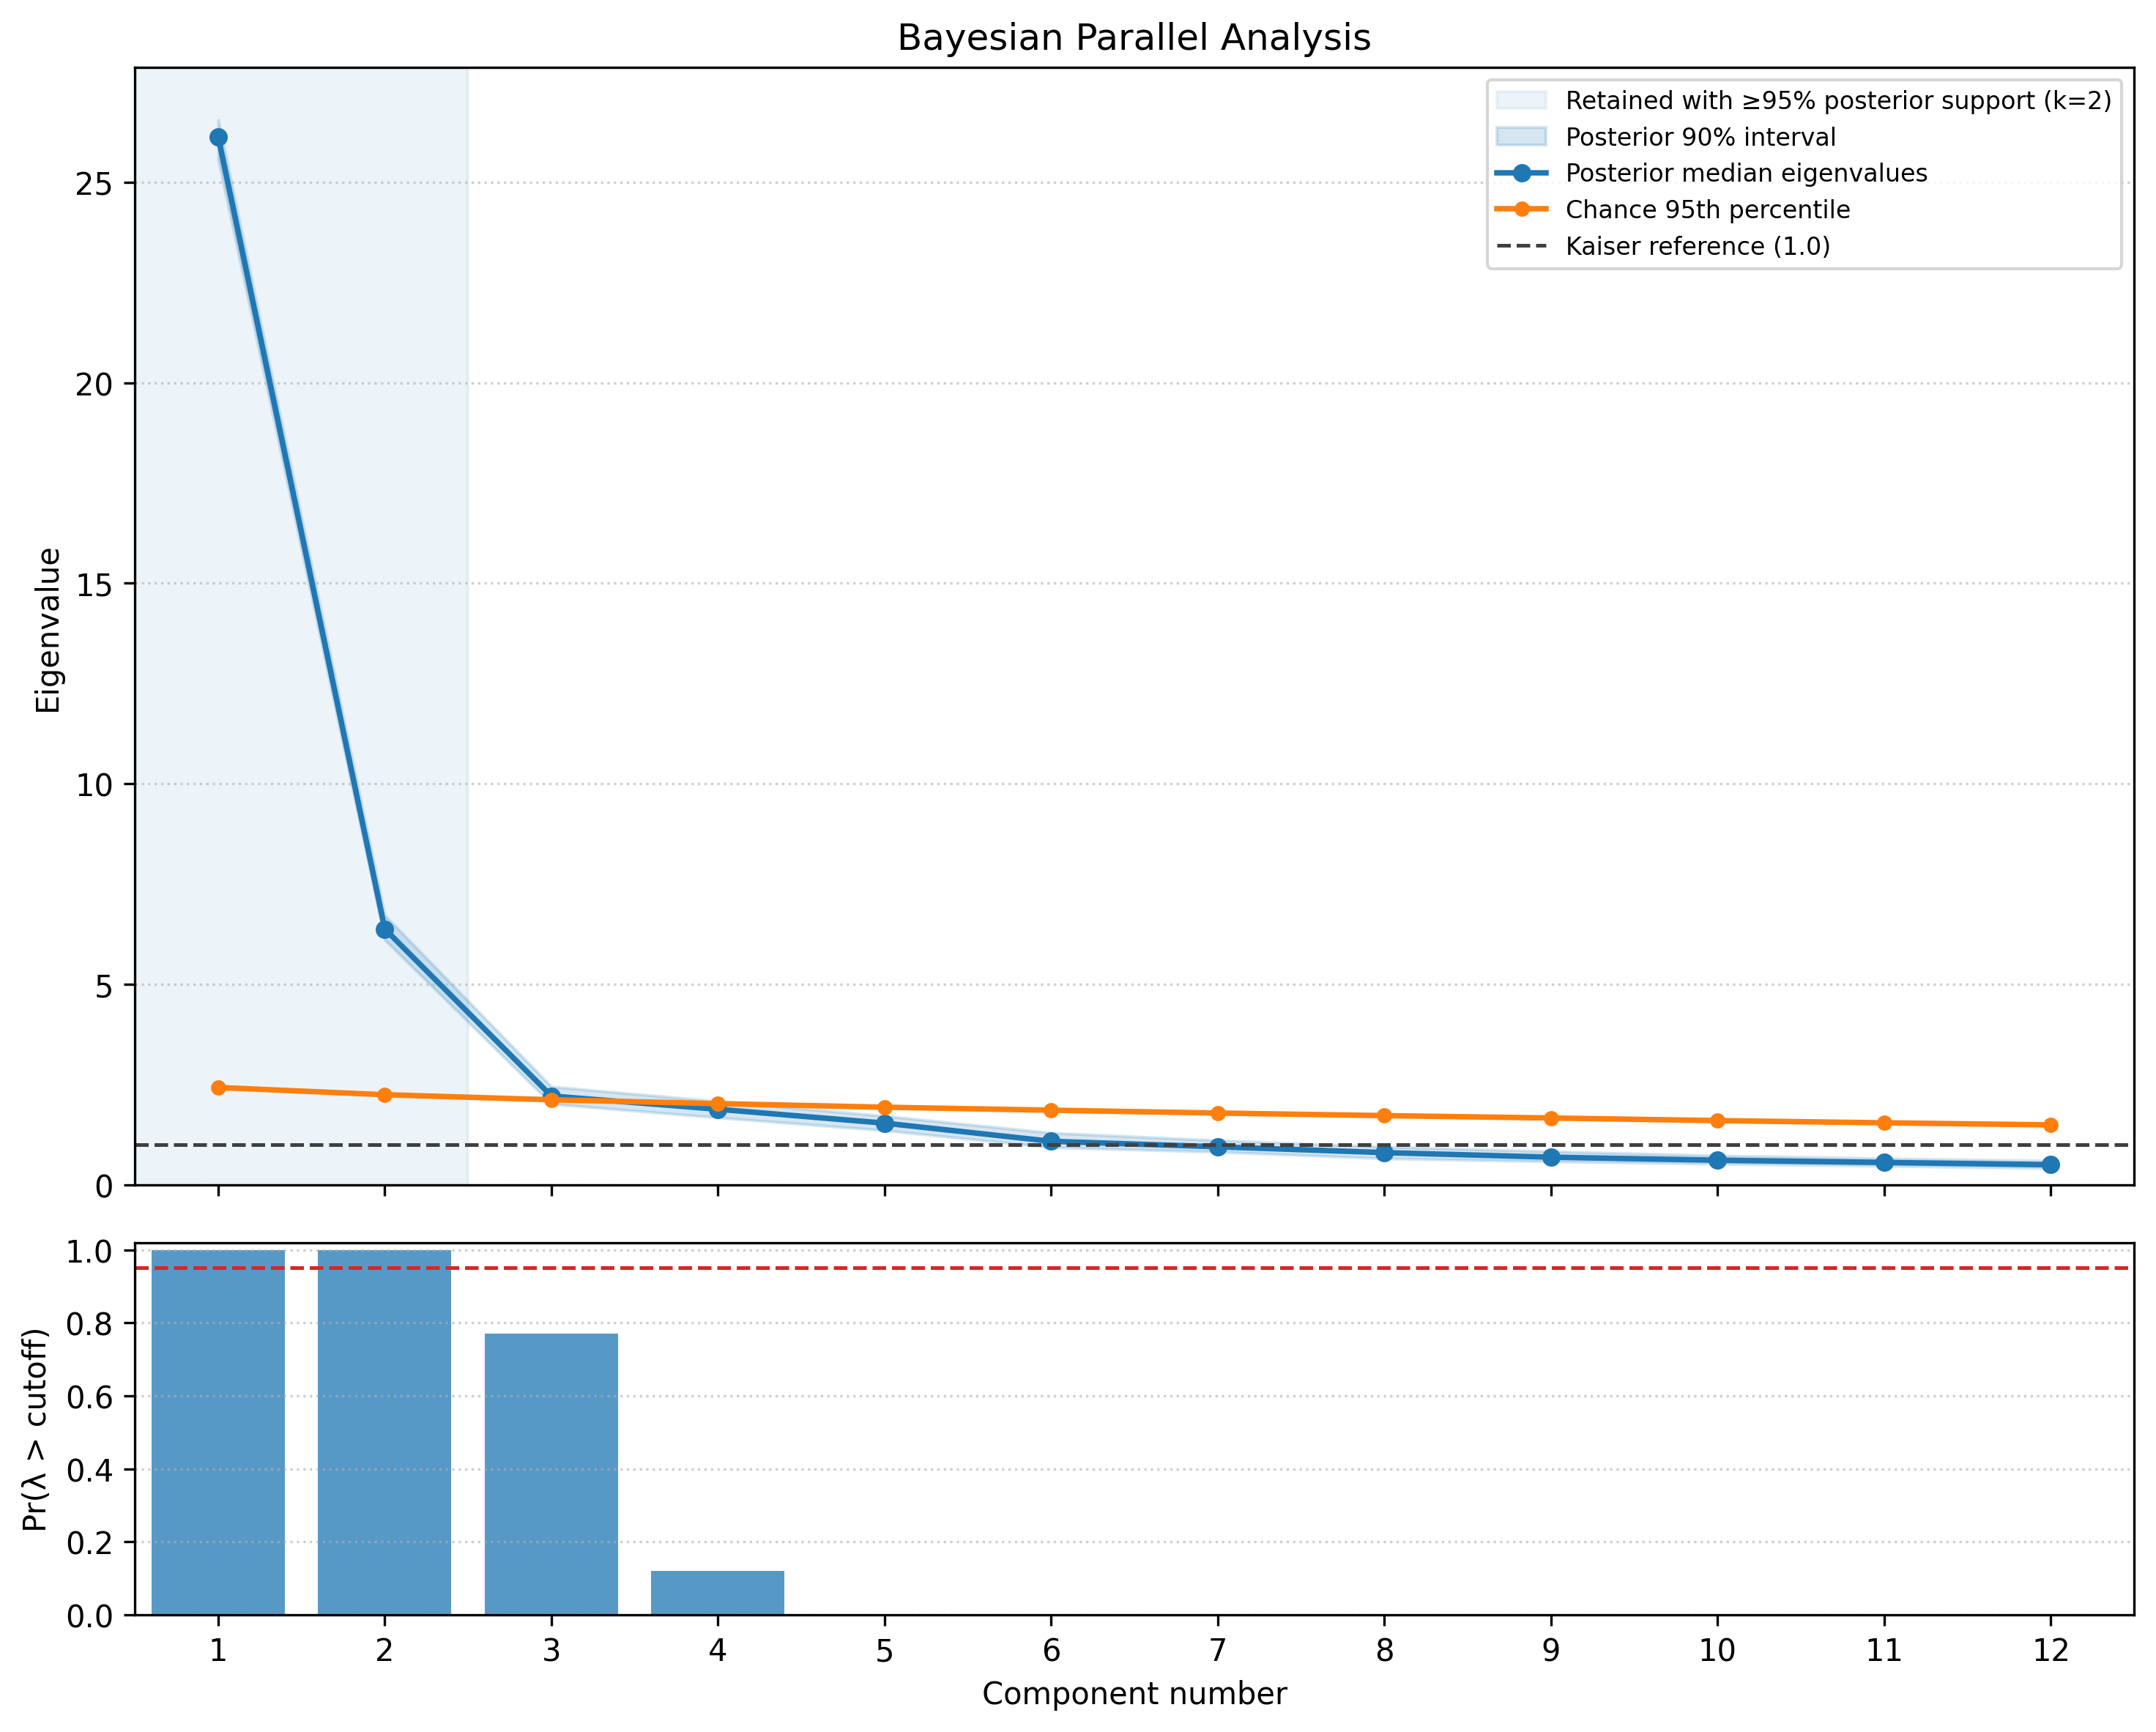
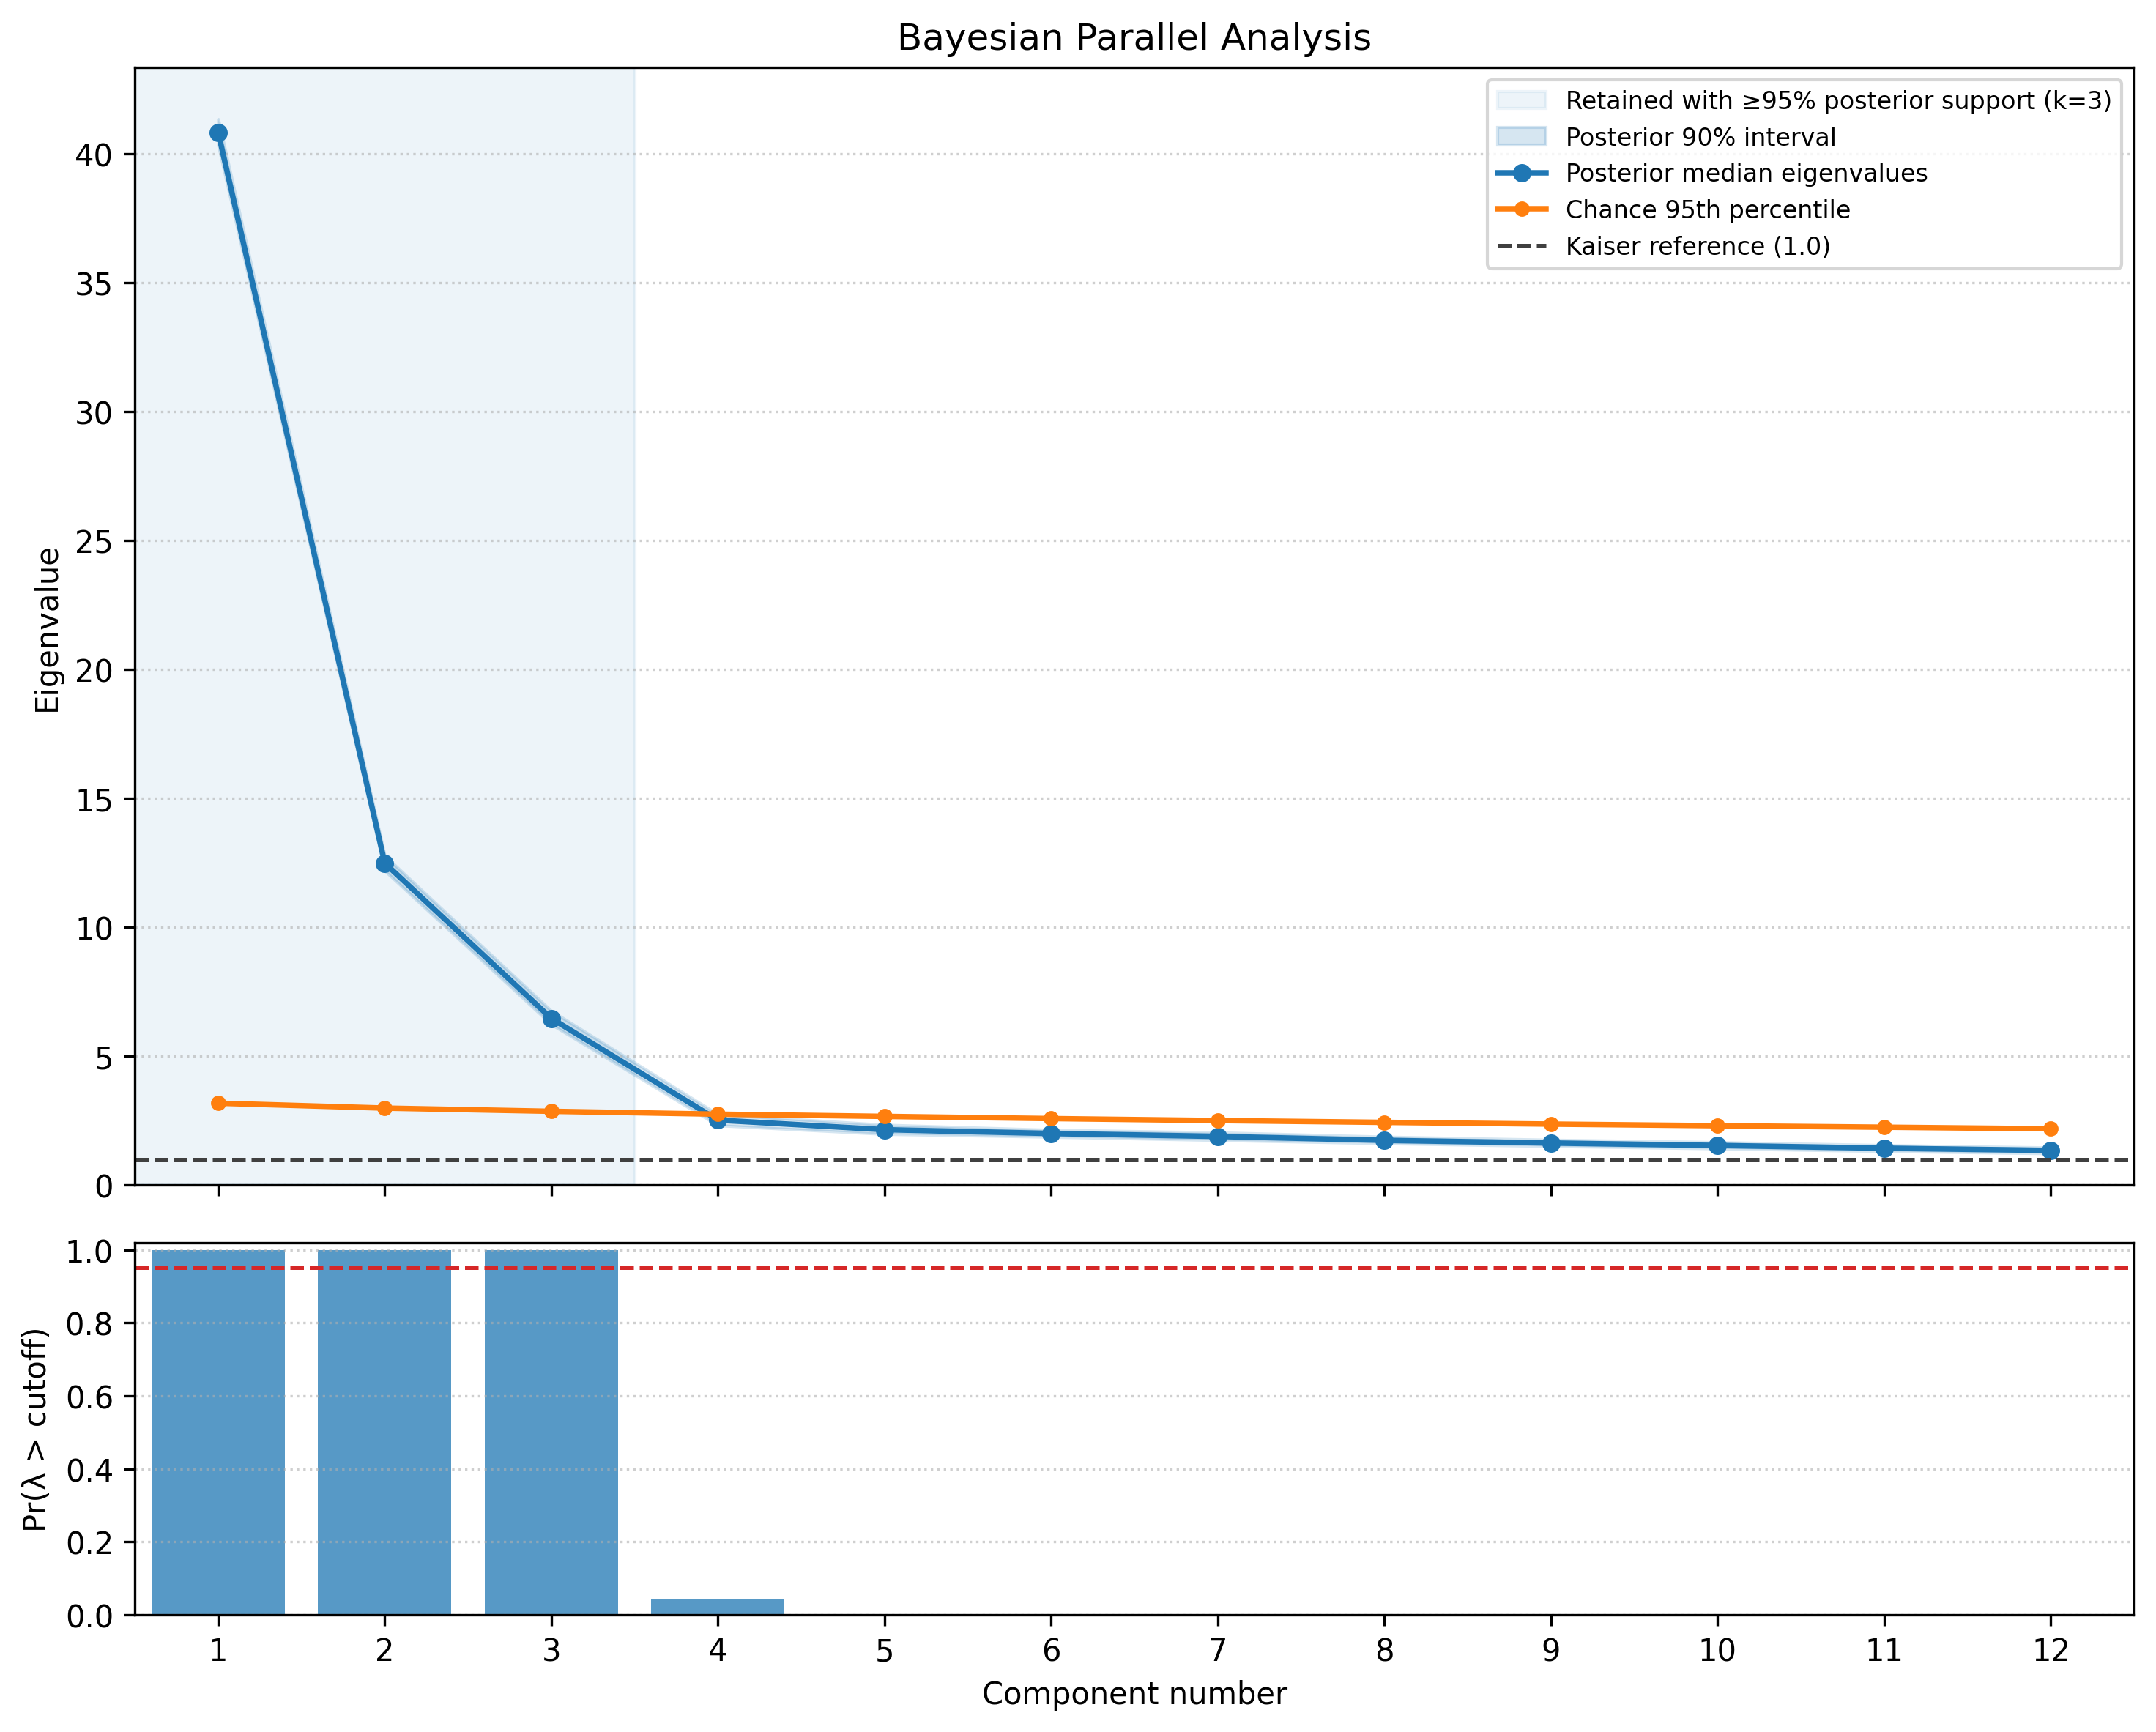
Select a task to see its Bayesian parallel analysis. The badge counts leading factors above the chance threshold in at least 95% of posterior draws.
LCB Generation2 factors
Coding Completion2 factors
Connections3 factors
Plot Unscrambling2 factors
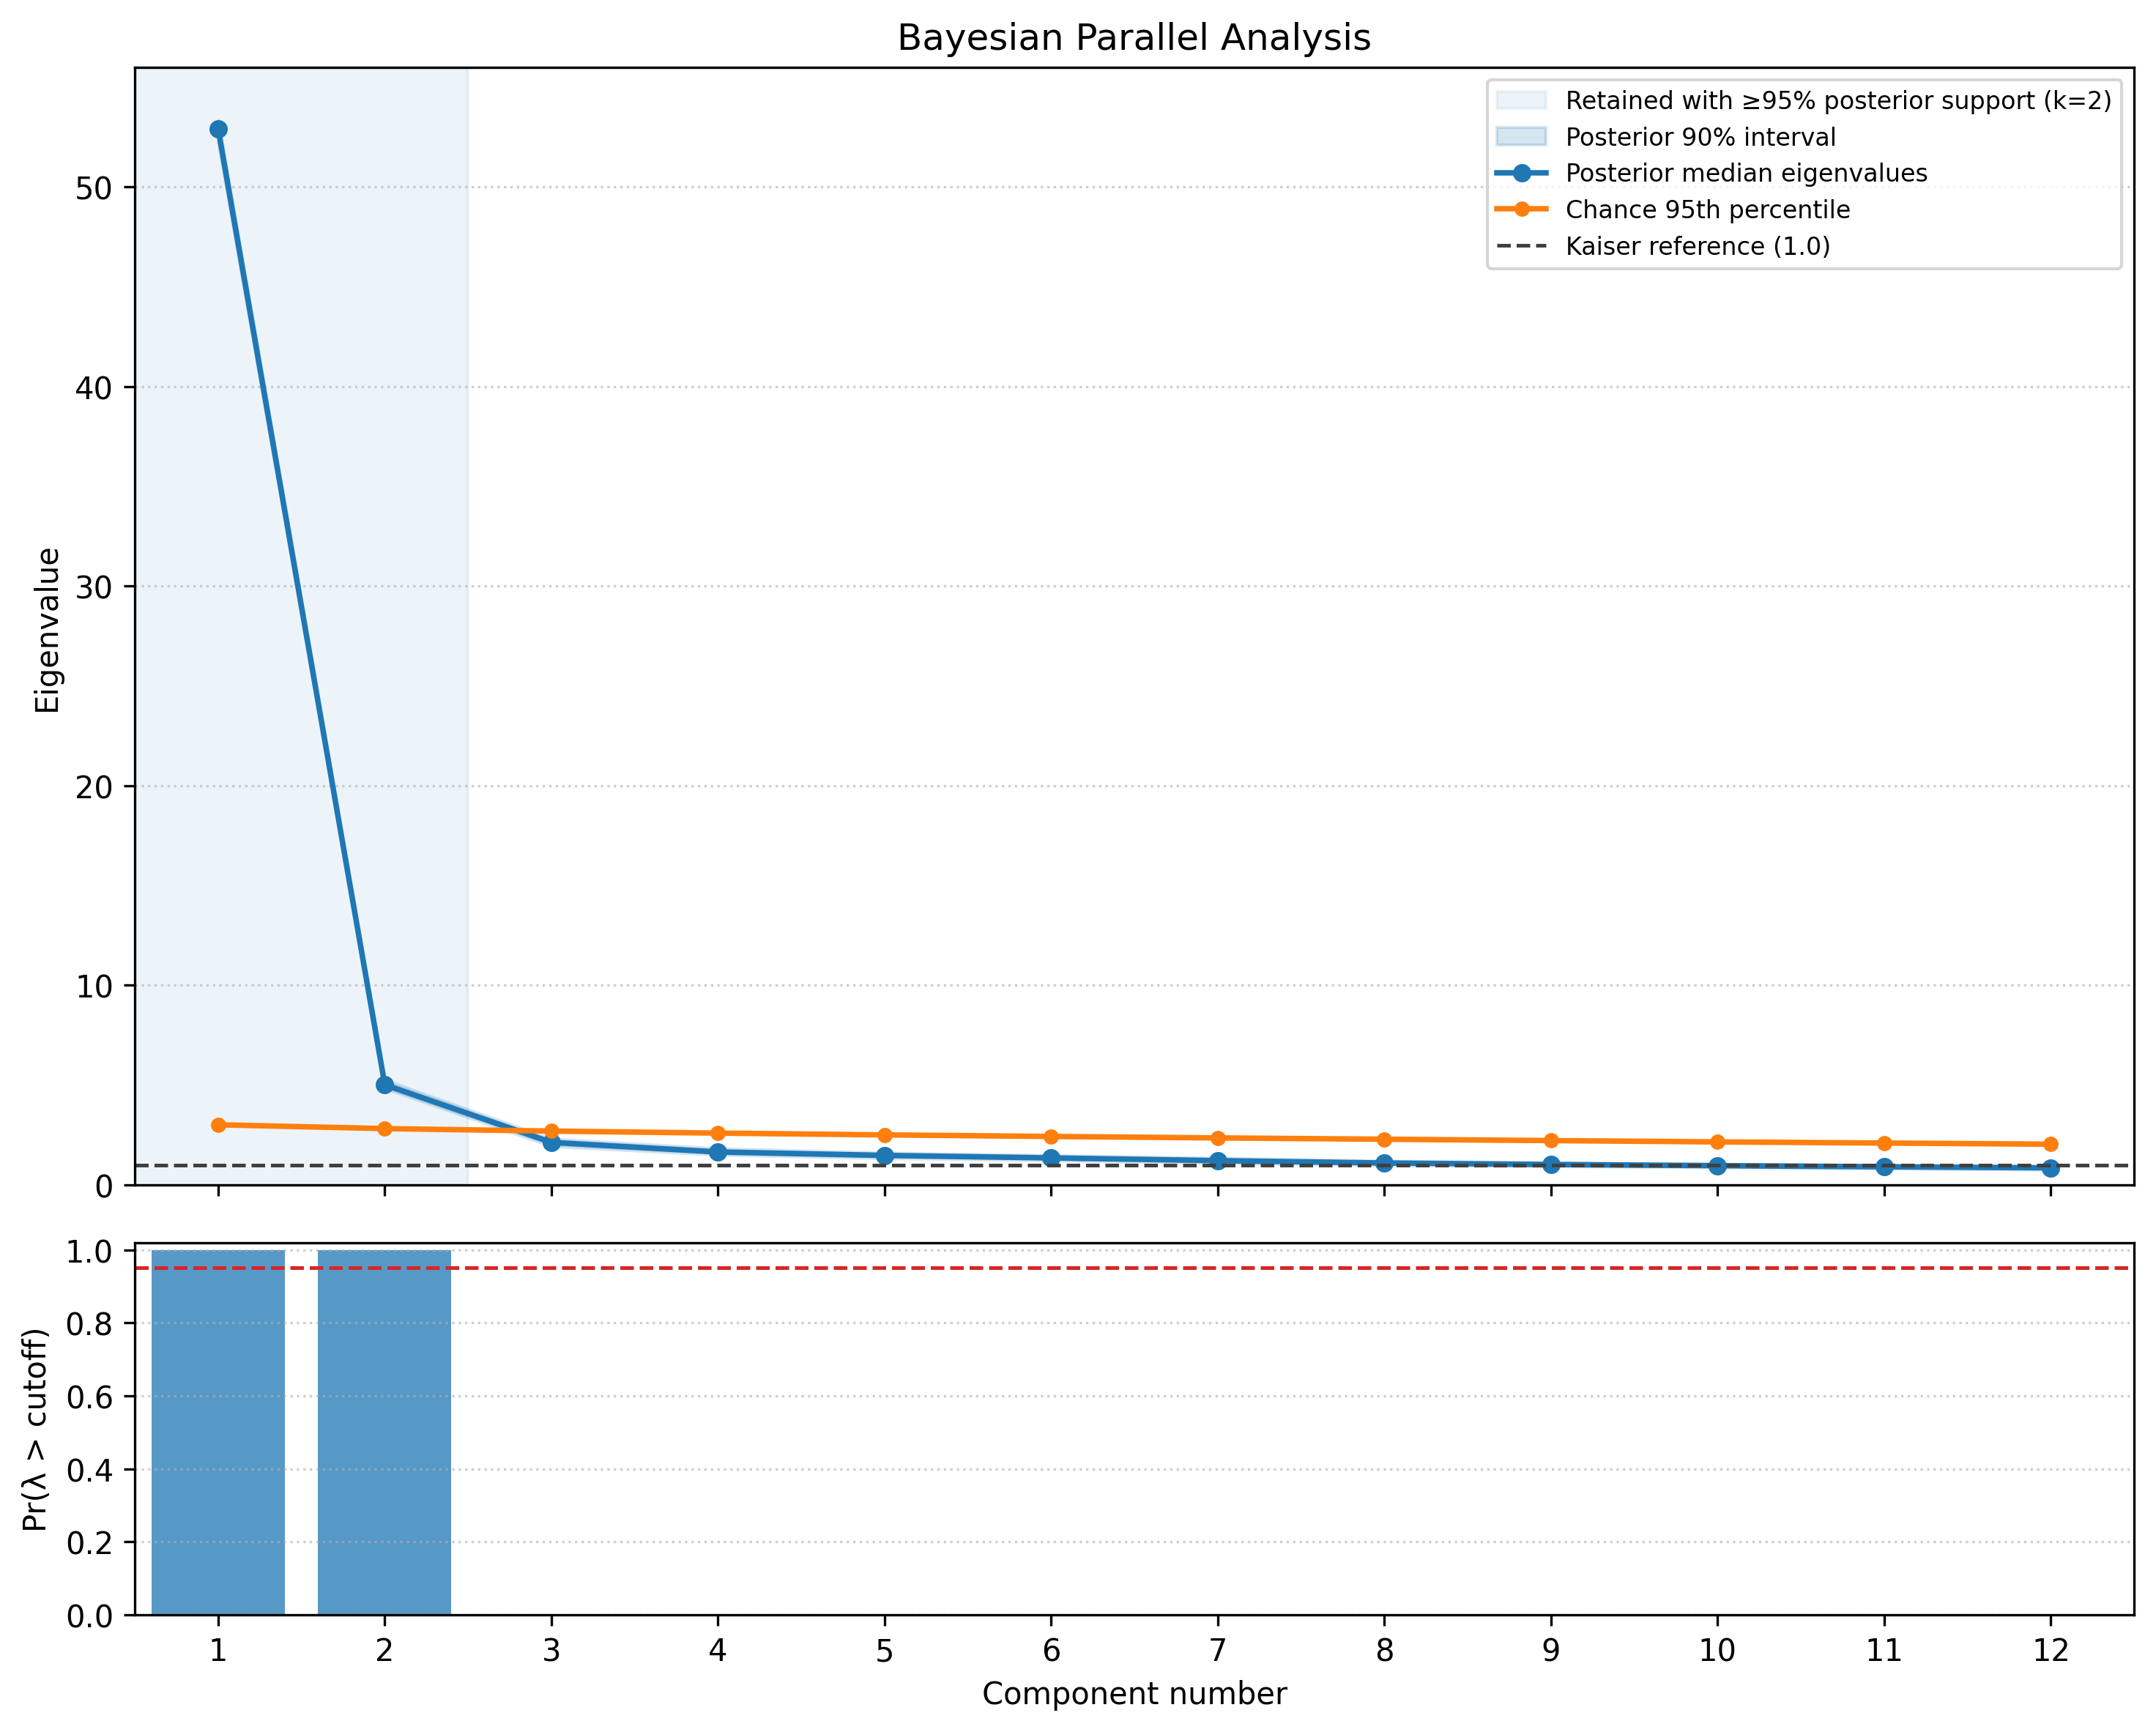
Typos7 factors
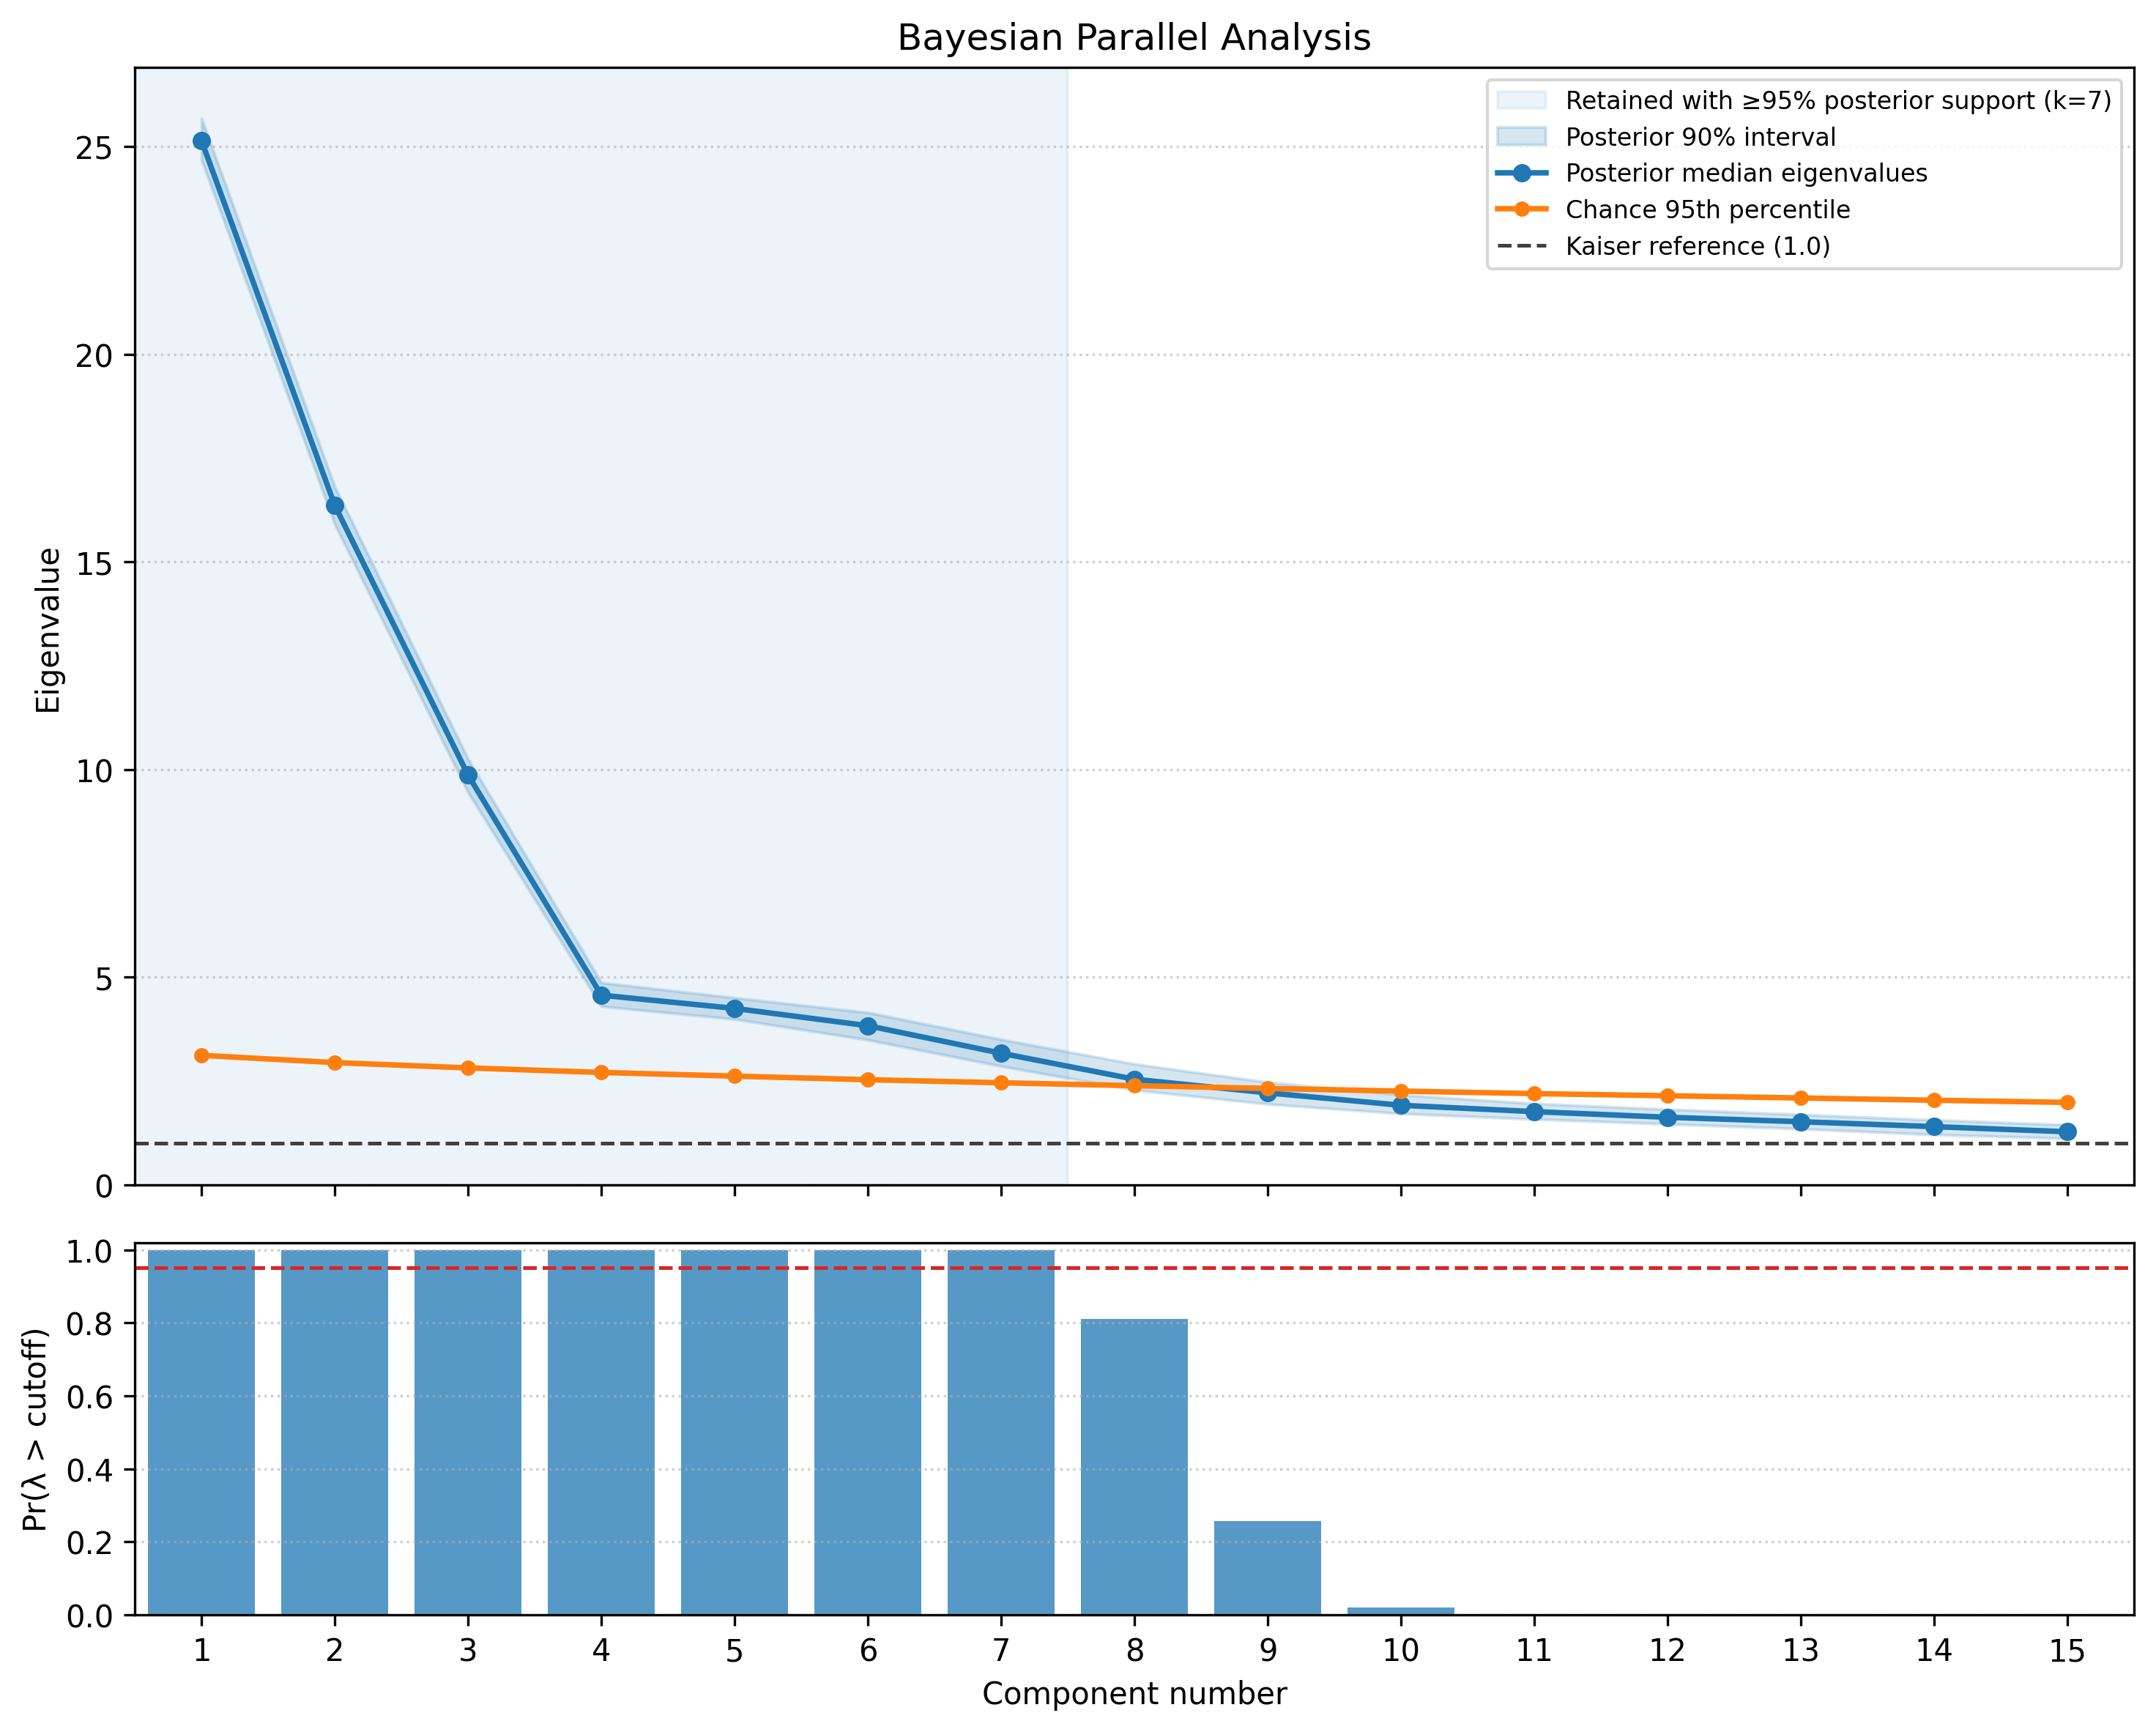
Paraphrase2 factors
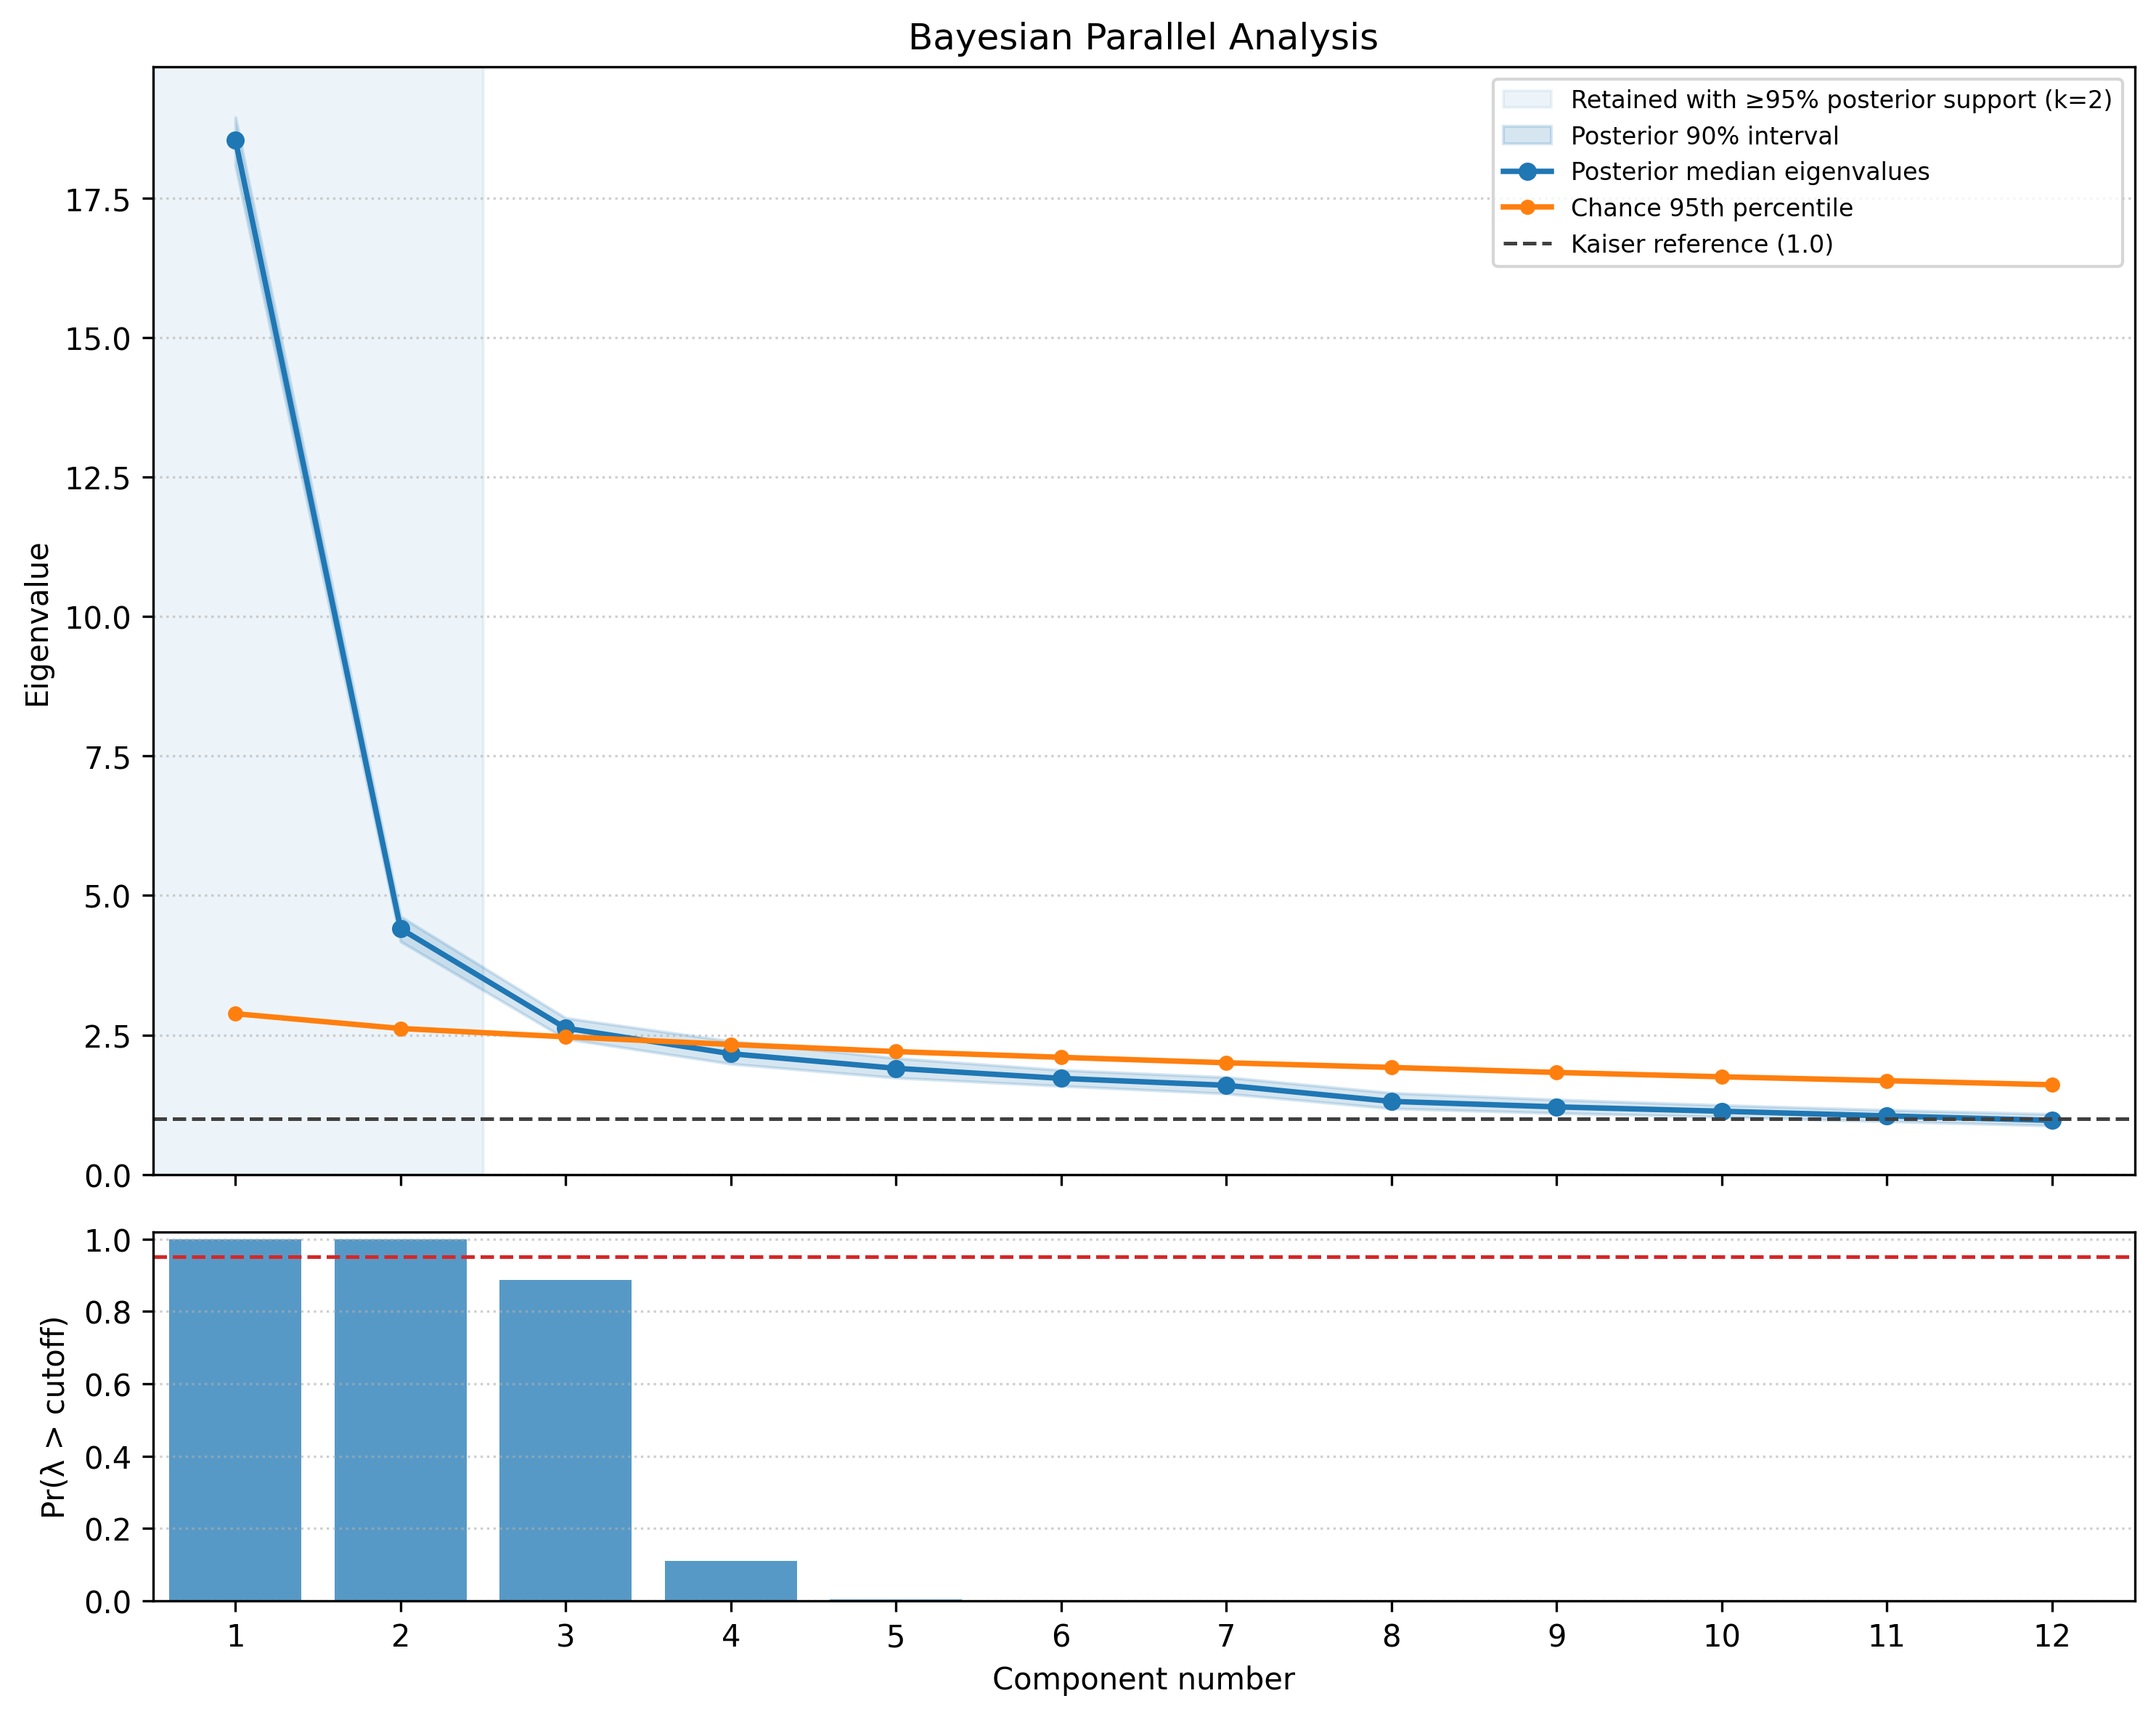
Story Generation2 factors
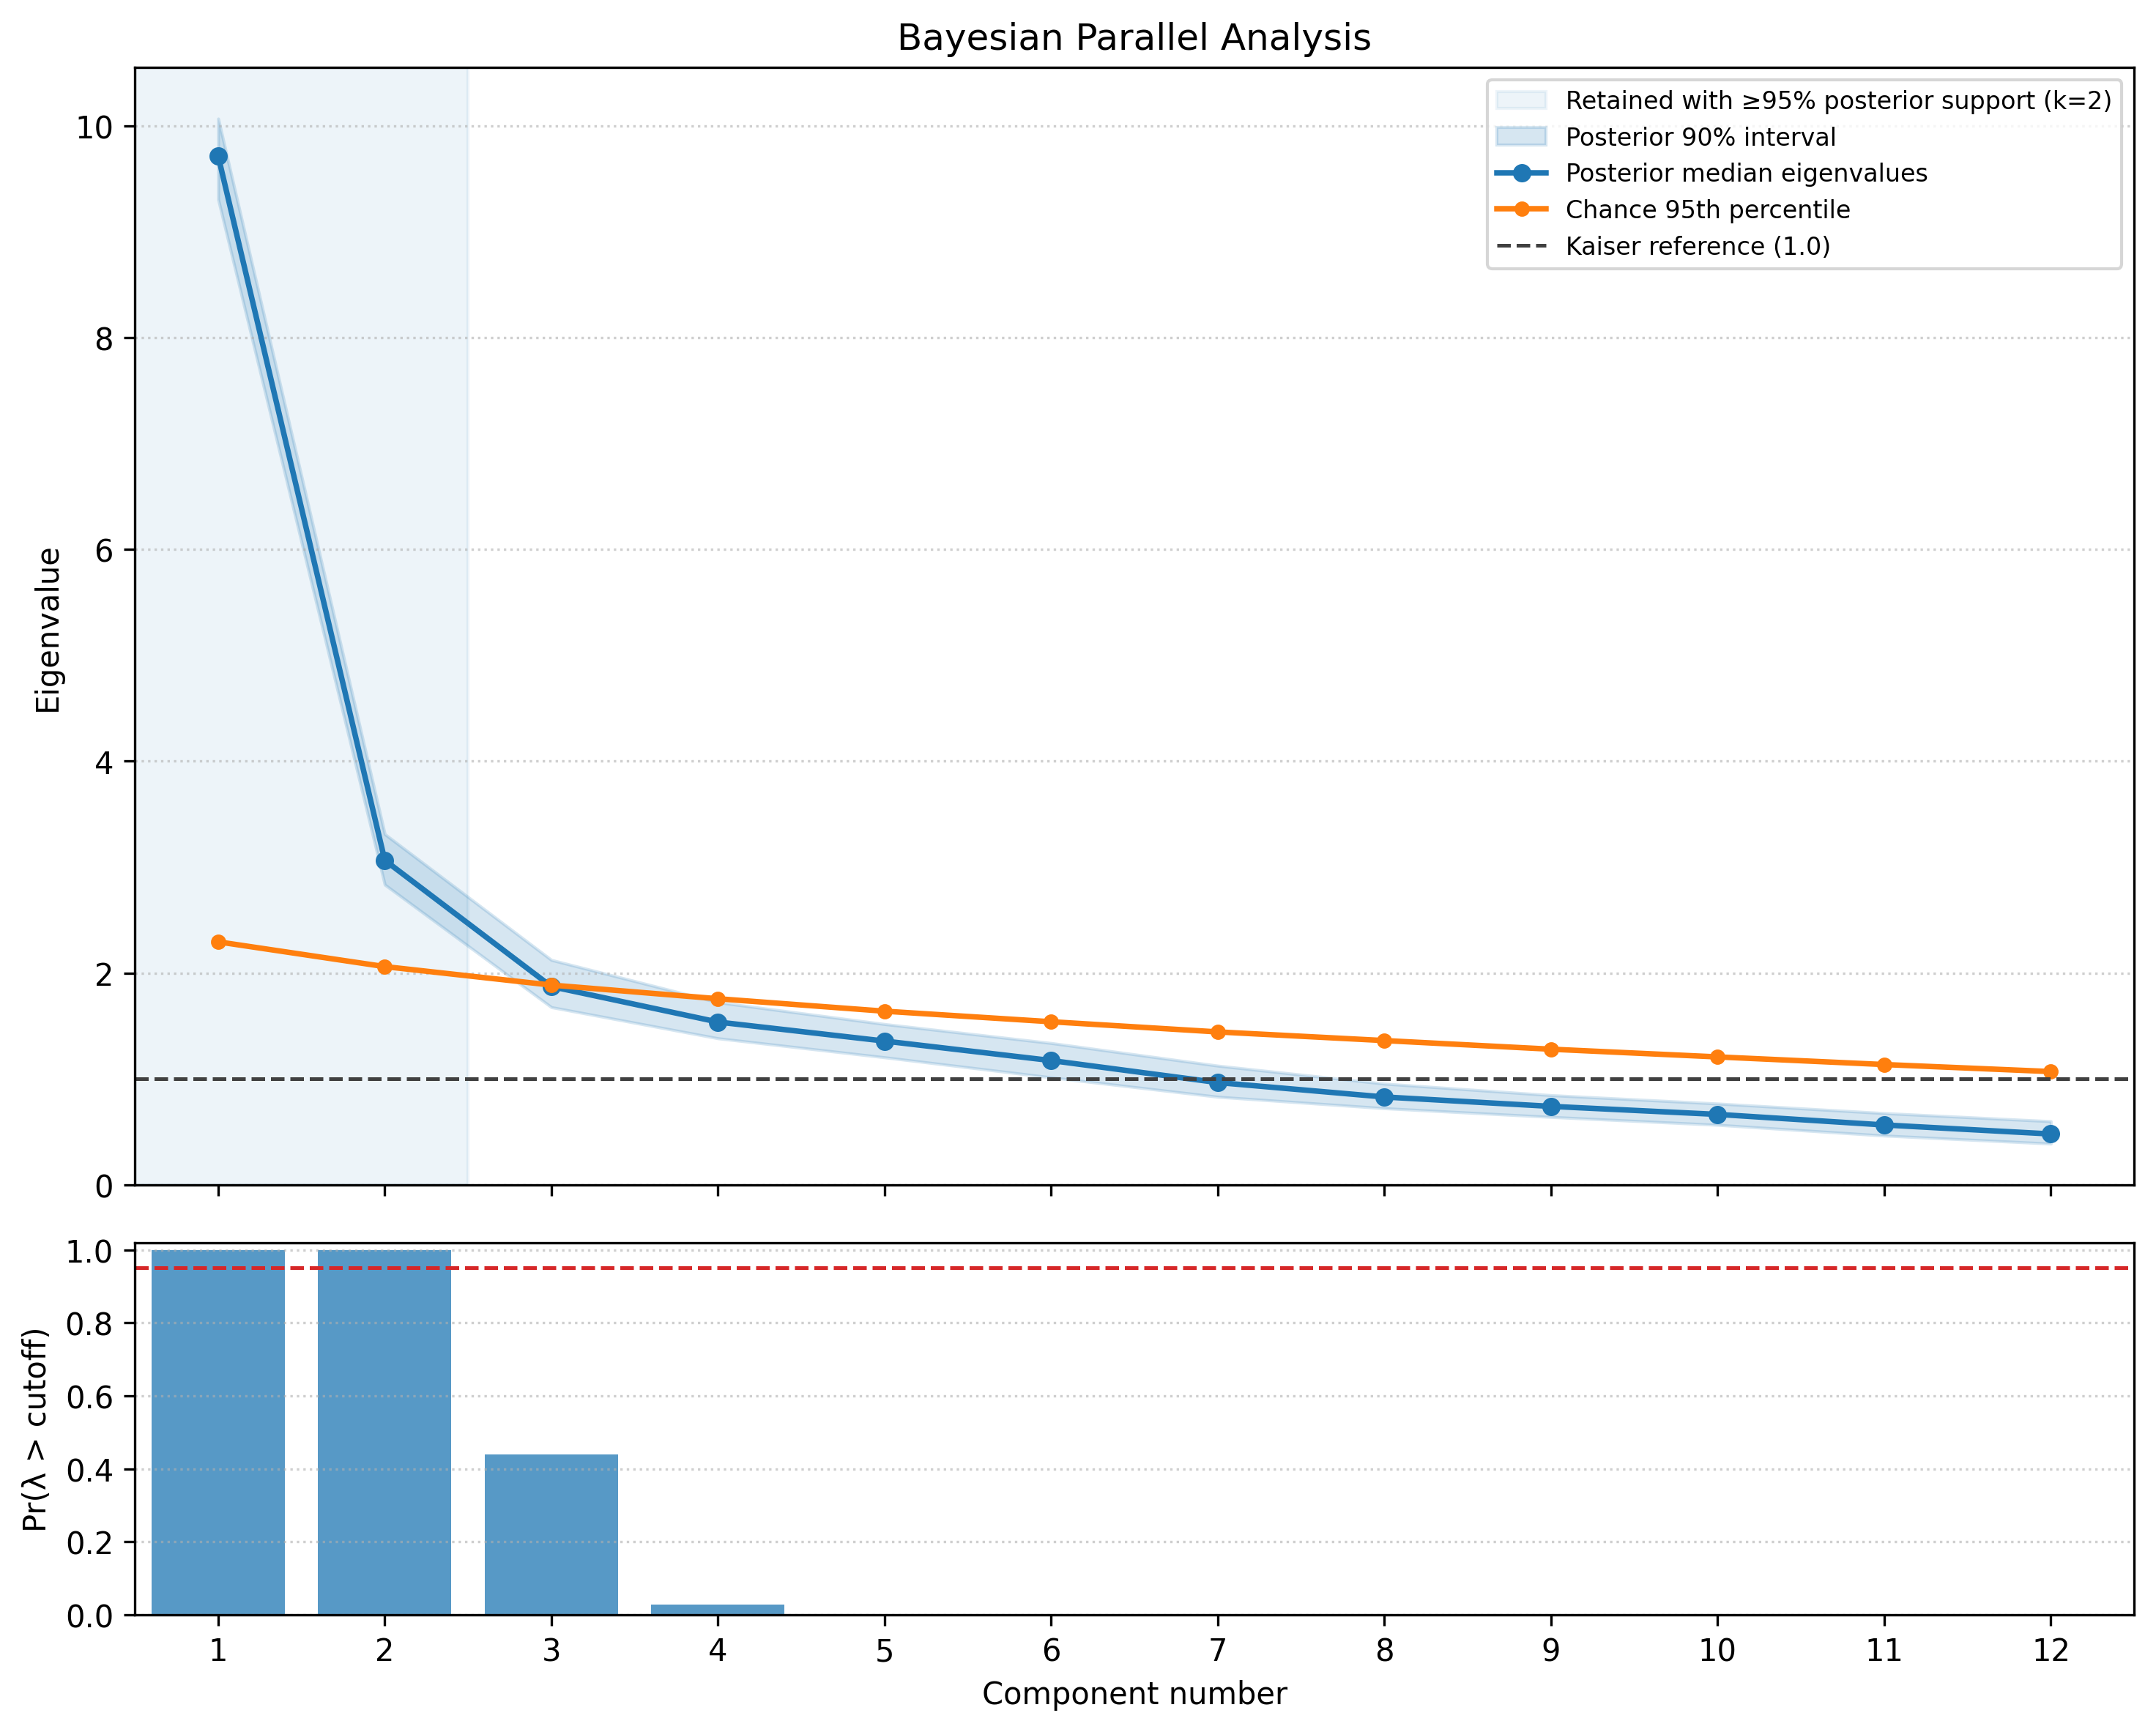
Although the Bayesian parallel analyses support more than one factor for every task, the first dimension dominates in six of them. The ratio of the first two (posterior-median) eigenvalues ranges from 3.1 to 10.6 for those tasks, compared with just 1.5 for Typos. The within-task item-correlation matrices offer another way to see this:
Items are ordered by median task-factor loading. Grey means unavailable, not zero. Scroll to compare tasks; select a matrix for full size.
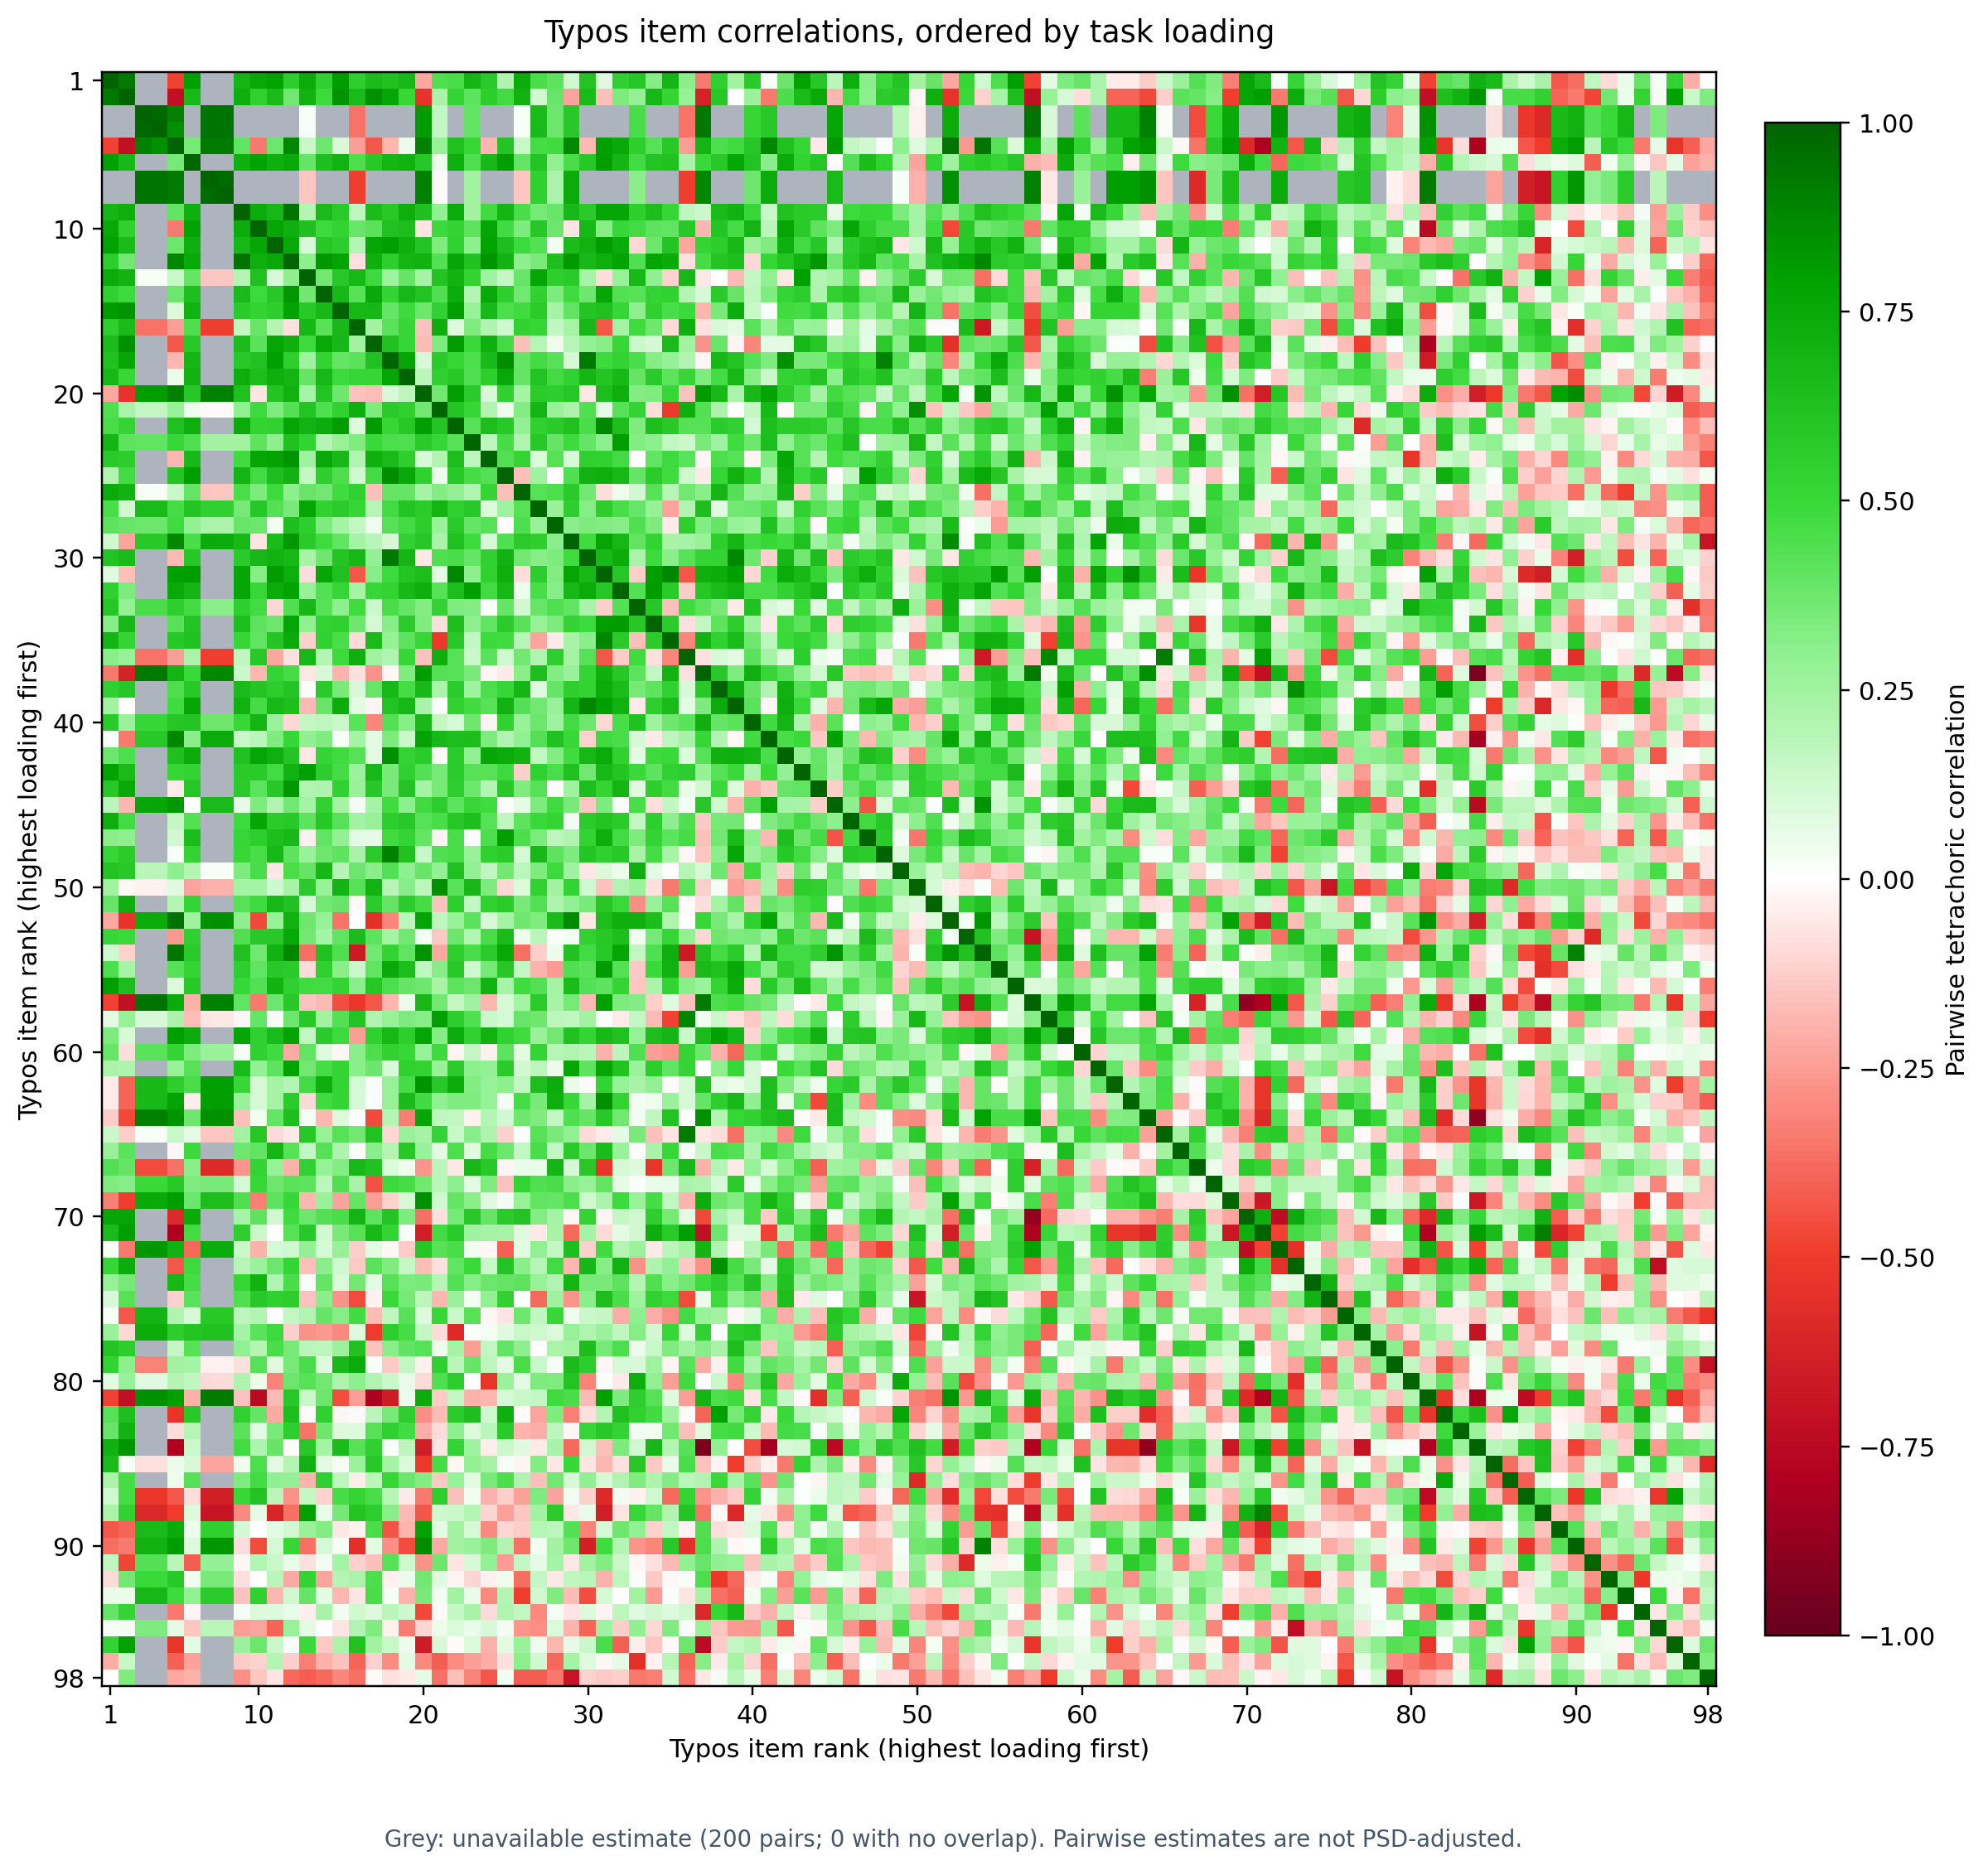
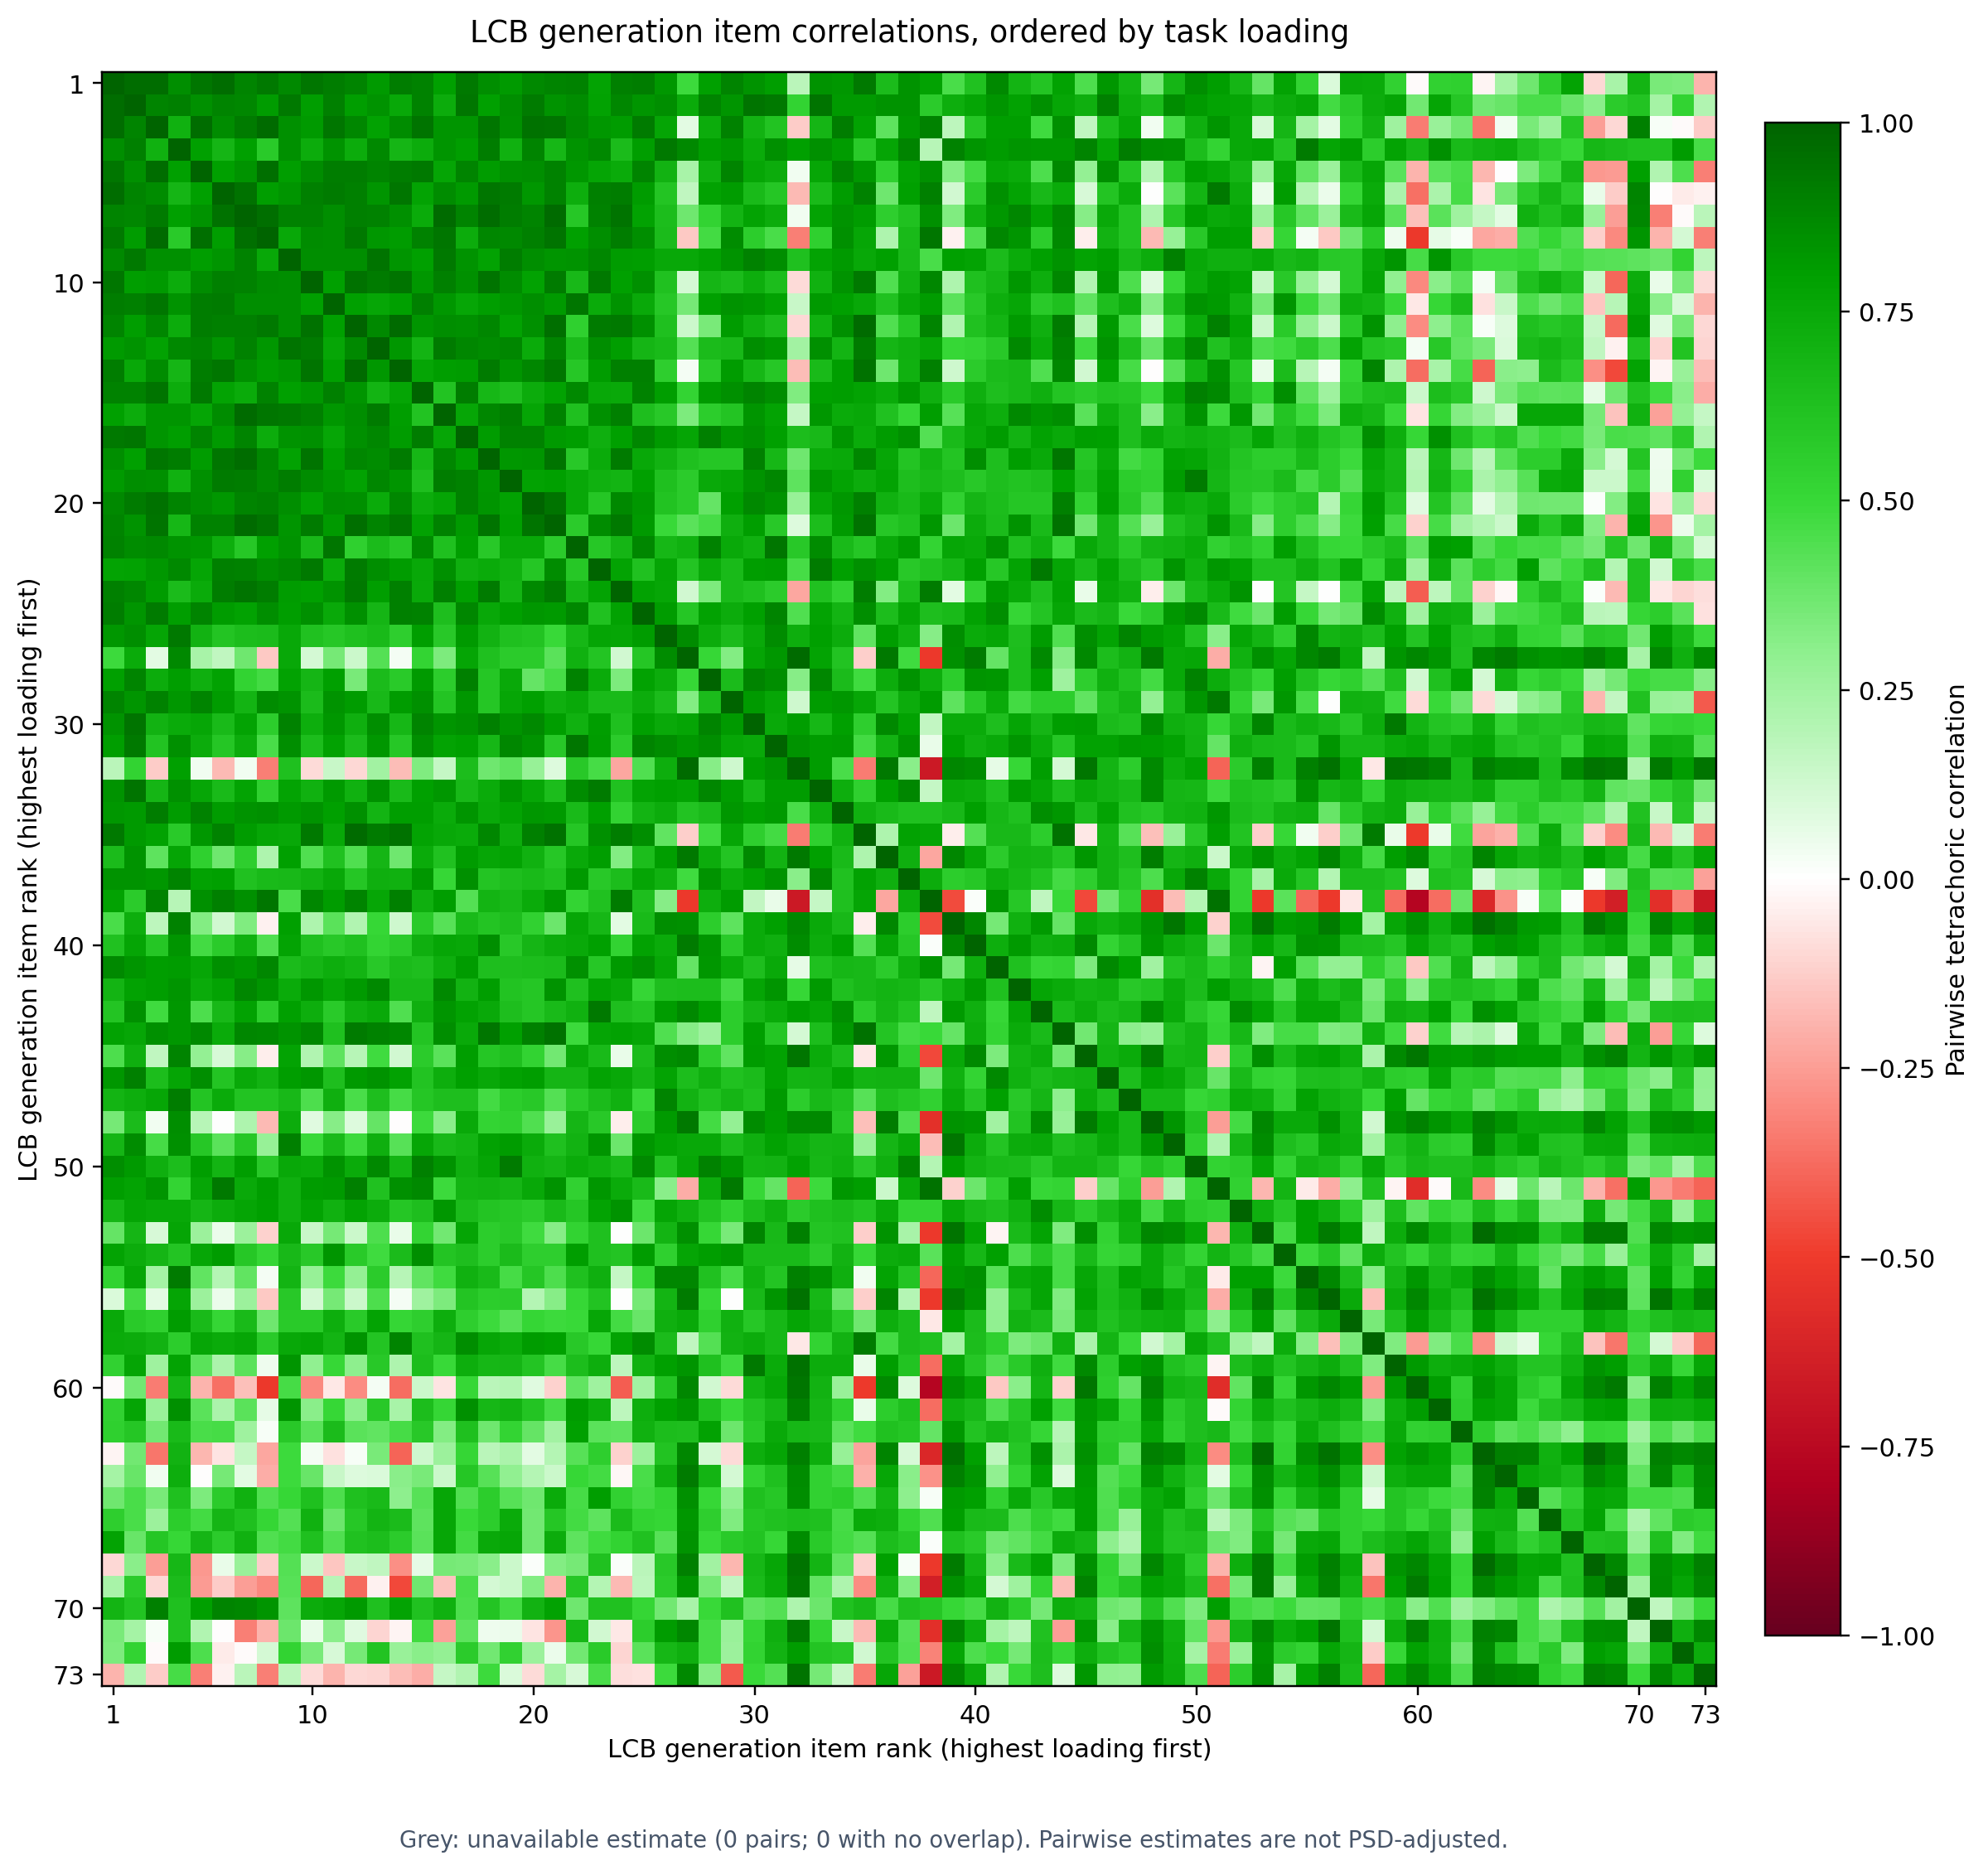
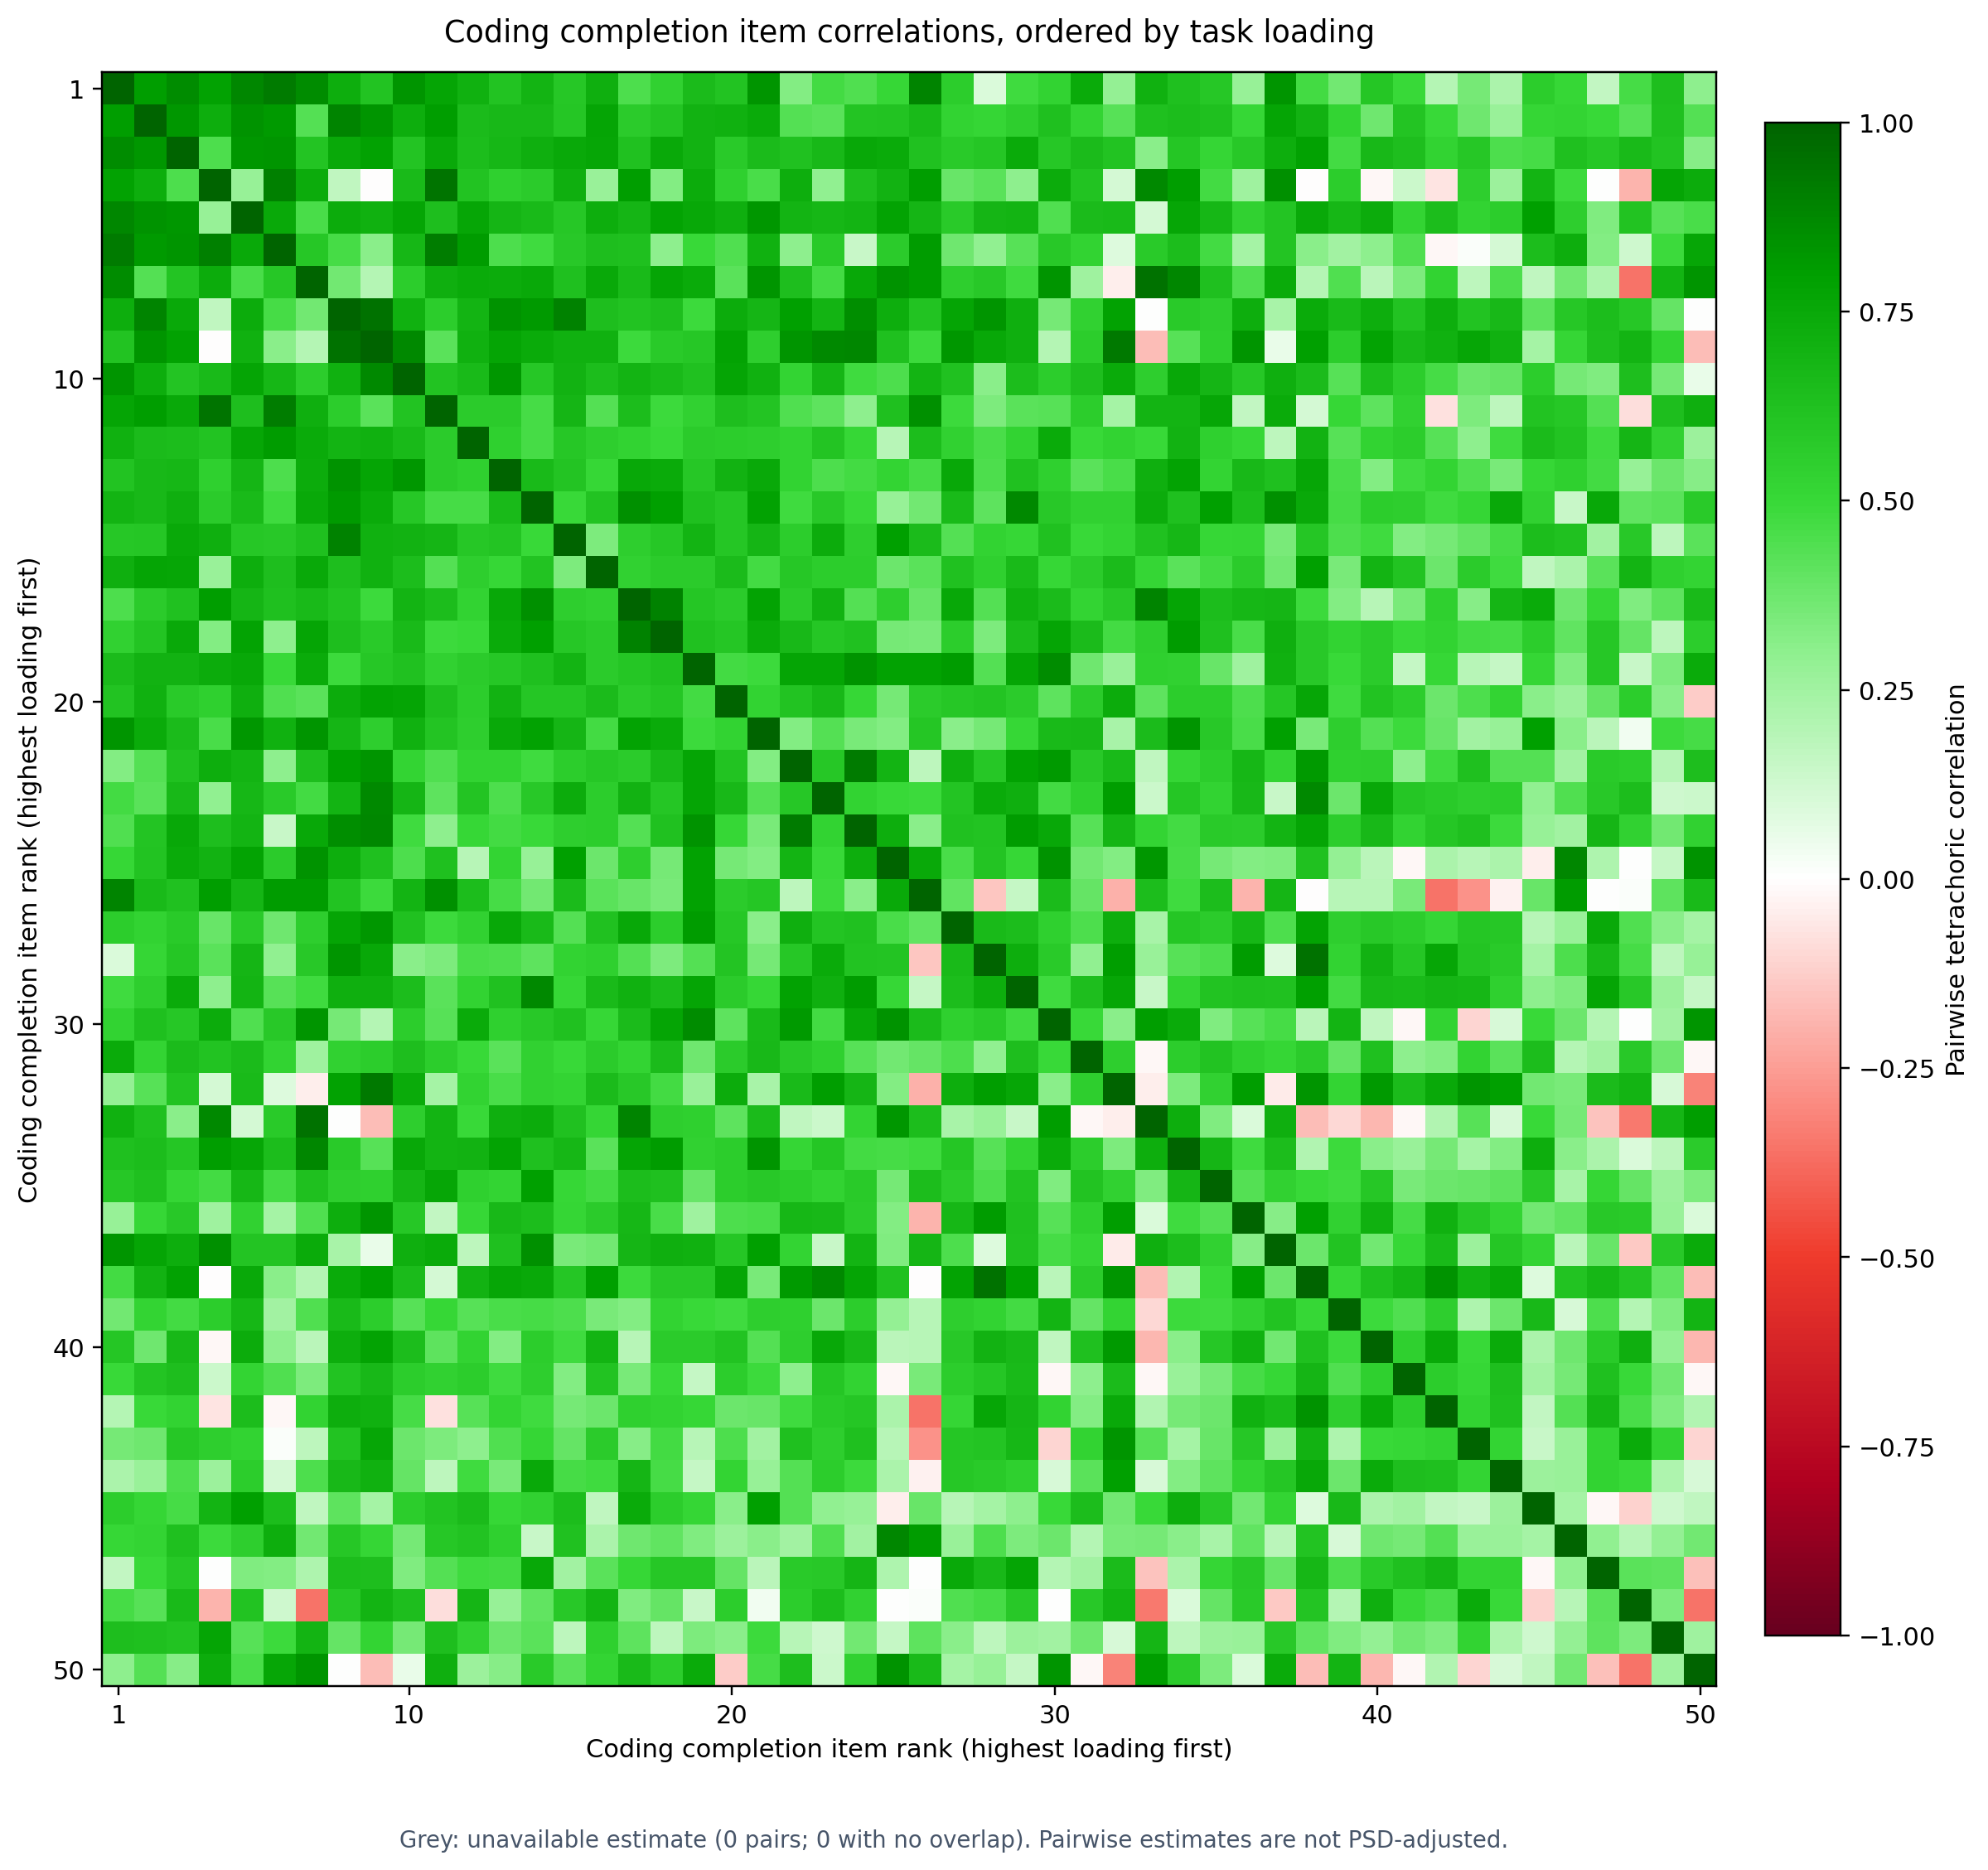
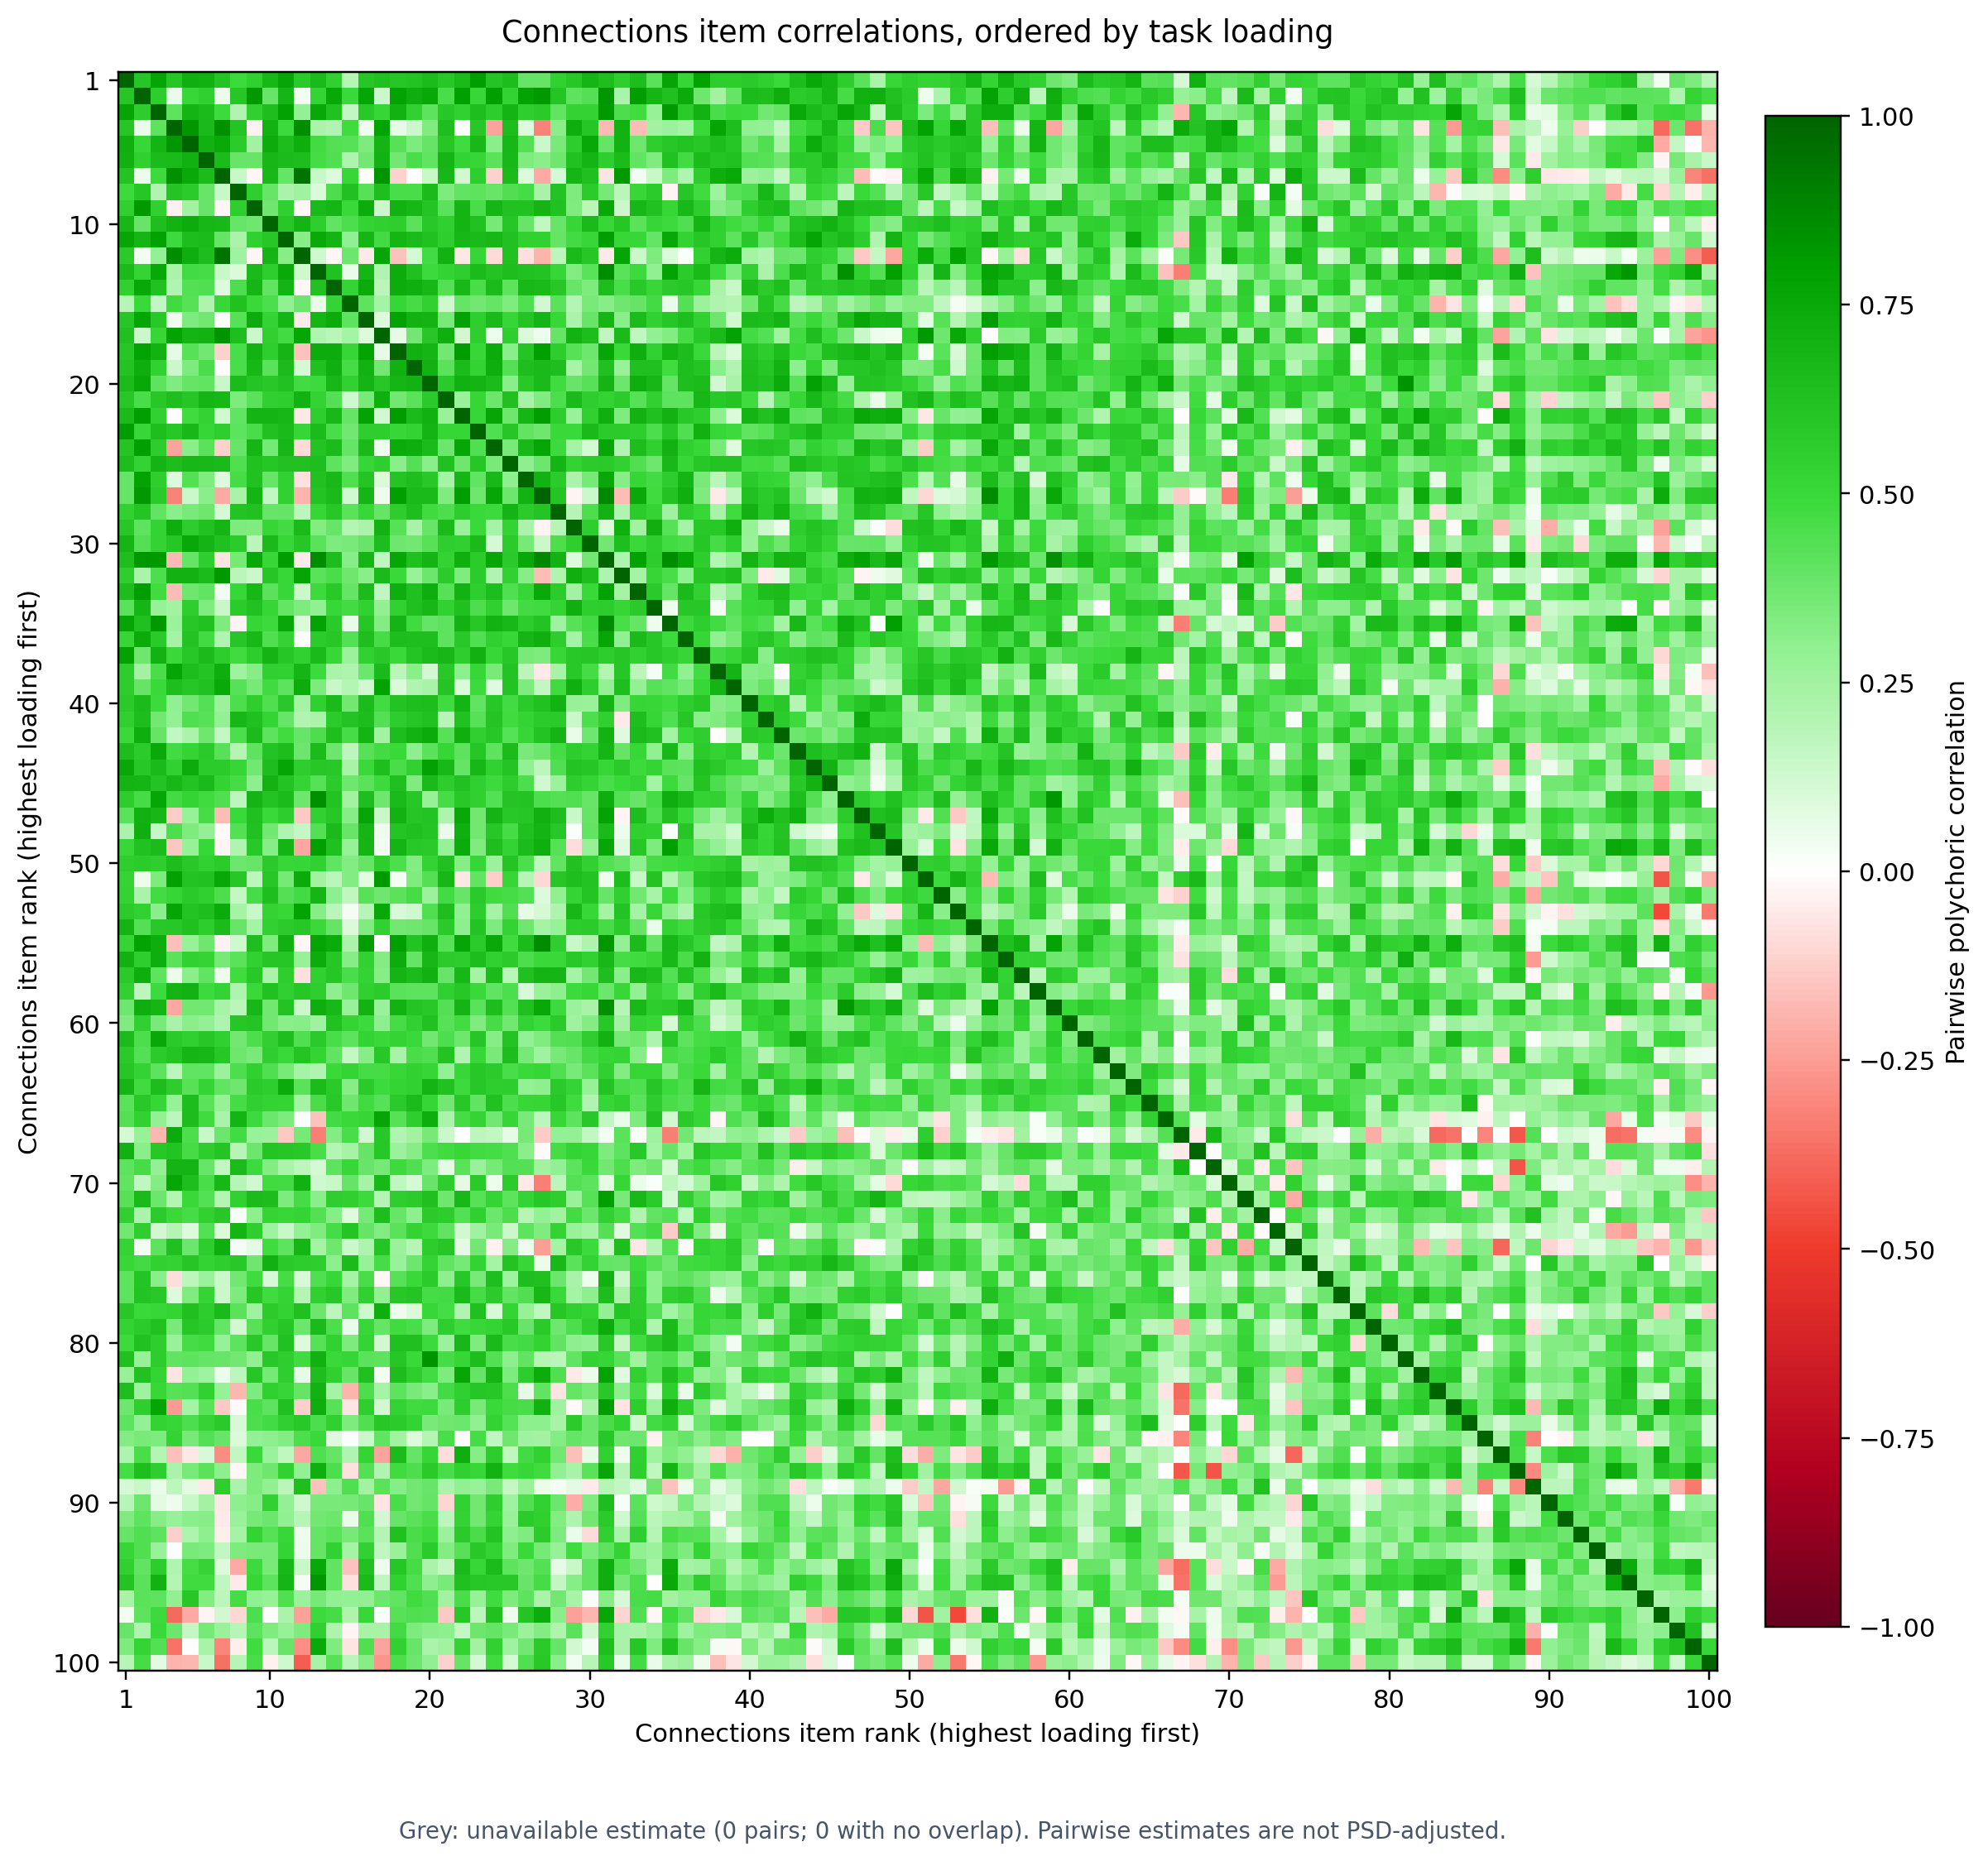
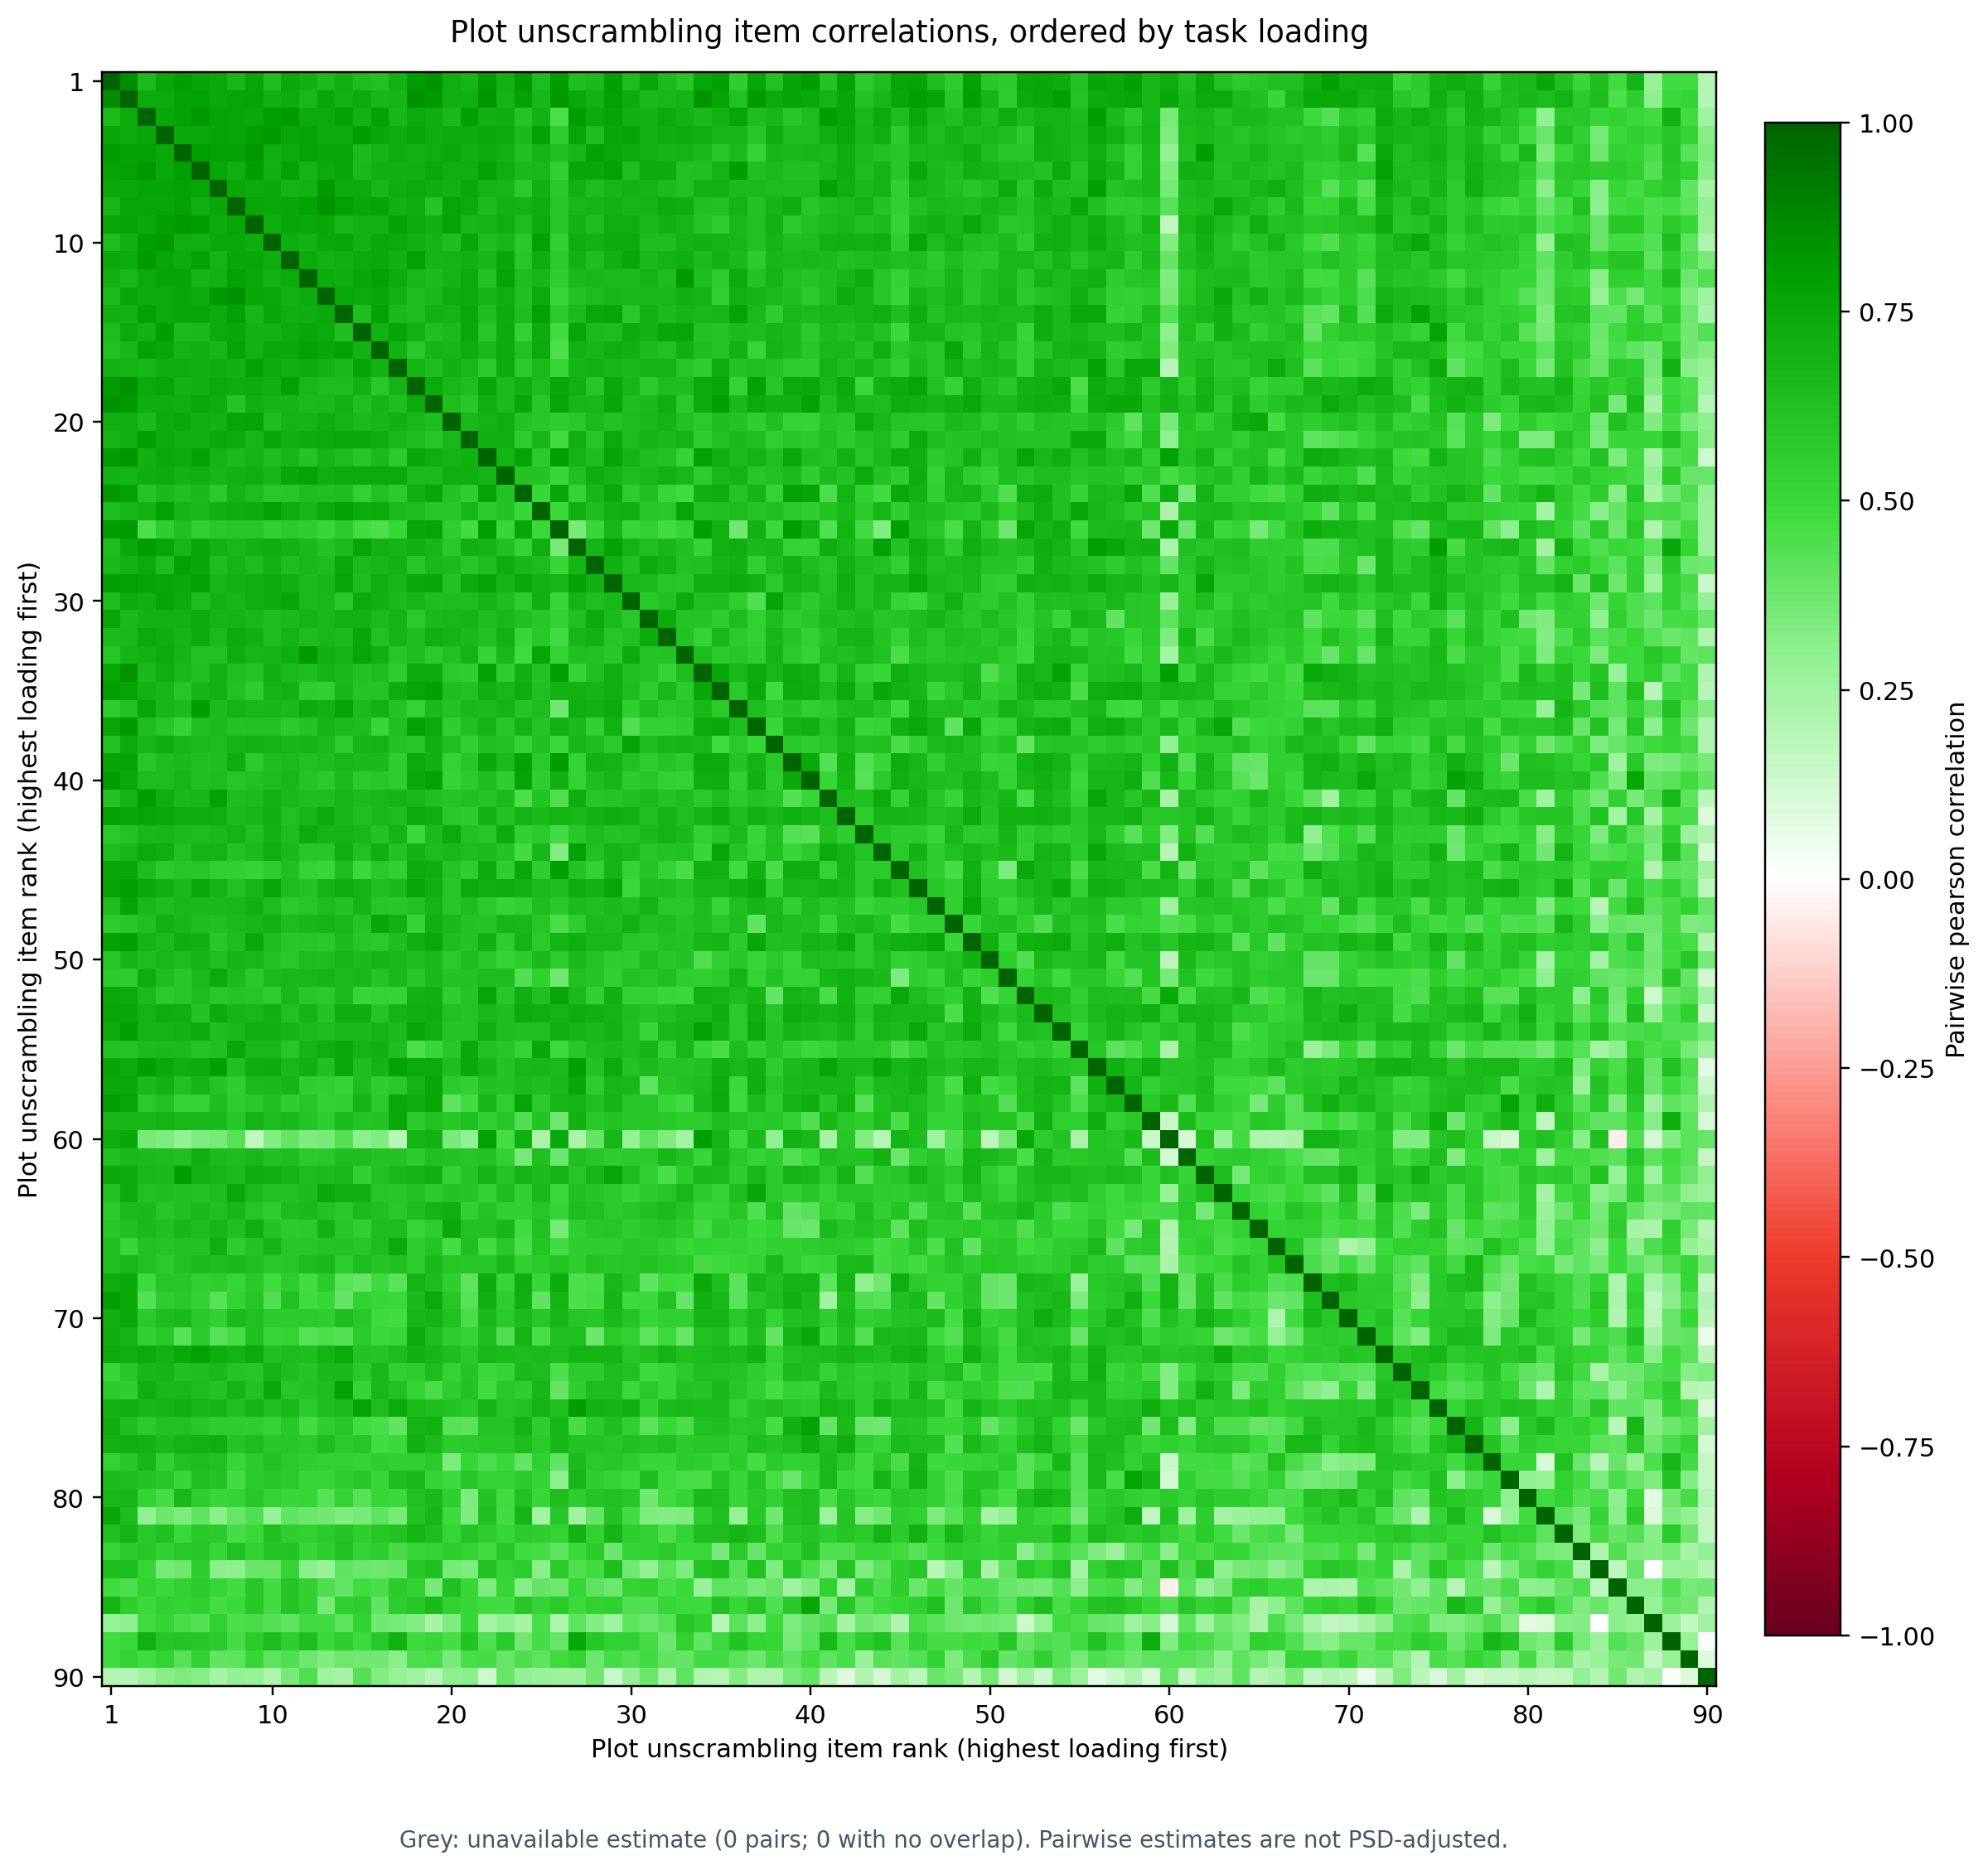
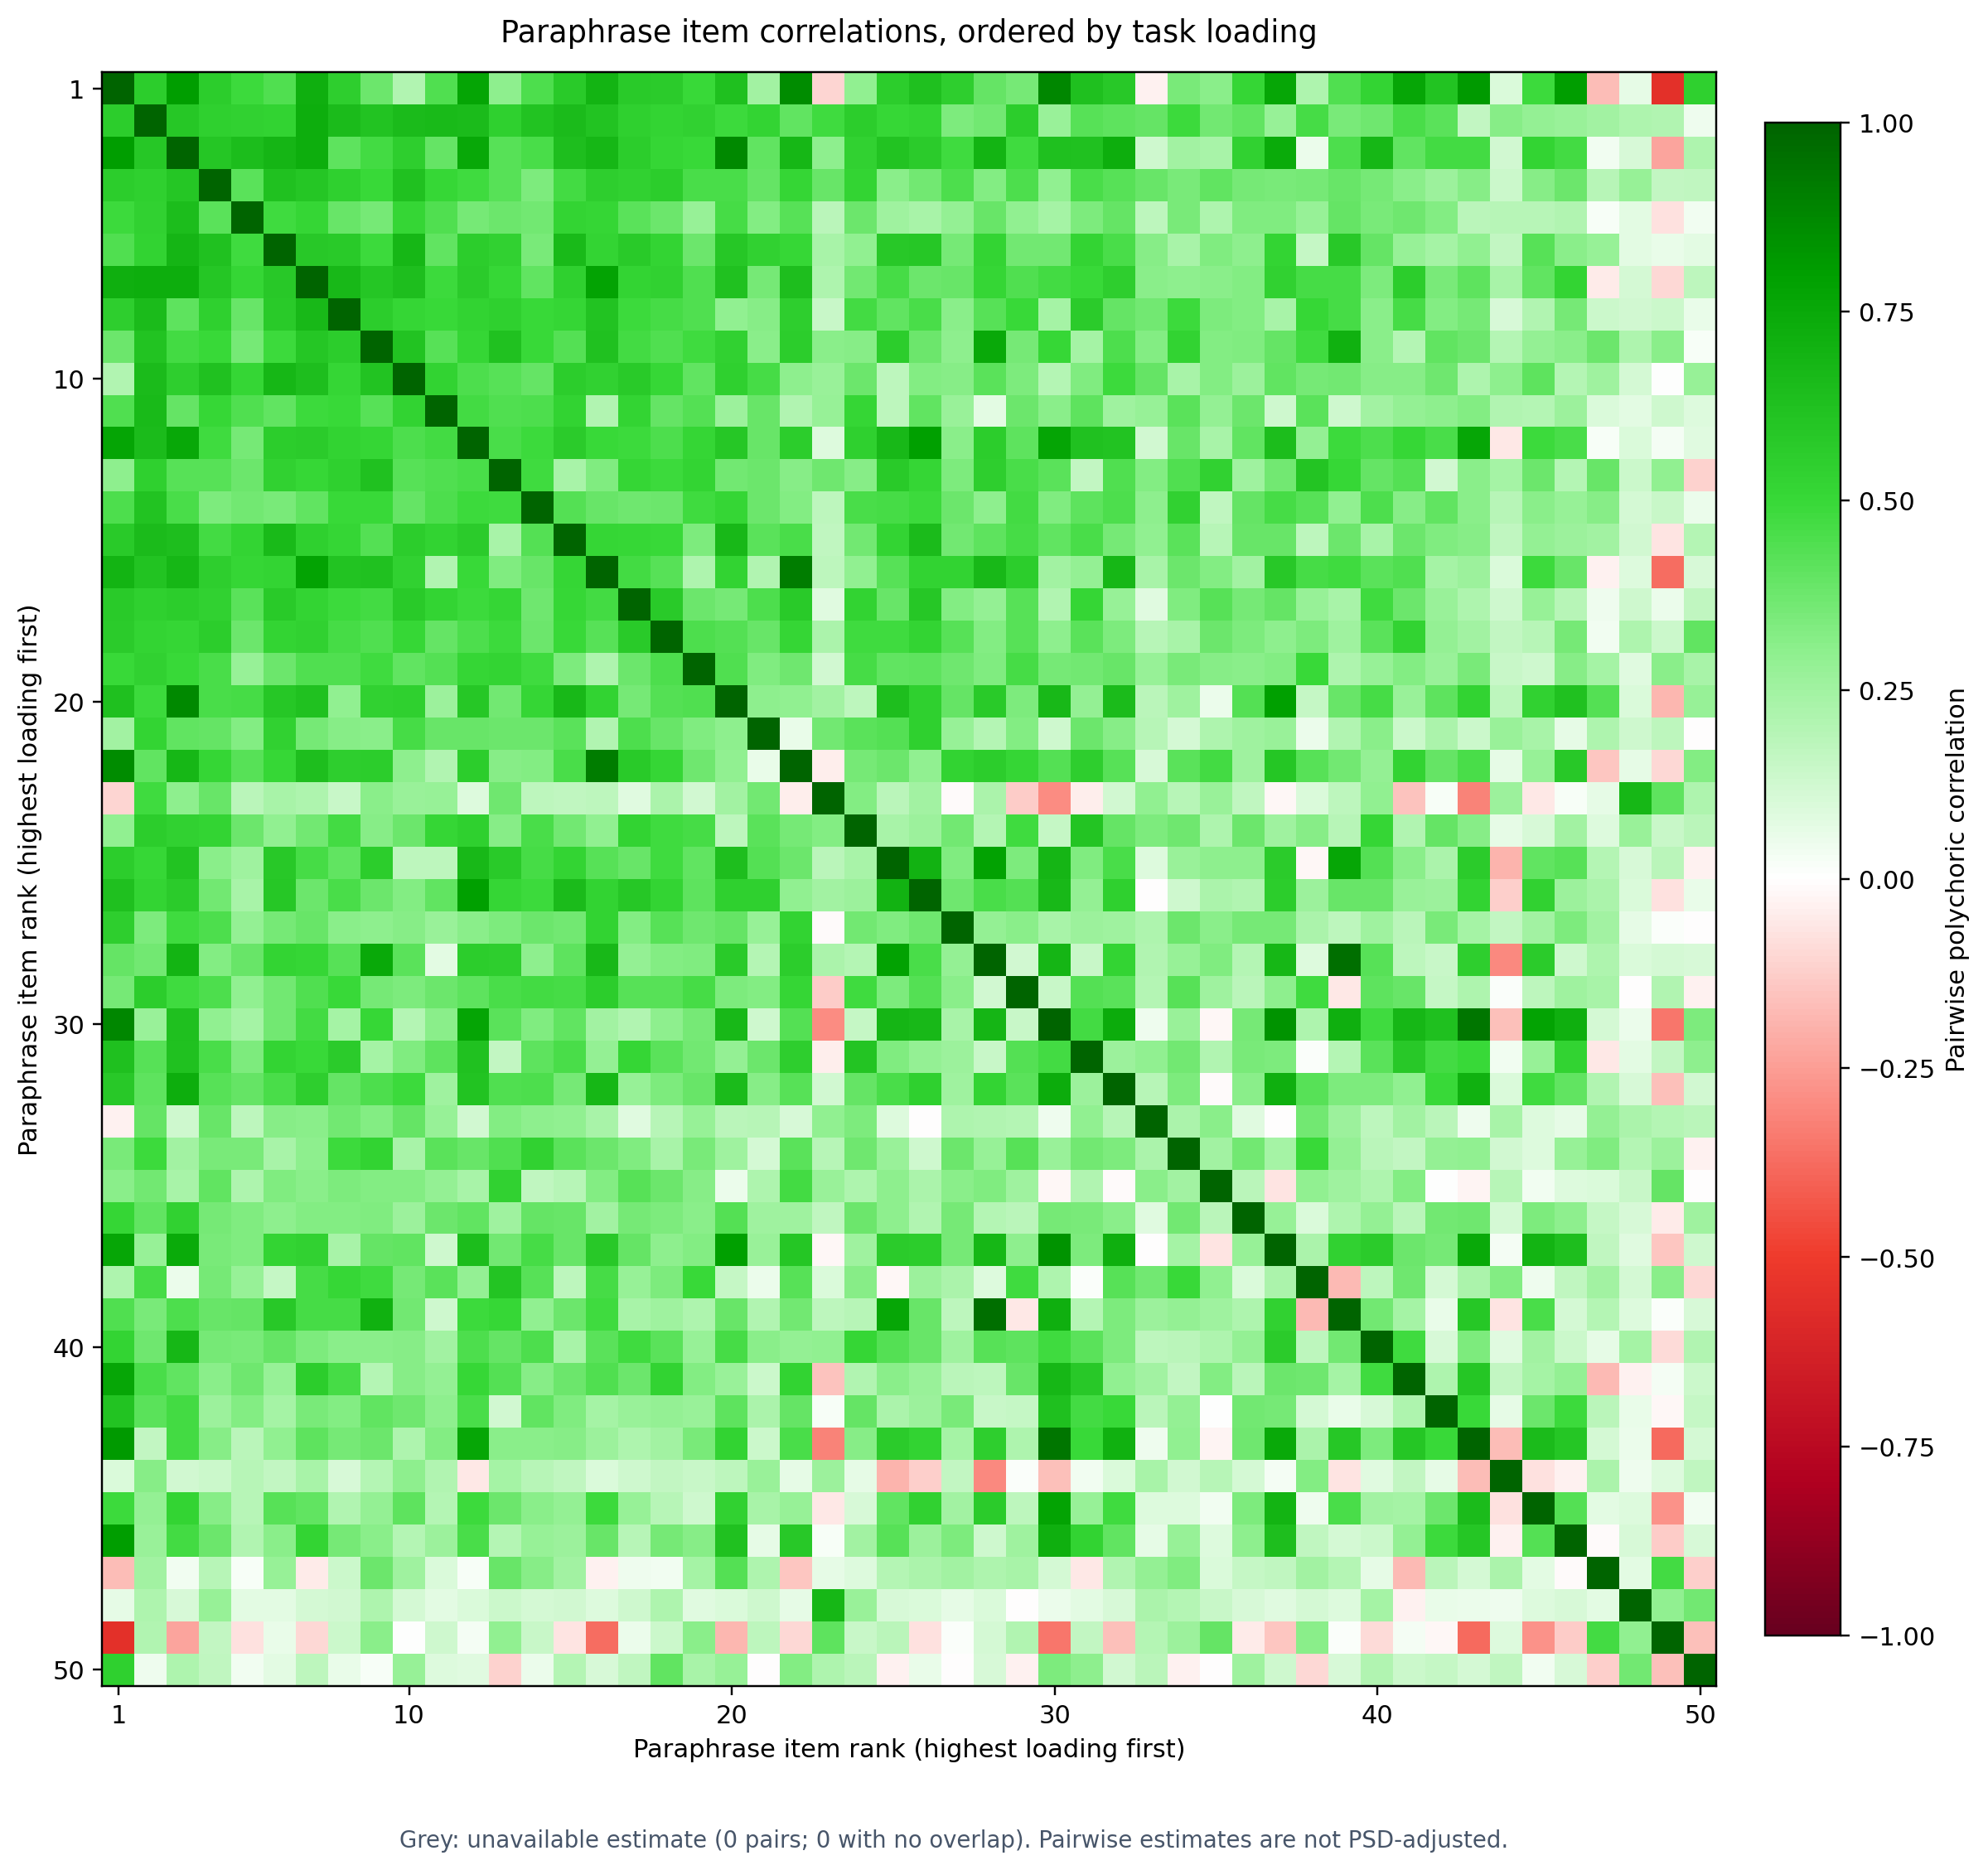
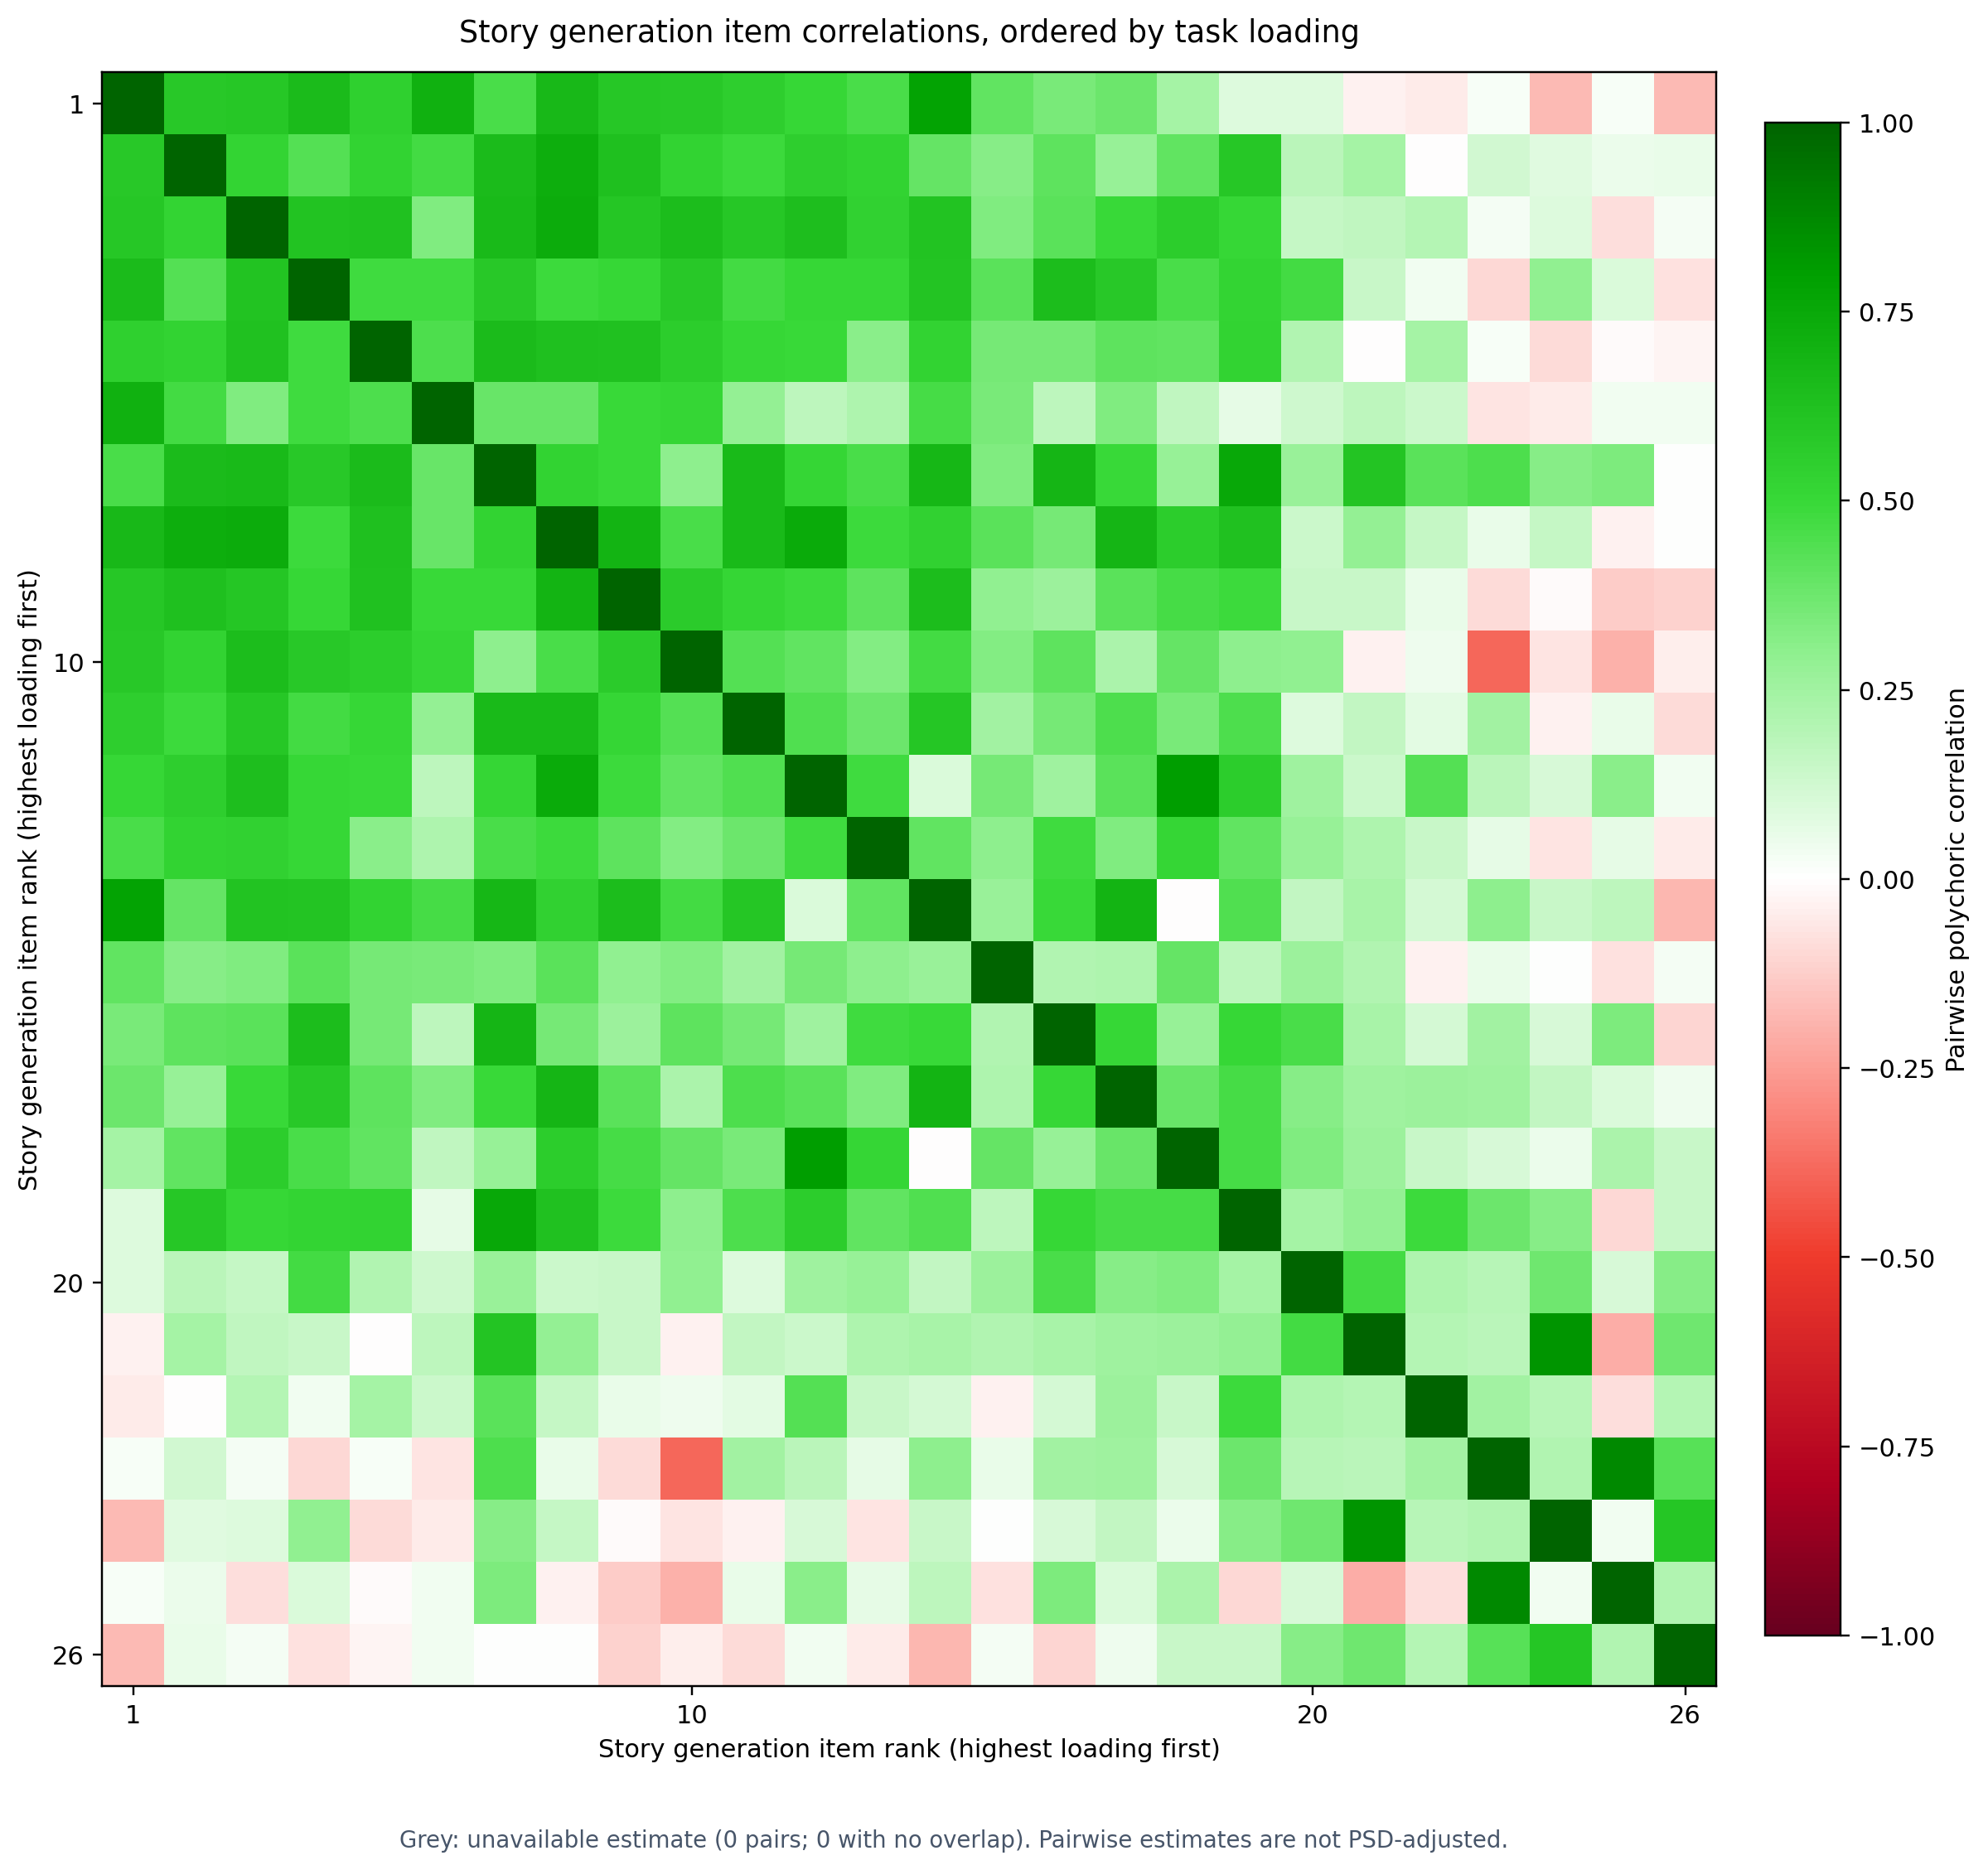
Most of the matrices suggest a clear positive manifold. Typos is the exception: it still looks quite ugly after the items are sorted by loading. That makes me want to check whether the Typos items themselves are sound. Auditing every item would take too long, but CTT/IRT measures can flag suspicious ones for us to focus on…
Item Flags
In my post about flagging suspicious questions in AI benchmarks, I discussed flags based on item discrimination and distractor behavior. None of the items here is multiple choice, so there are no distractors to examine. That leaves item discrimination, which I measure using the corrected item–task score correlation: the correlation between an item and its task score calculated without that item.
Red: below 0 · Yellow: 0–0.2 · Green: above 0.2 · Grey: undefined. Choose a task, then select its histogram for full size.
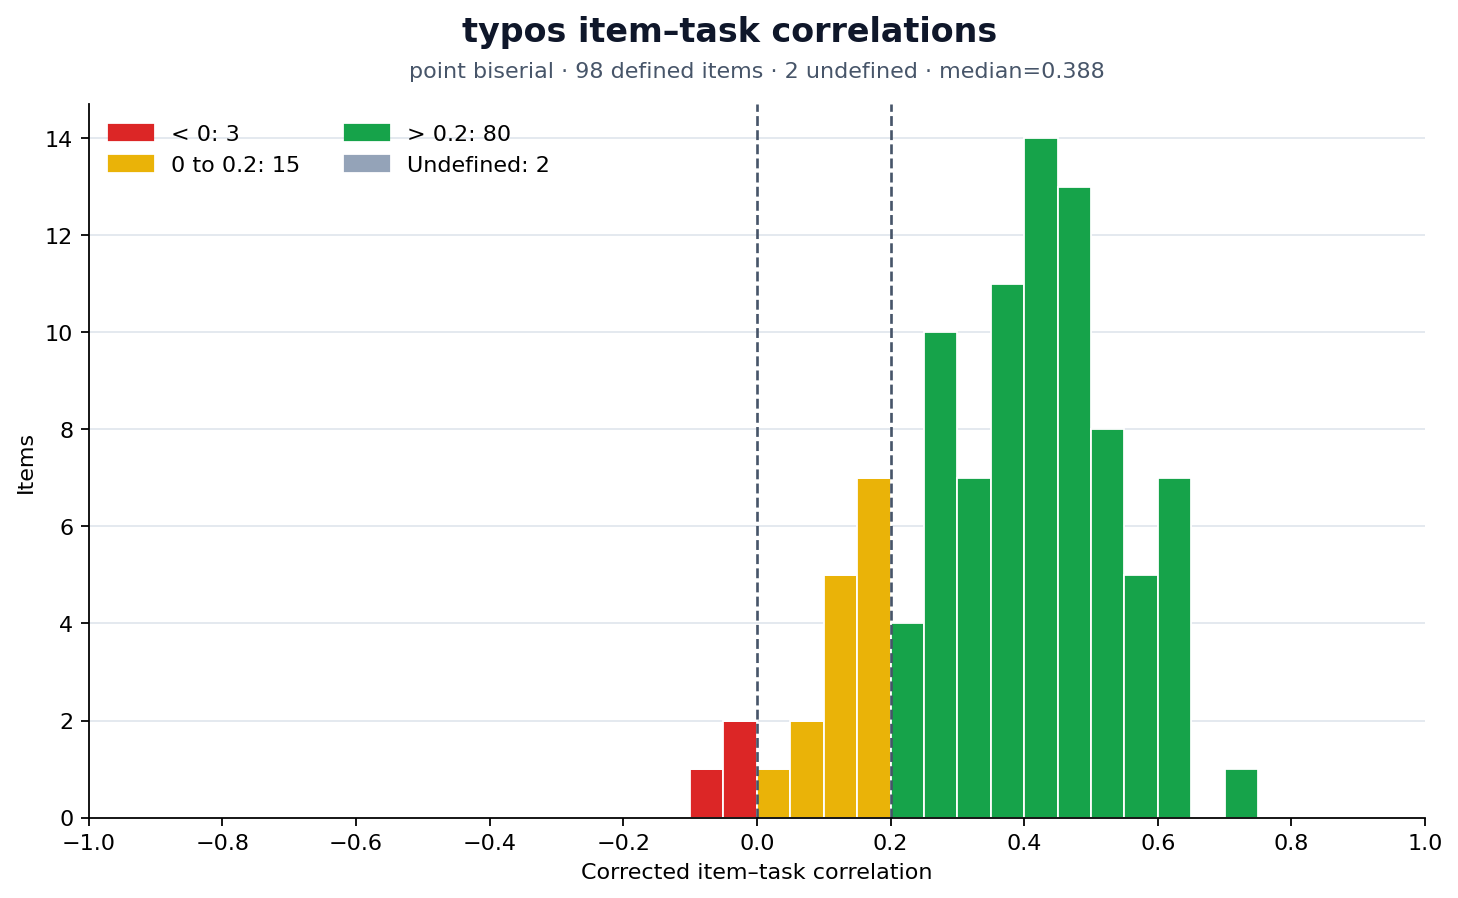
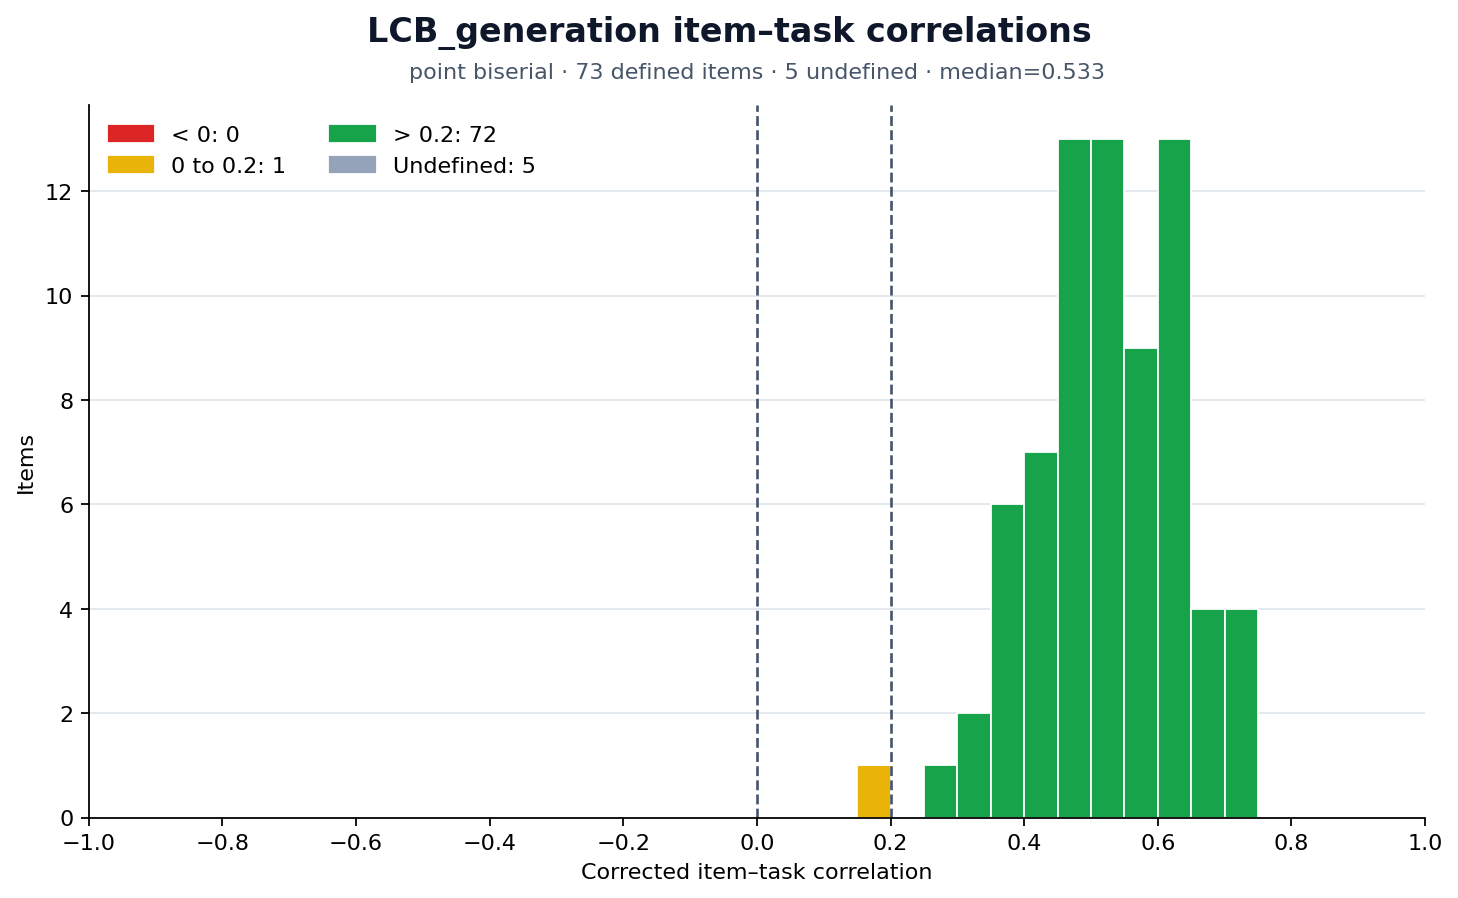
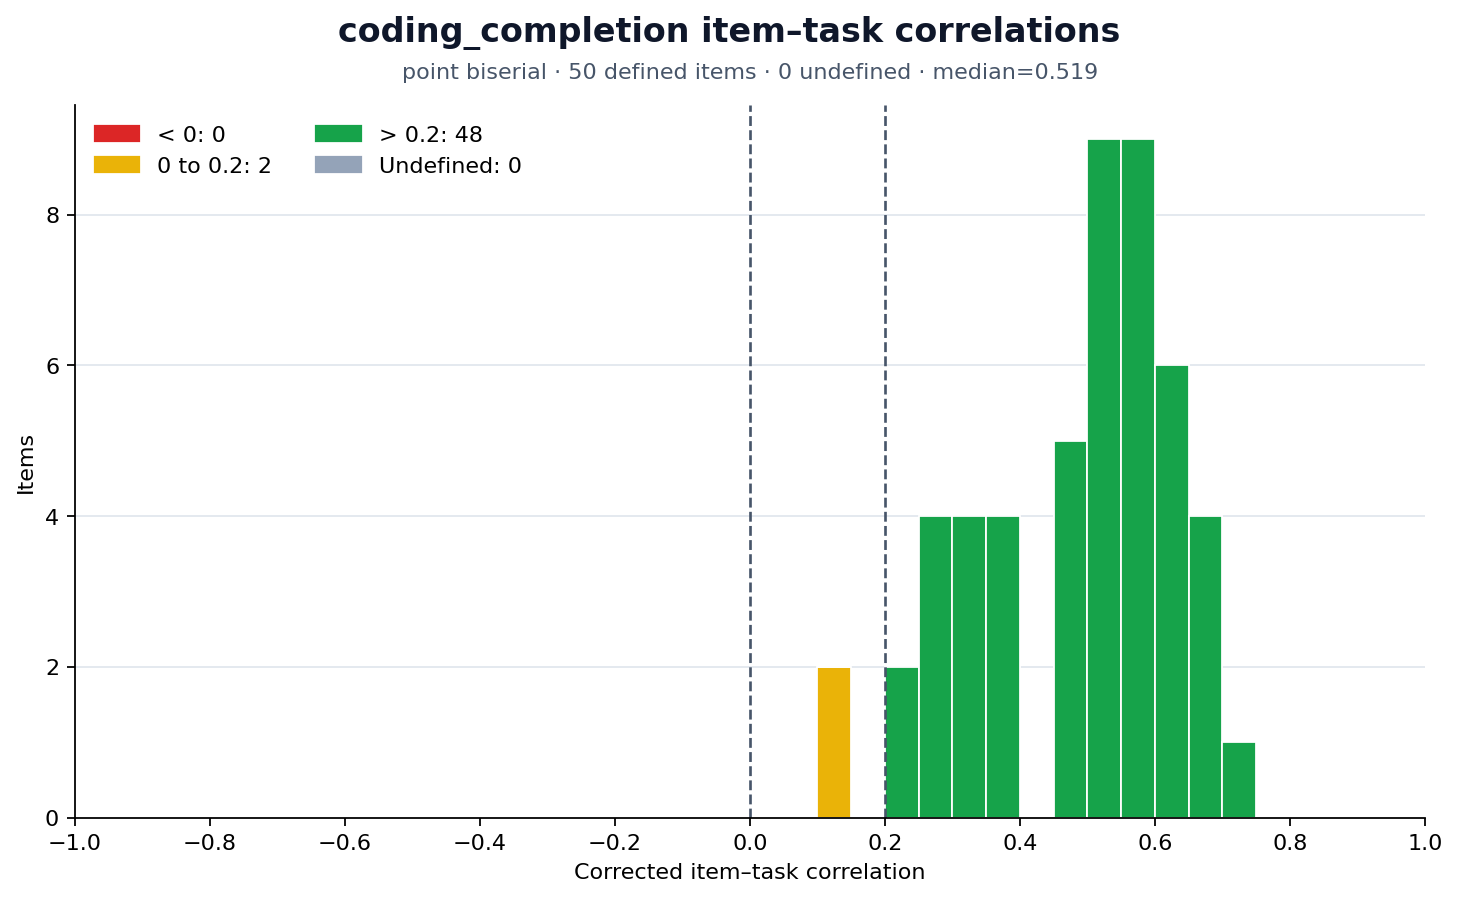
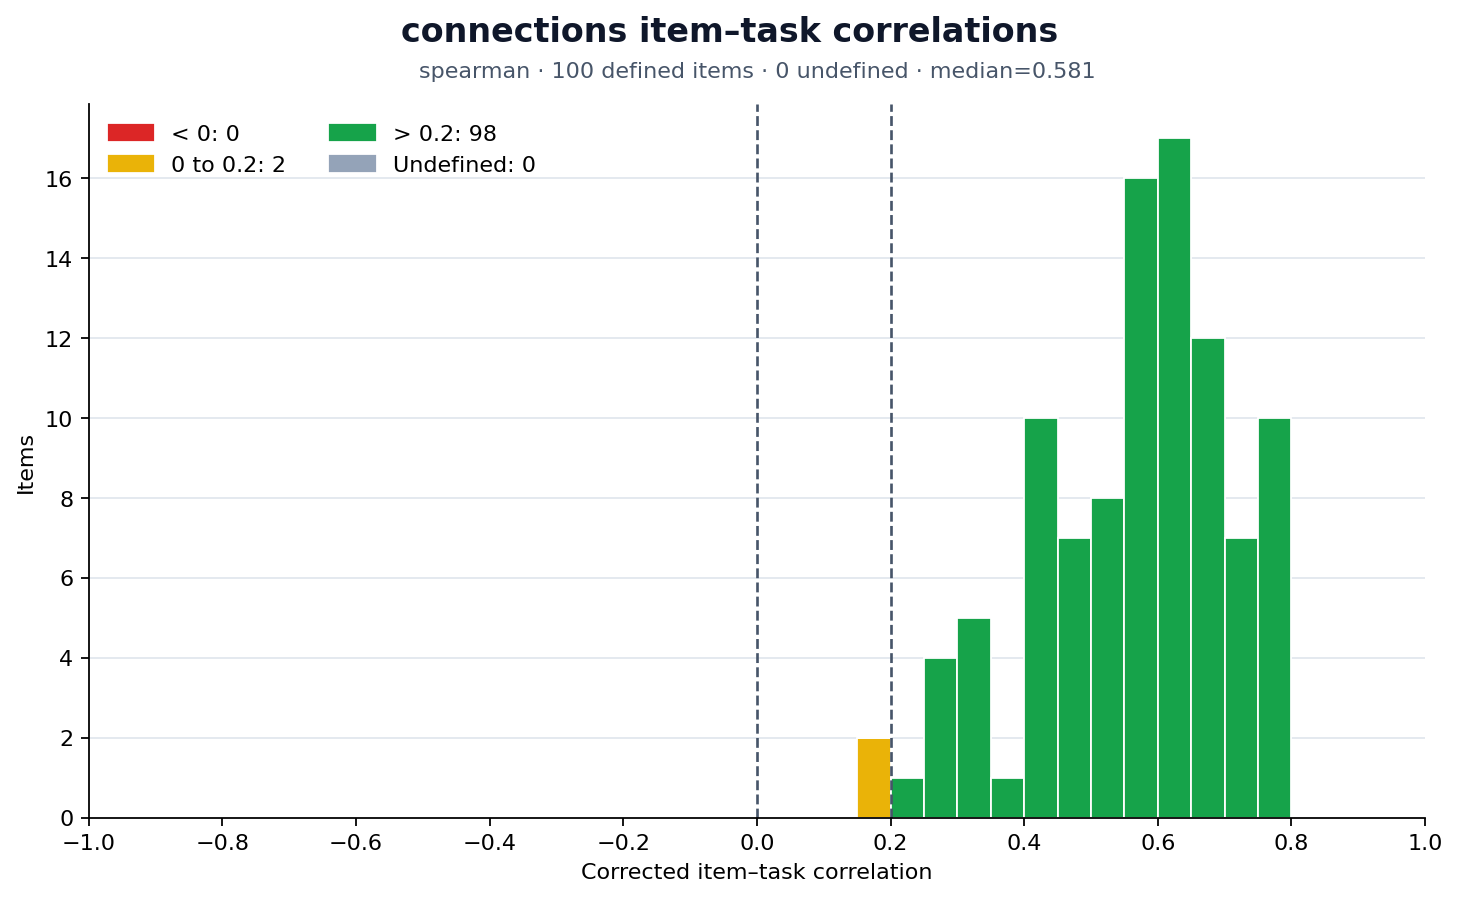
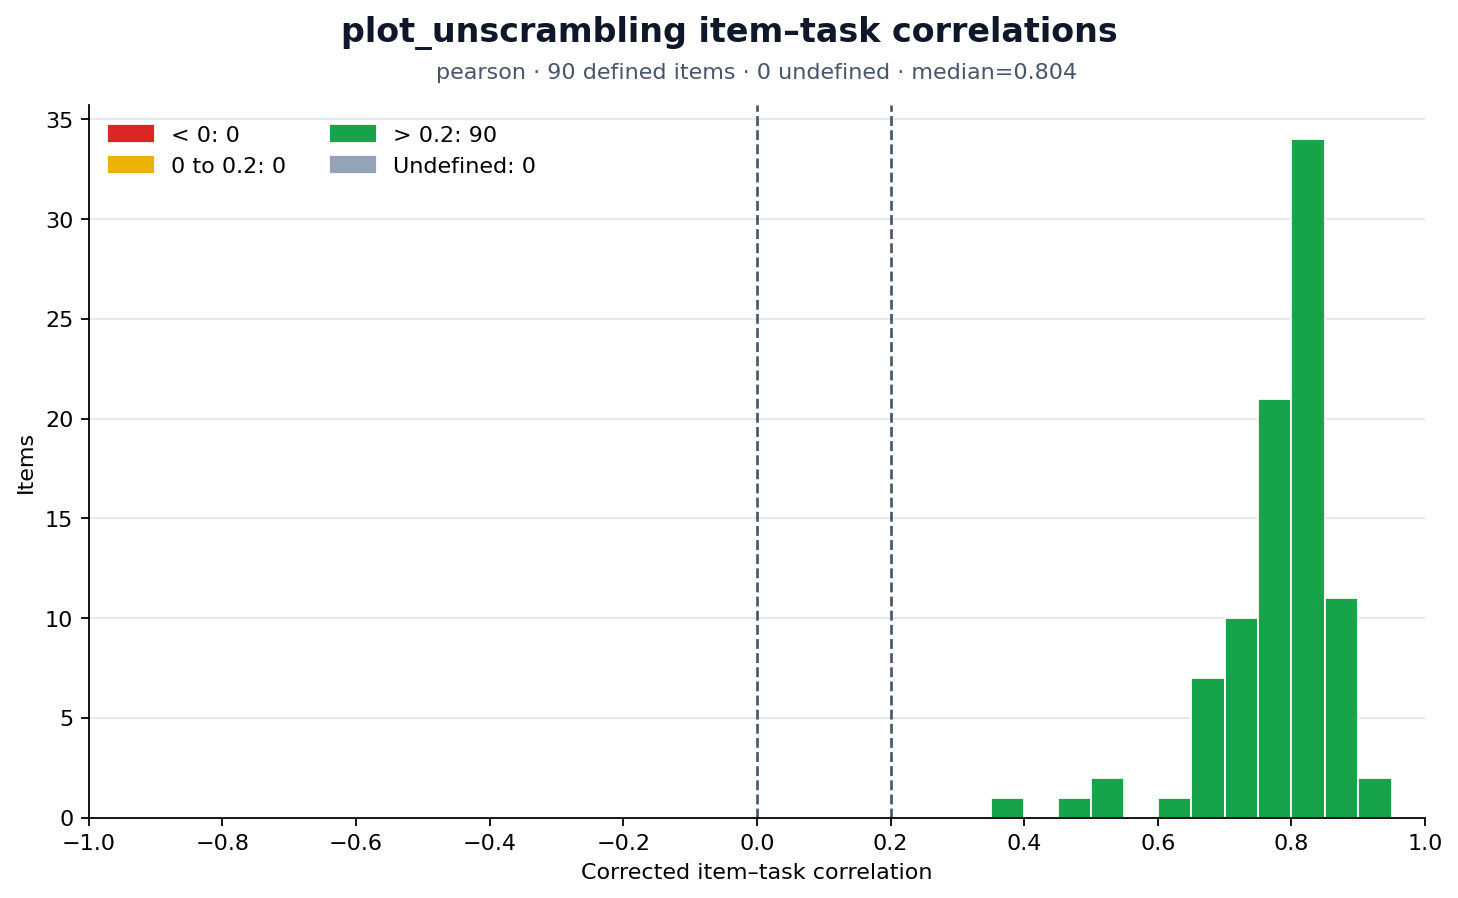
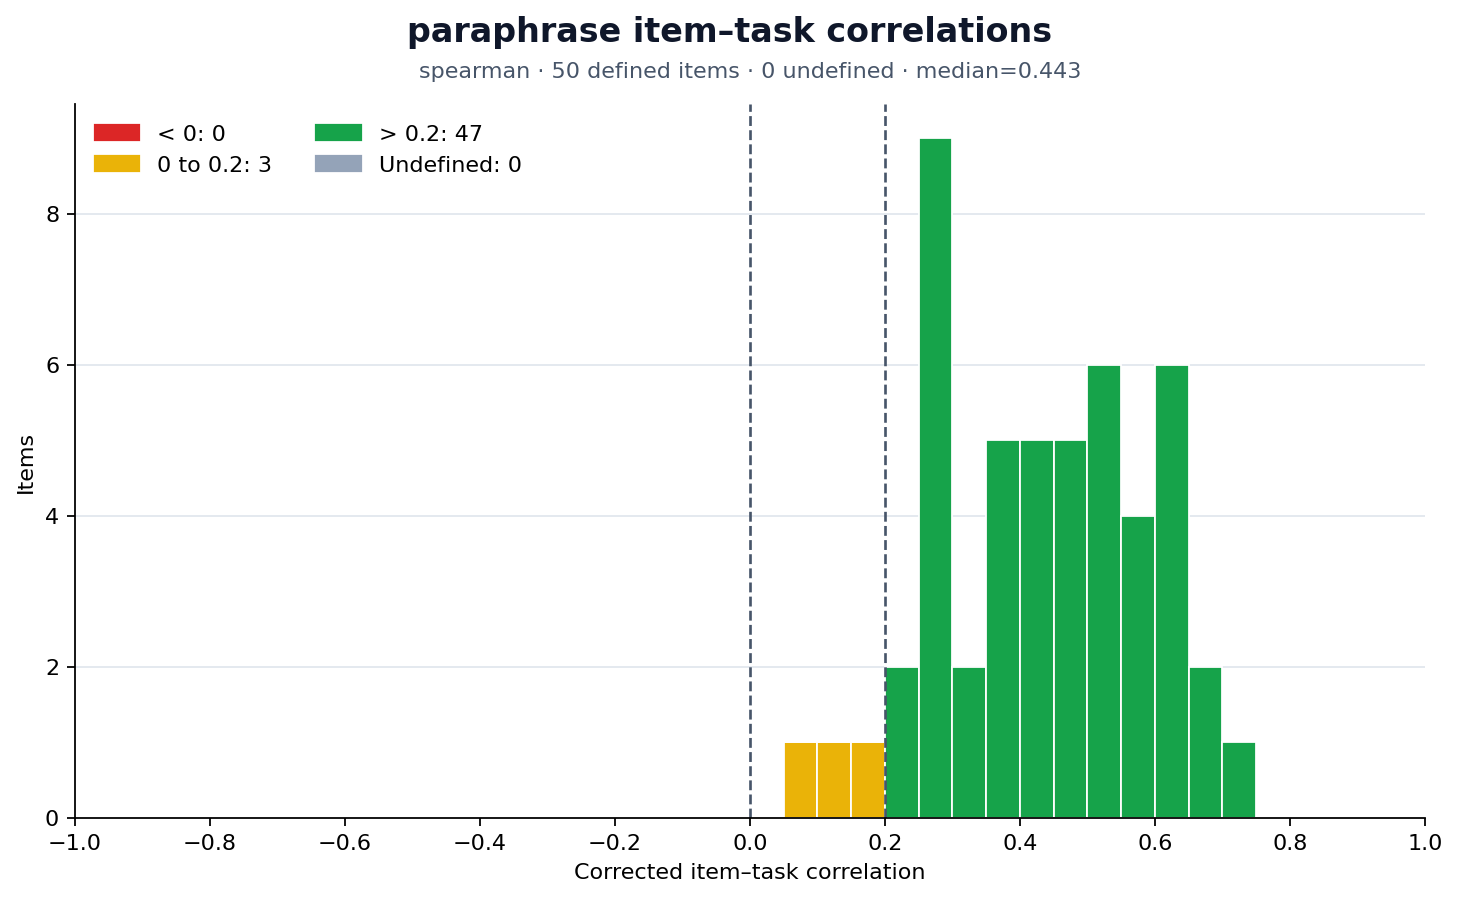
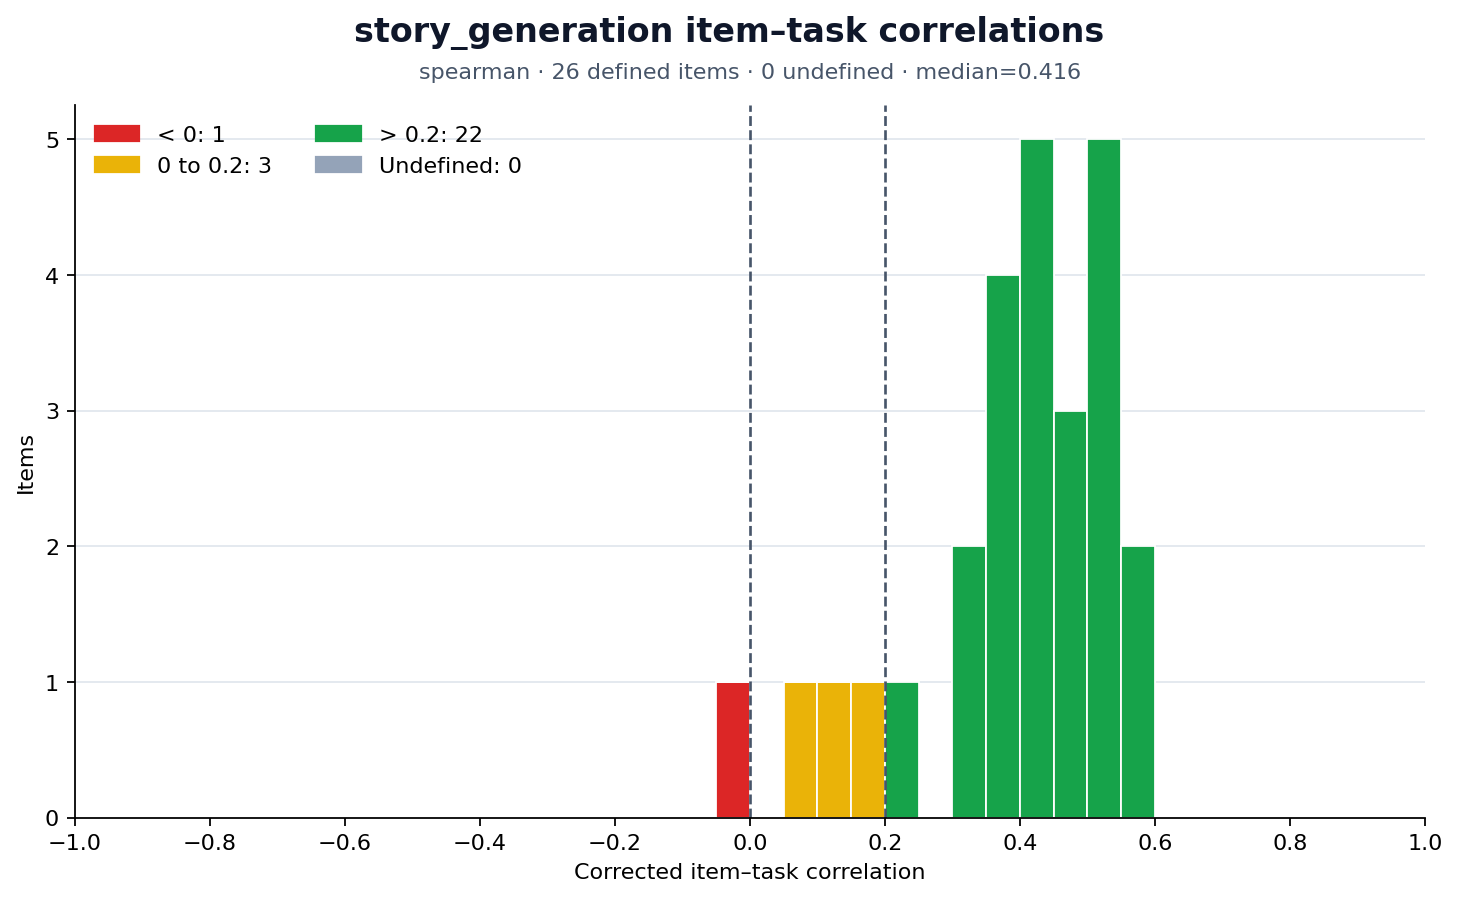
All 494 items are counted. Percentages use each task's total, including undefined correlations, and are rounded to whole numbers; rows may not sum to 100%.
| Task | Items | Red (< 0) | Yellow (0–0.2) | Green (> 0.2) | Undefined |
|---|---|---|---|---|---|
| Typos | 100 | 3 (3%) | 15 (15%) | 80 (80%) | 2 (2%) |
| LCB Generation | 78 | 0 (0%) | 1 (1%) | 72 (92%) | 5 (6%) |
| Coding Completion | 50 | 0 (0%) | 2 (4%) | 48 (96%) | 0 (0%) |
| Connections | 100 | 0 (0%) | 2 (2%) | 98 (98%) | 0 (0%) |
| Plot Unscrambling | 90 | 0 (0%) | 0 (0%) | 90 (100%) | 0 (0%) |
| Paraphrase | 50 | 0 (0%) | 3 (6%) | 47 (94%) | 0 (0%) |
| Story Generation | 26 | 1 (4%) | 3 (12%) | 22 (85%) | 0 (0%) |
| All tasks | 494 | 4 (1%) | 26 (5%) | 457 (93%) | 7 (1%) |
The flags uncovered two Typos items with valid alternative answers, three LCB Generation items with grading problems, and three Story Generation items with prompt or checker problems. The item-by-item audit gives the archived-answer counts and rescoring checks. I could inspect only a subset of items and models, so other problems may remain.
Factor Structure
Time to look at the factor structure. I’ll exclude the items I found problems with: 832610e9 and 0becbf34 from Typos; “Wrong Answer,” “Takahashi Quest,” and “Bad Juice” from LCB Generation; and 0d828b10, 6c5eb0ac, and 230fffb5 from Story Generation. Other problematic items may remain because I couldn’t inspect them. As noted above, every task except Typos is strongly unidimensional. A separate factor analysis of Typos produced factors that were hard to interpret, so for simplicity I’ll model each task, including Typos, with a single factor.
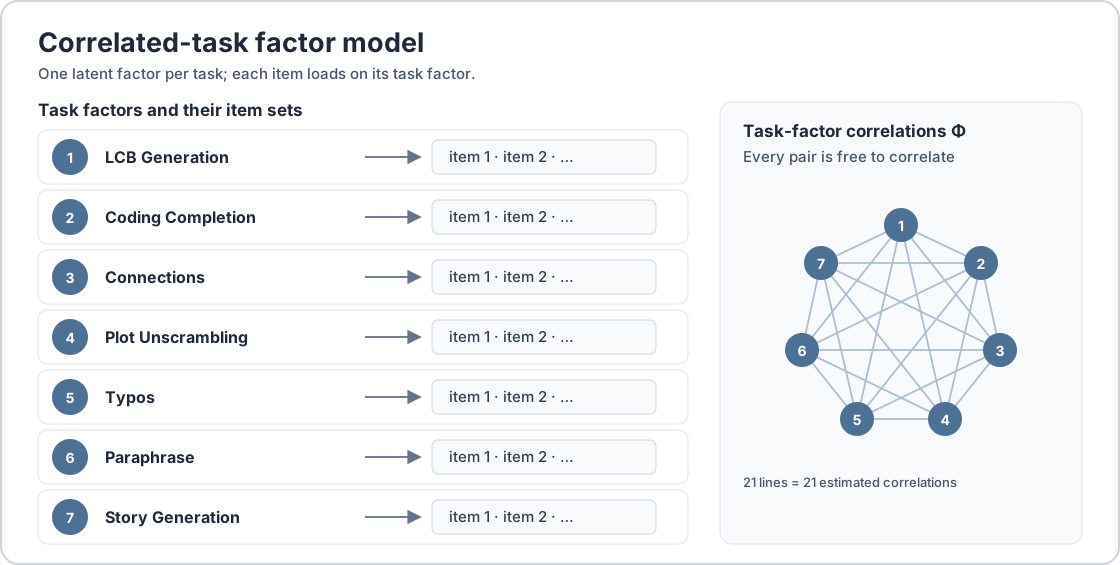
The item loadings in the correlated-task model look like this:
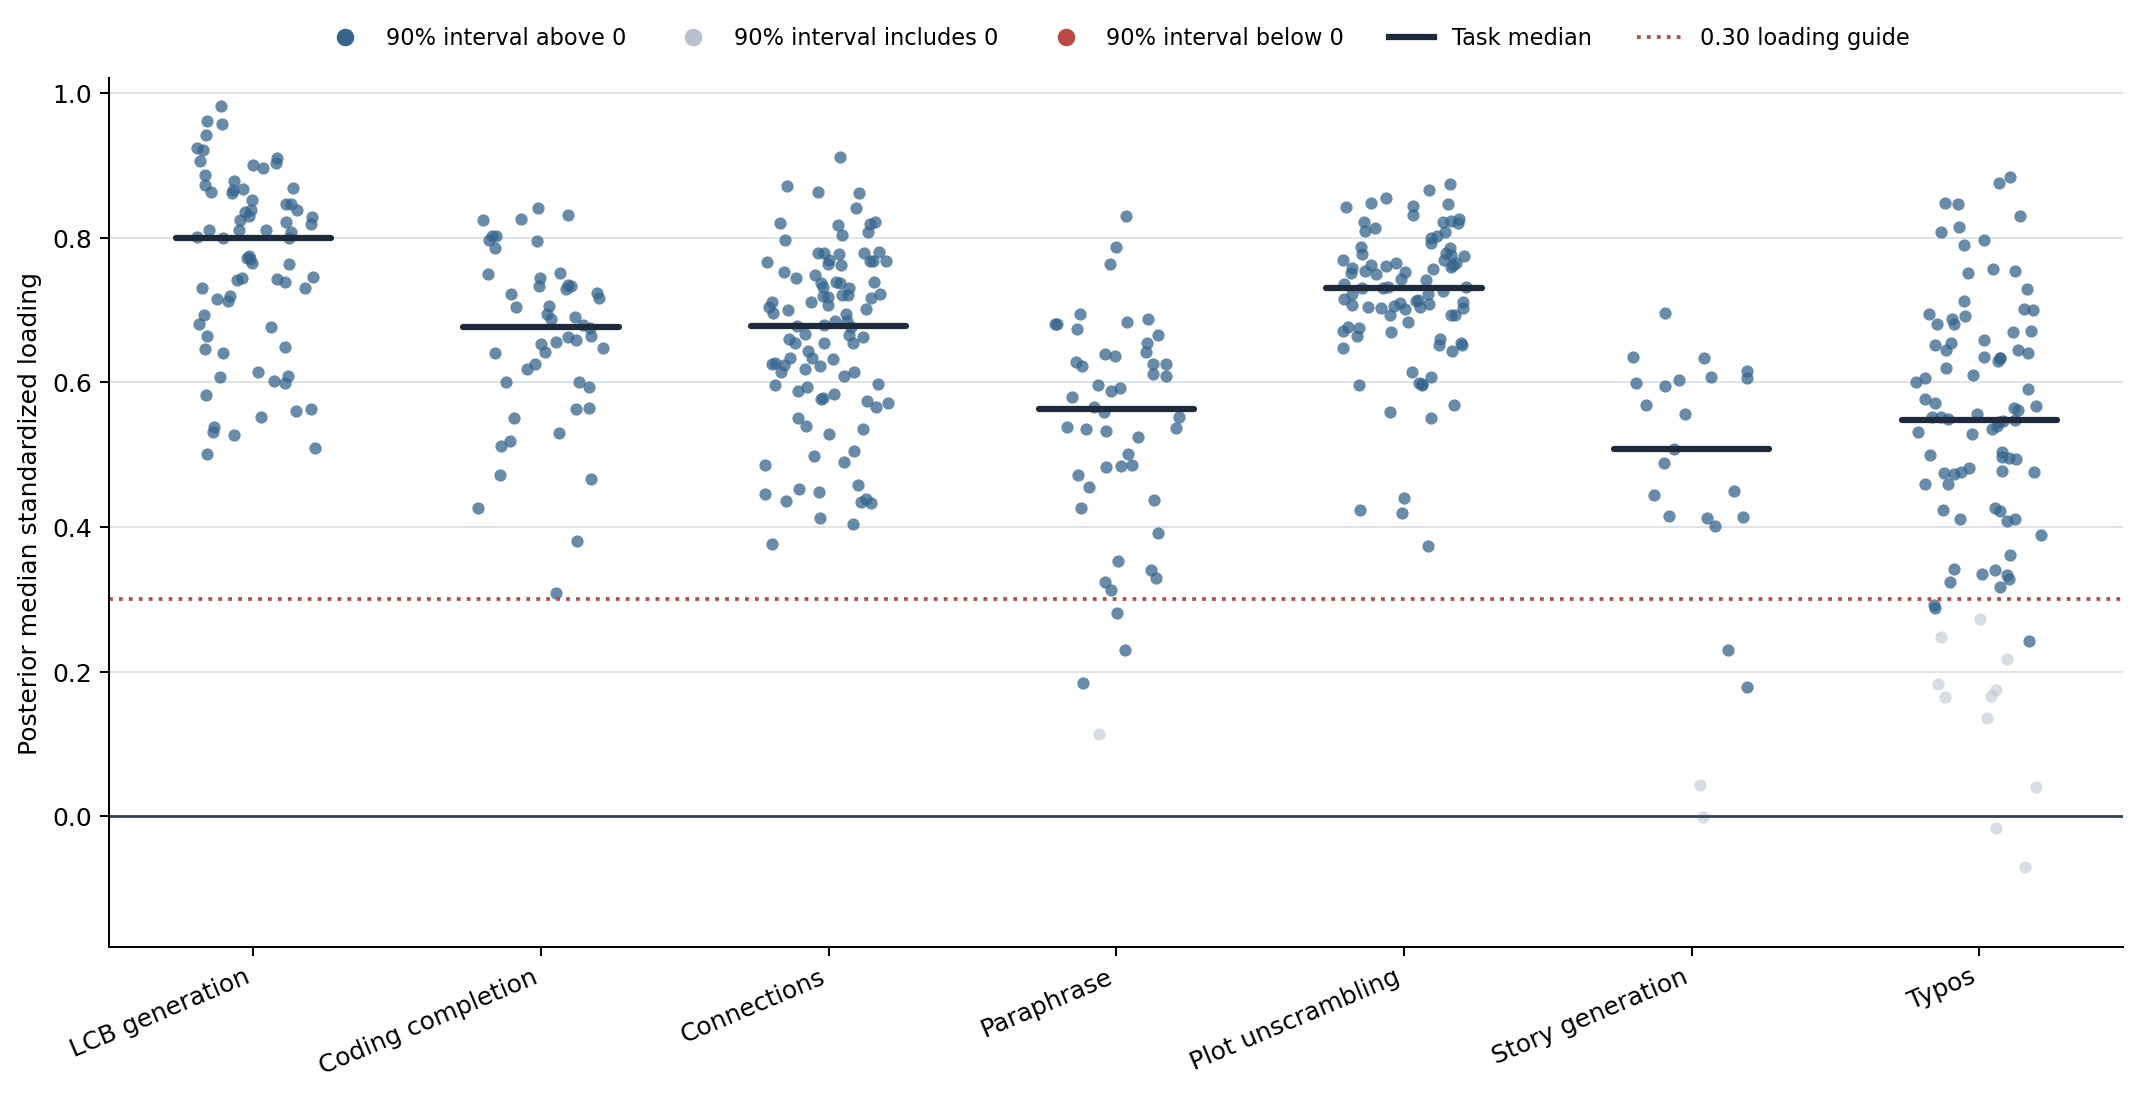
Fourteen items have 90% loading intervals that include zero. That doesn’t mean they’re flawed, but it does make them worth a closer look. I’ve put my notes in a collapsible section so they don’t interrupt the main discussion.
Items whose 90% loading intervals include zero (14)
Typos
- For the item with ID prefix
d889972c, the corruptedvectorfiel-basedis keyed asvector field-based, but some models correct it tovector-field-based, which seems like a valid alternative. Of the 77 model answers I could check, 51 were marked wrong; 3 of those otherwise match the key exactly and differ only in hyphenation. Since the prompt asks models to preserve stylistic choices, I’d call this ambiguous rather than a definite scoring error. - For the item with ID prefix
2b05709f,anbdhtenis keyed asand the, matching the original abstract. Butand thenis also a plausible correction in context. Of the 77 model answers I could check, 62 were marked wrong; 28 of those otherwise match the key exactly and differ only in usingand then. - For
c705c2cb, I found no key or scoring problem among the 77 archived answers I could check. - For the other eight Typos items, the public data provides neither prompts and keys nor archived answers, so I could not audit them.
Paraphrase
- The sole Paraphrase item has a coherent prompt and key, but no archived answers, so I cannot determine whether any scores were wrong.
Story Generation
- For both the items, the archived scores agree with the prompt.
The task-factor correlations look like this:
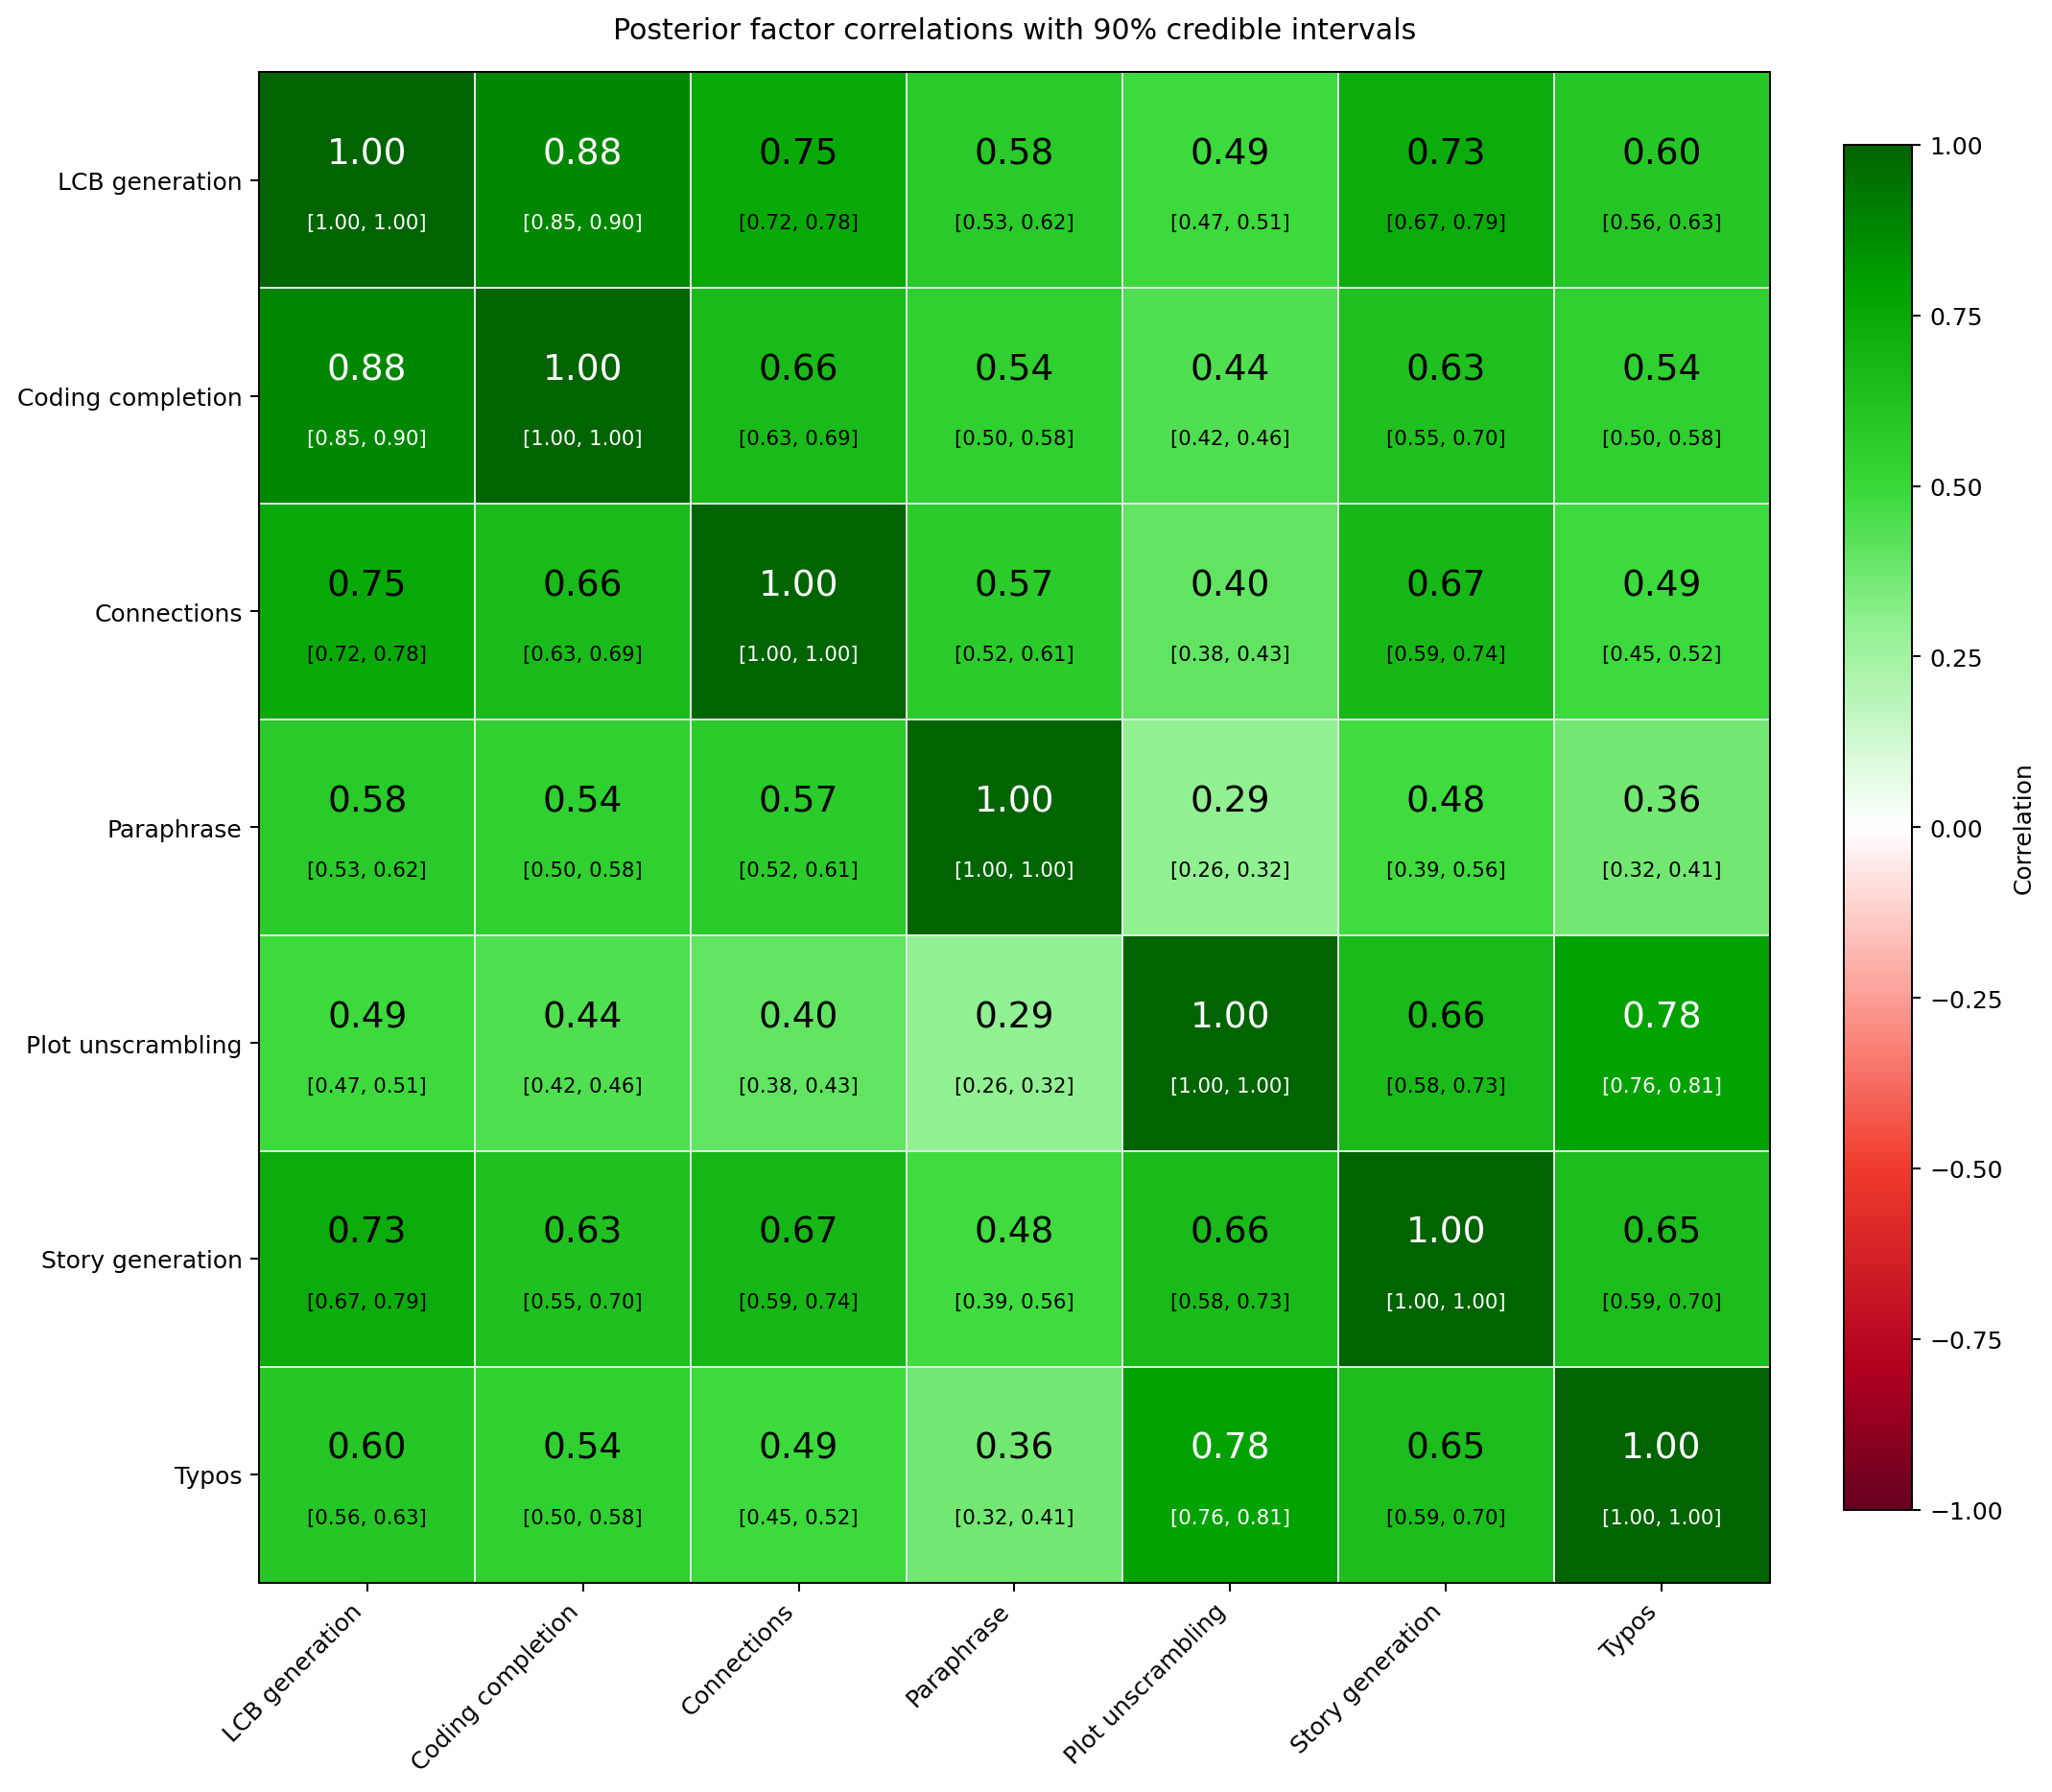
There’s a clear positive manifold, and parallel analysis of the task-factor correlation matrix supports a single factor. This would imply a hierarchical model in which a higher-order factor explains the correlation among tasks. However, since LiveBench groups tasks into categories, we might instead add Coding, Language, and Instruction Following domain factors. Those domains could correlate freely or load on an even higher-order factor.
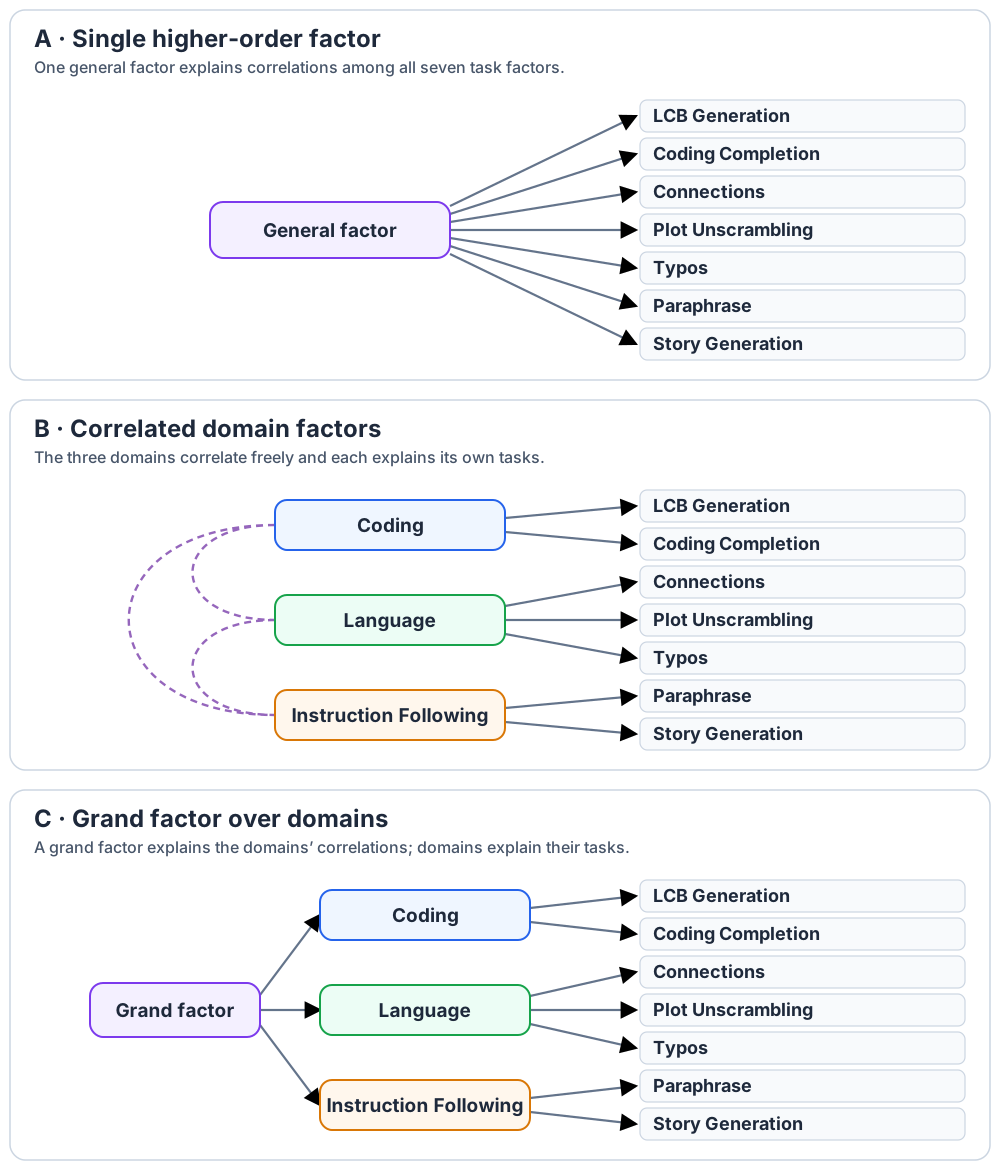
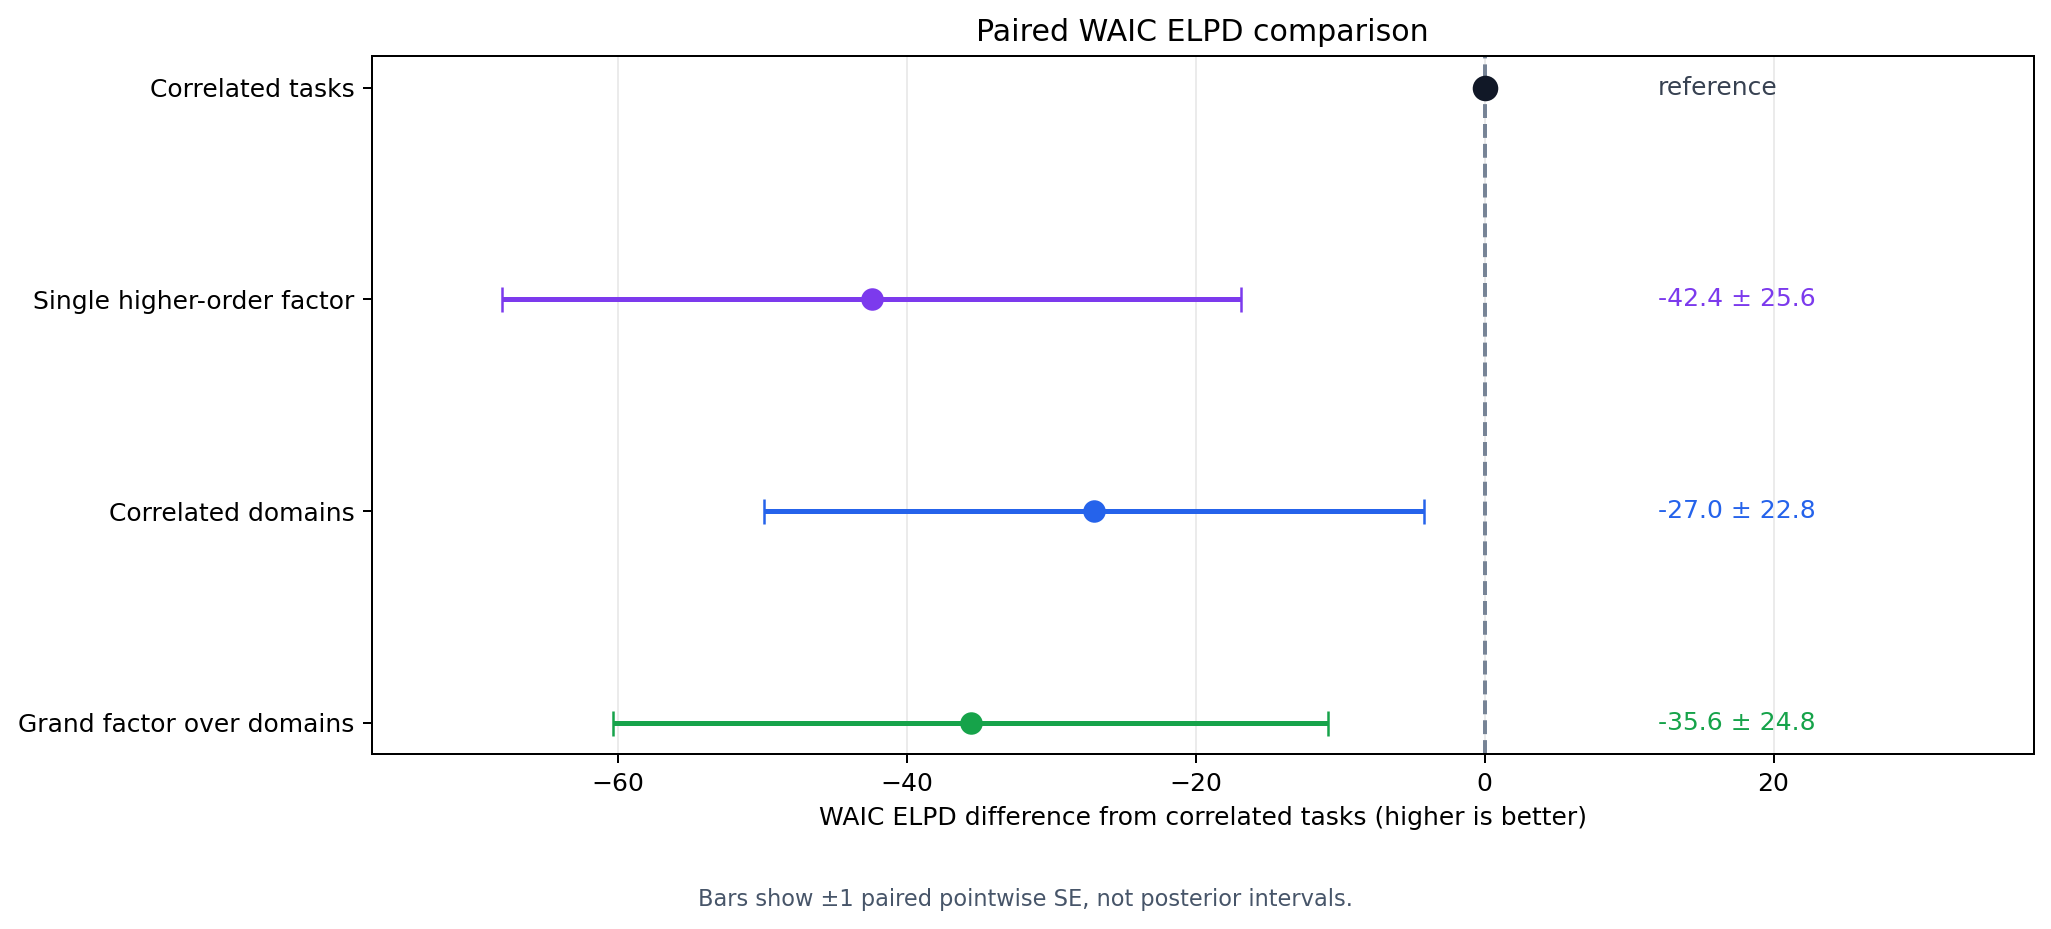
Unfortunately, each of these models fits worse than the correlated-task model (see the initial comparison).
The domain estimates help explain why. In the correlated-domains model, the domain correlations are quite high:
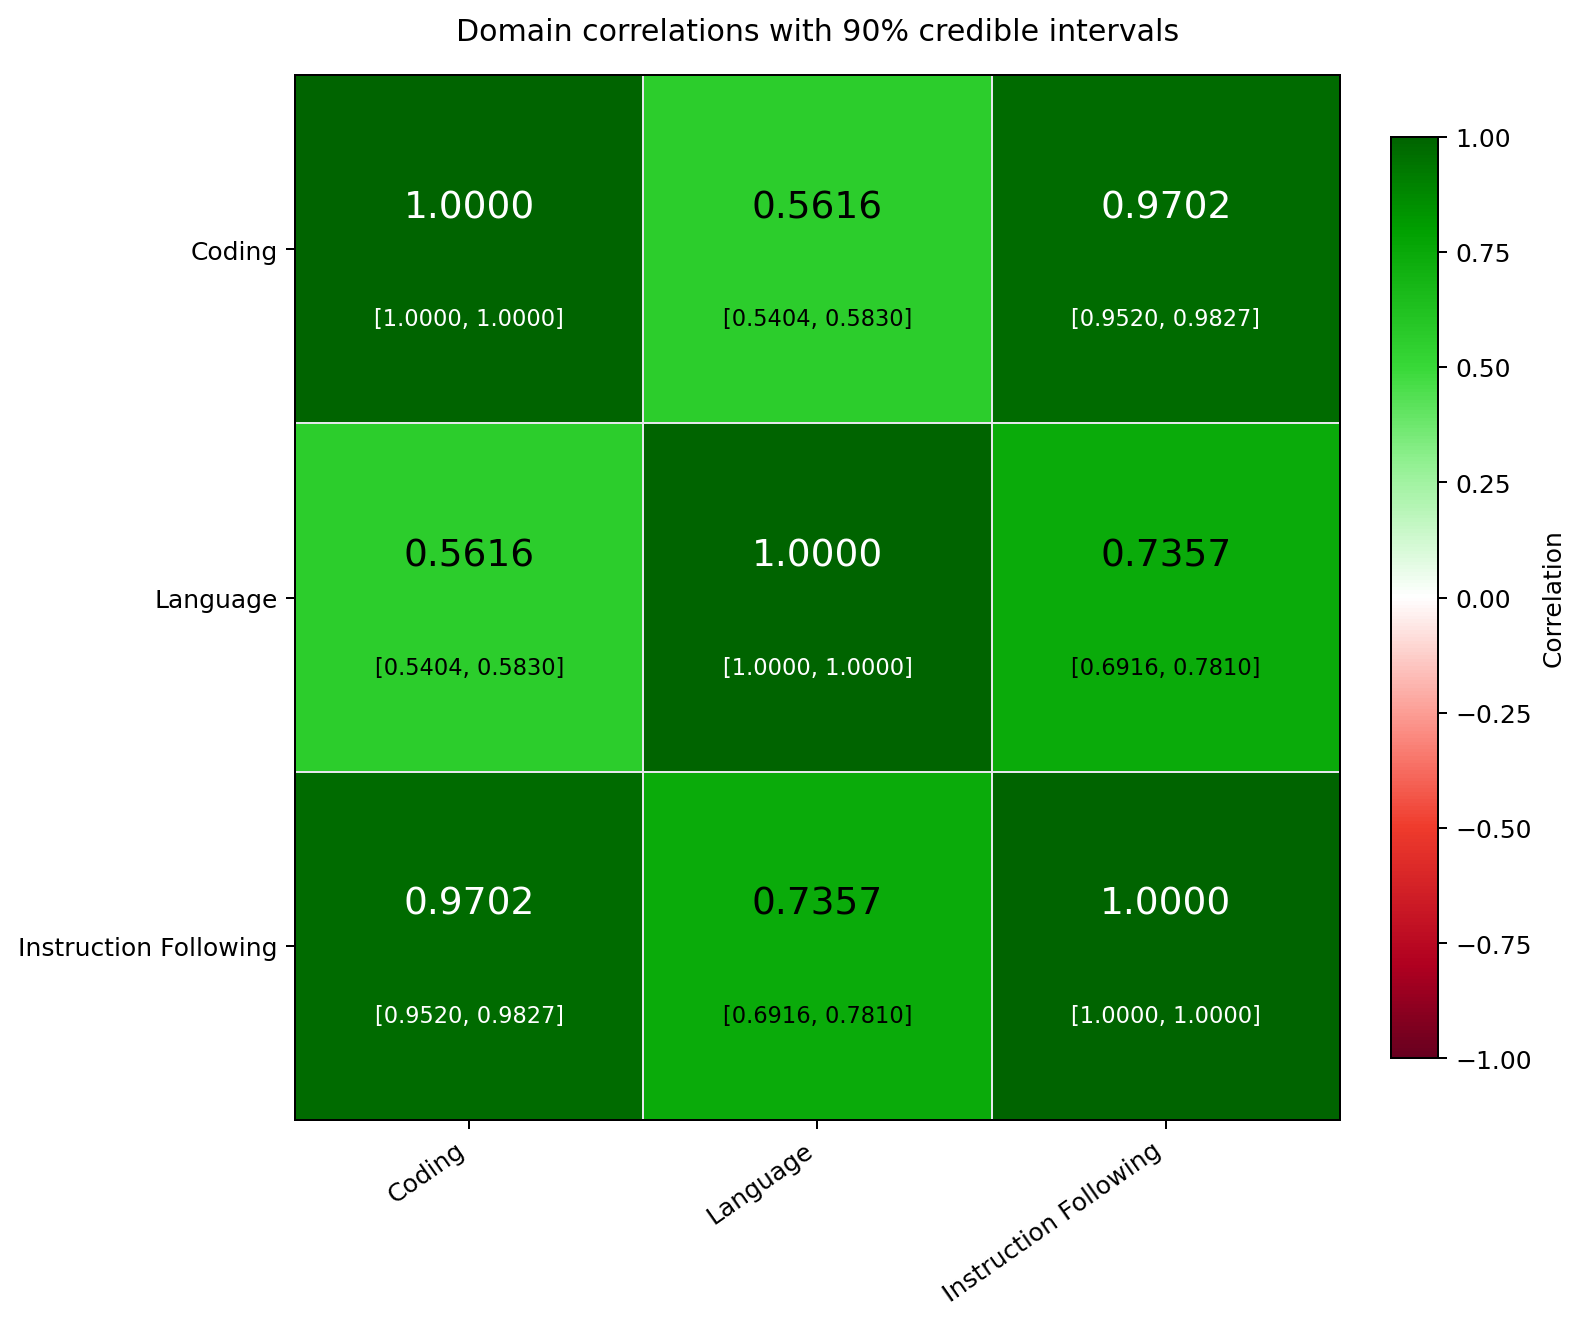
Even so, they can’t account for some of the task-factor correlations, as we’ll see below. In the grand-factor model, all three domain loadings are very close to 1; the lowest loading is 0.9993. That leaves little domain-specific variance, so modeling the categories doesn’t seem to add much.
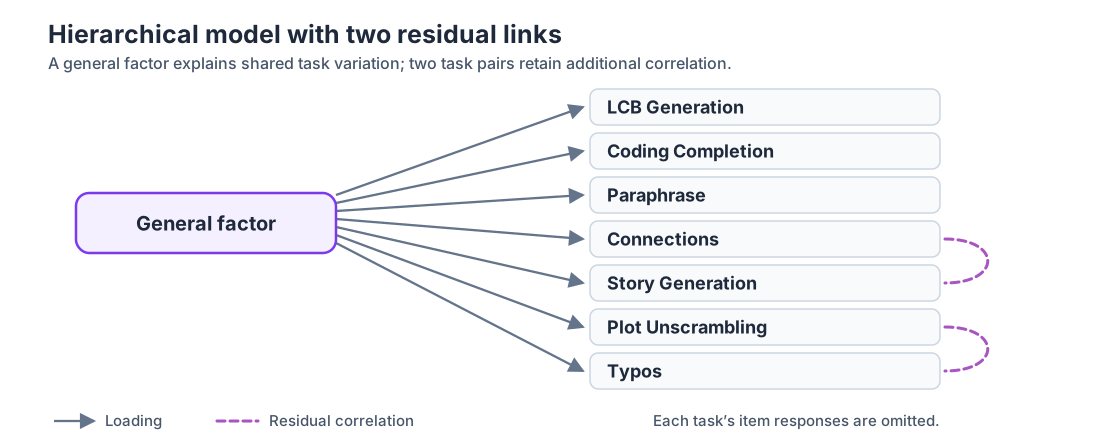
That brings us back to the hierarchical model. It also fits worse than the correlated-task model, but I find it more plausible a priori. The positive manifold is what I’d expect from LLMs, and parallel analysis of the task-factor correlations supports one common factor. Its poorer fit suggests that the general factor alone misses some relationships between tasks. We can allow for those relationships by adding correlated residuals, so that selected task factors can correlate more than the general factor predicts.
To see which links might be worth including, I fit an exploratory hierarchical model with positive-only shrinkage priors on all 21 task-residual correlations:
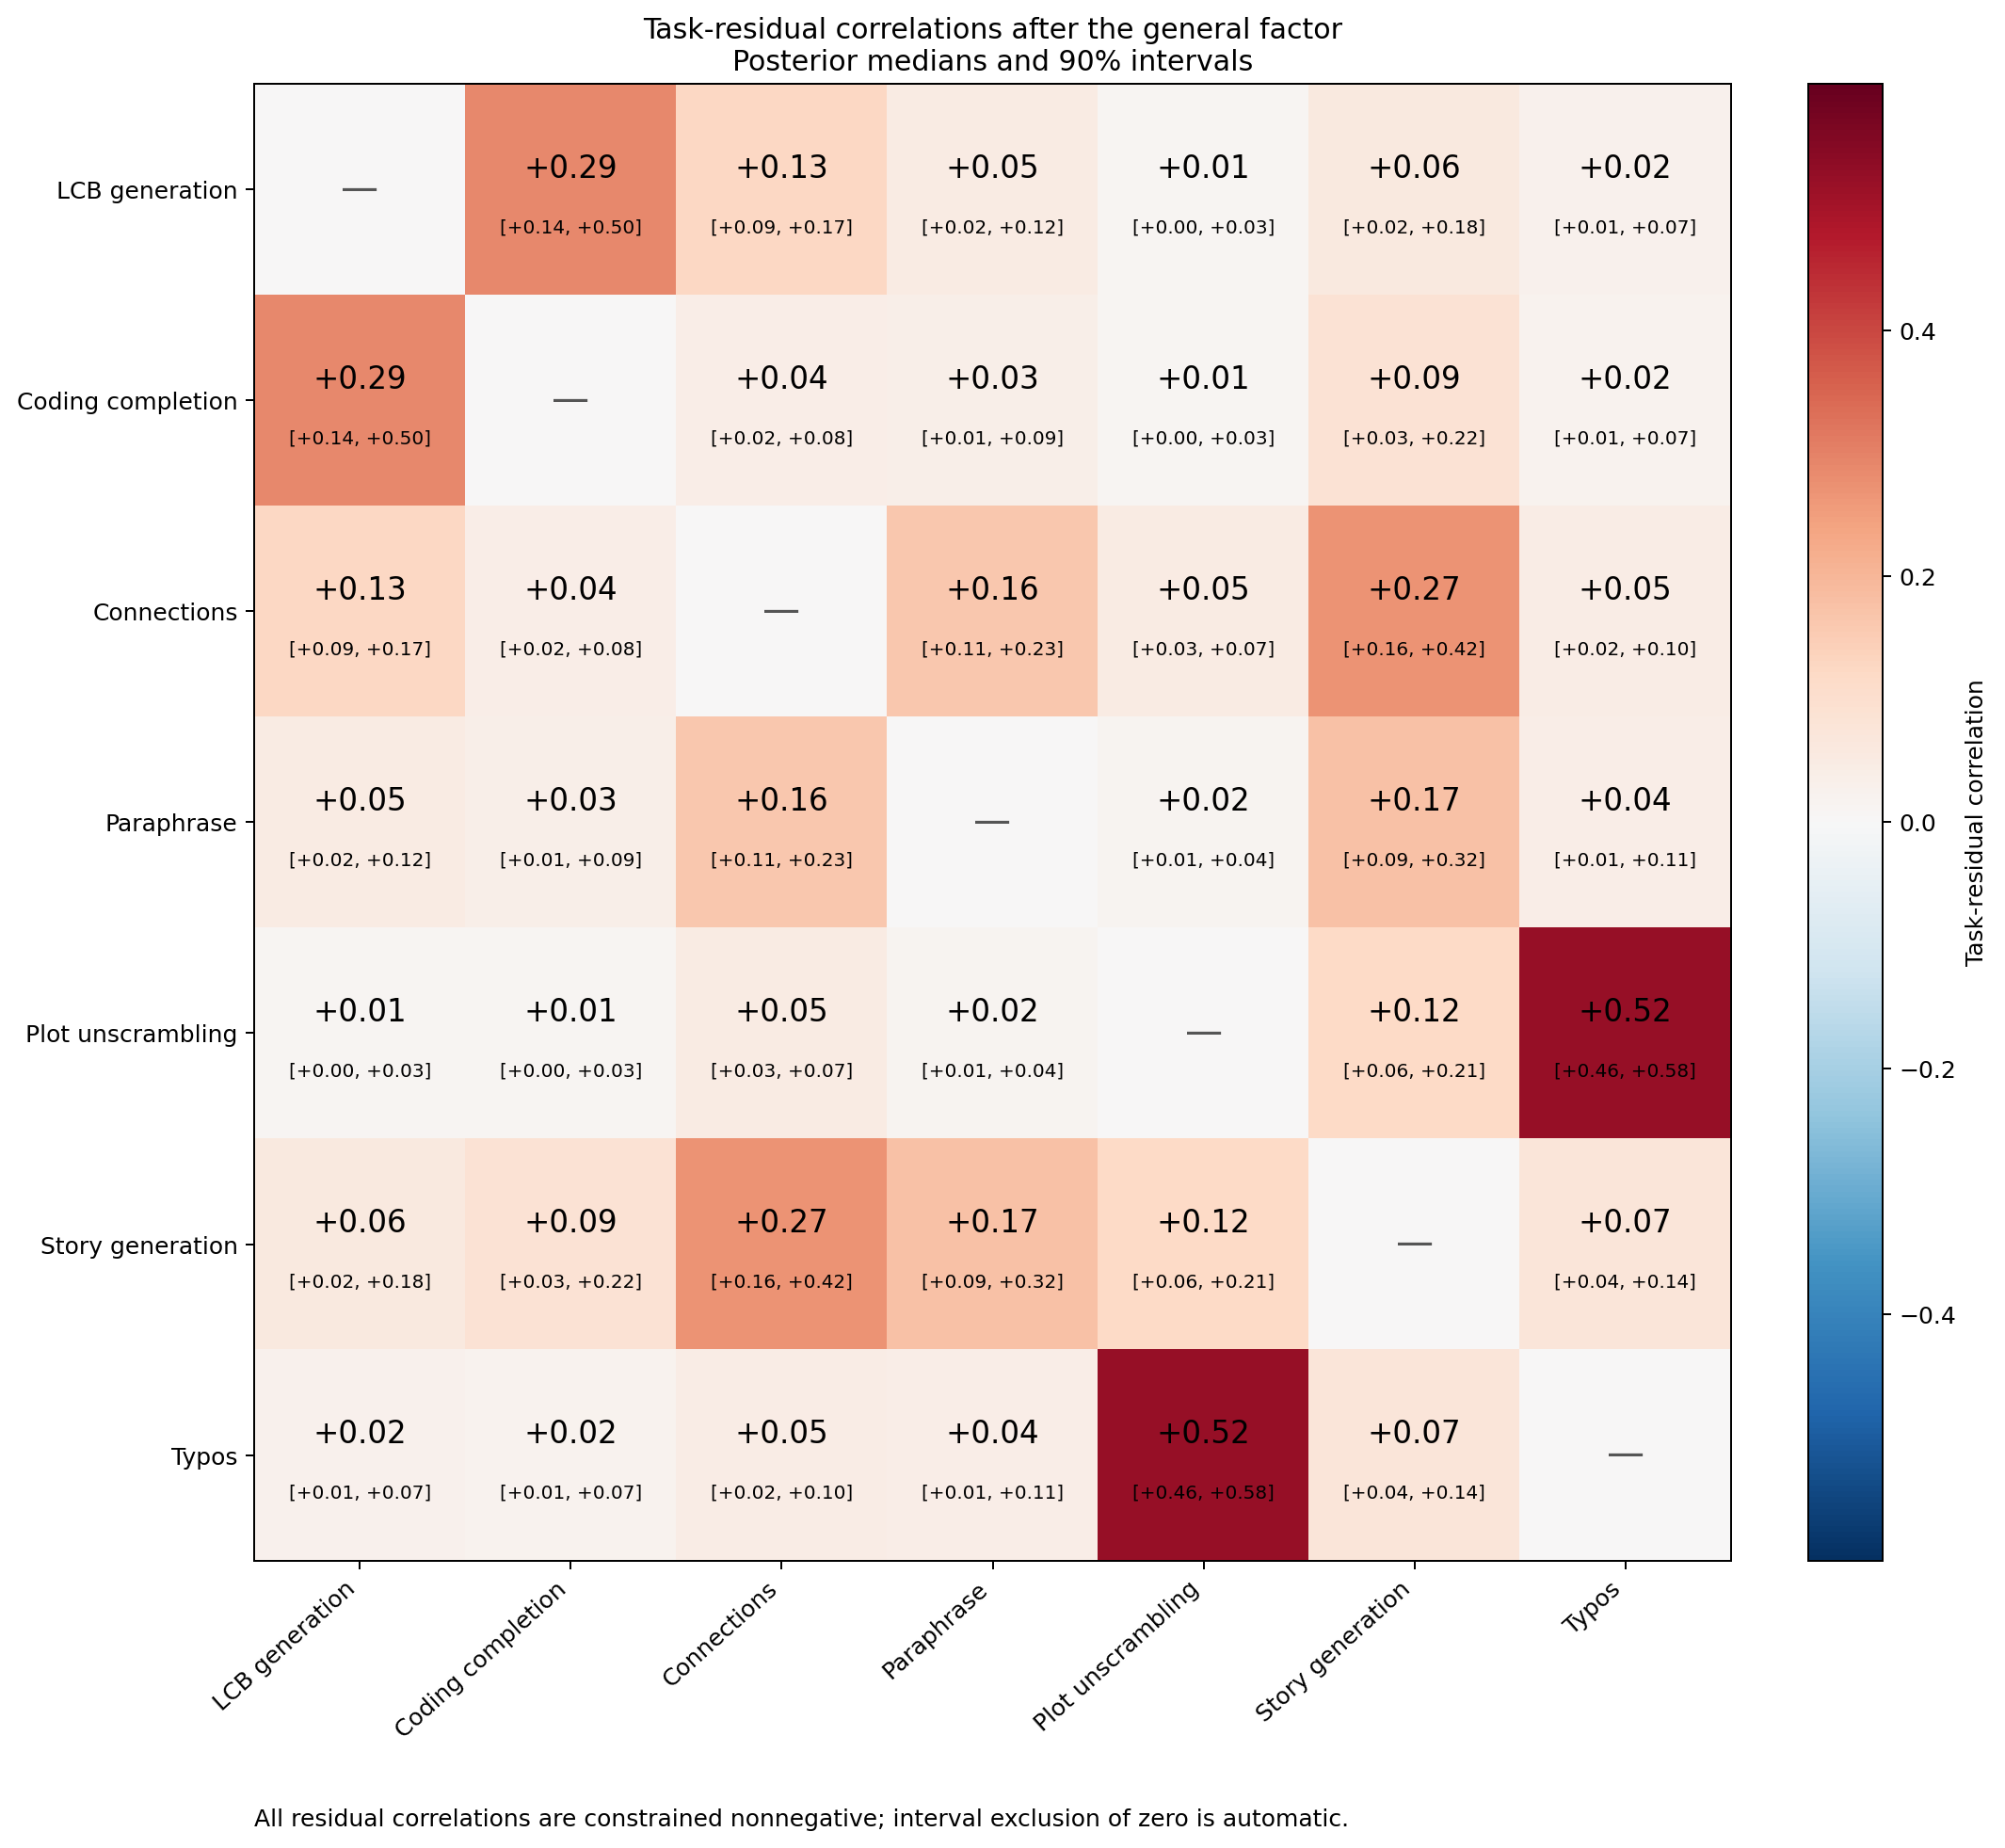
The largest estimated residual correlations are Plot Unscrambling–Typos (+.52), LCB Generation–Coding Completion (+.29), and Connections–Story Generation (+.27). But Coding Completion’s loading on the general factor is almost one in this exploratory fit, leaving virtually no task-specific variance. Its +.29 residual correlation therefore adds only about +.002 to the implied correlation between the two tasks. I’ll include Plot–Typos and Connections–Story, but not LCB–Coding. Because the exploratory prior rules out negative residual correlations, an interval above zero is not, by itself, a reason to include a link.
In the final hierarchical model, only those two residual correlations are estimated, with priors that allow either sign. All other residual correlations are fixed at zero. The posterior estimates are:
| Task pair | Median residual correlation | 90% interval |
|---|---|---|
| Plot Unscrambling–Typos | +.57 | [+.52, +.61] |
| Connections–Story Generation | +.35 | [+.19, +.48] |
Comparing the new model with the previous ones:
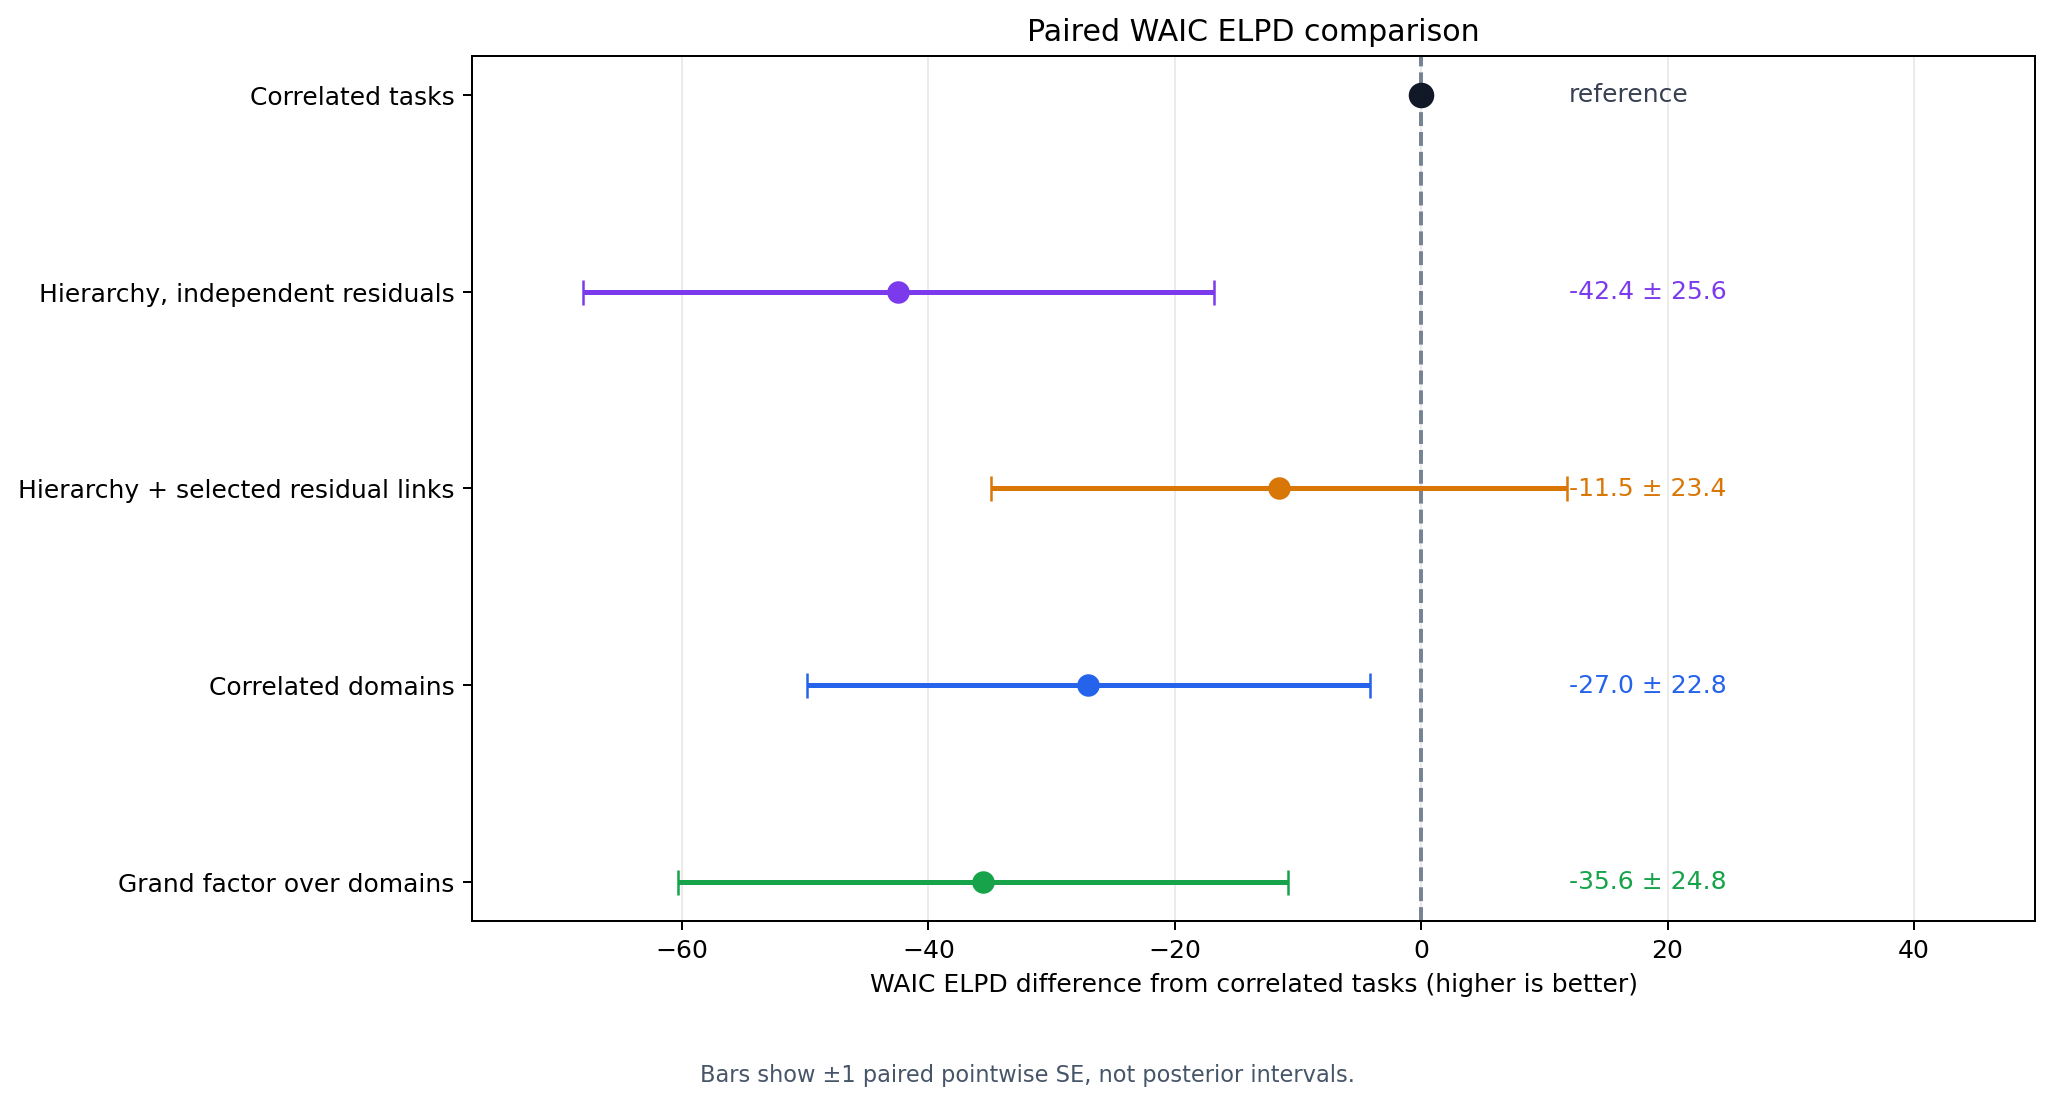
The two residual correlations improve the hierarchical model’s fit.
The loadings of the seven tasks on the general factor in this fit are:
| Task factor | Median loading | 90% interval |
|---|---|---|
| LCB Generation | .91 | [.90, .92] |
| Coding Completion | 1.001 | [1.00, 1.00] |
| Connections | .82 | [.80, .83] |
| Plot Unscrambling | .70 | [.69, .71] |
| Typos | .79 | [.77, .81] |
| Paraphrase | .77 | [.74, .80] |
| Story Generation | .86 | [.82, .89] |
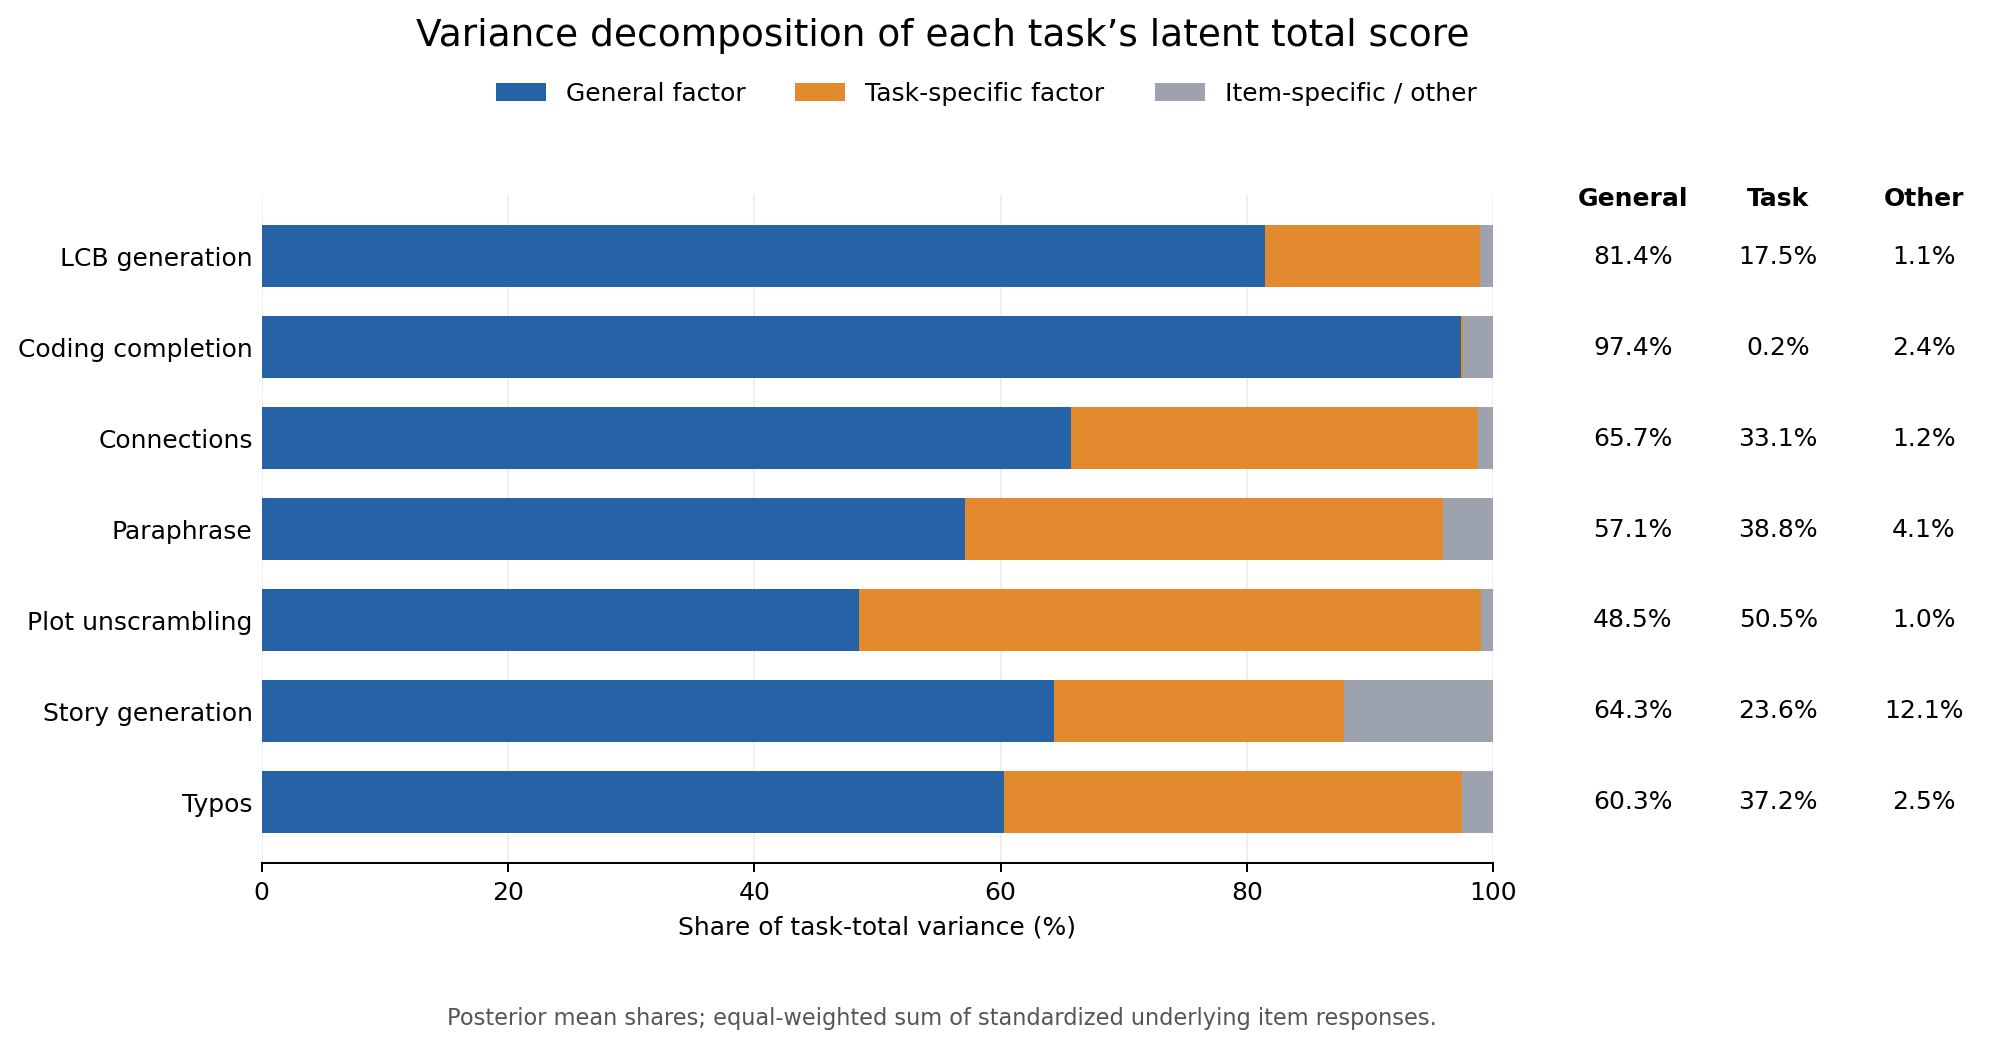
We can also ask how much of each task’s total-score variance is attributable to the general factor, its task-specific factor, or item-specific variation. This decomposition is for an equal-weighted sum of underlying item responses, not the observed mixed-format LiveBench score:
Correlations with the ECI
This compares Epoch’s ECI with posterior-mean factor scores from the selected hierarchical fit.2 The general factor correlates strongly with ECI. The task factors do too, though much of that correlation appears to come from their shared general component. Once that component is removed, only the Plot Unscrambling and Paraphrase residuals have 90% intervals entirely above zero.
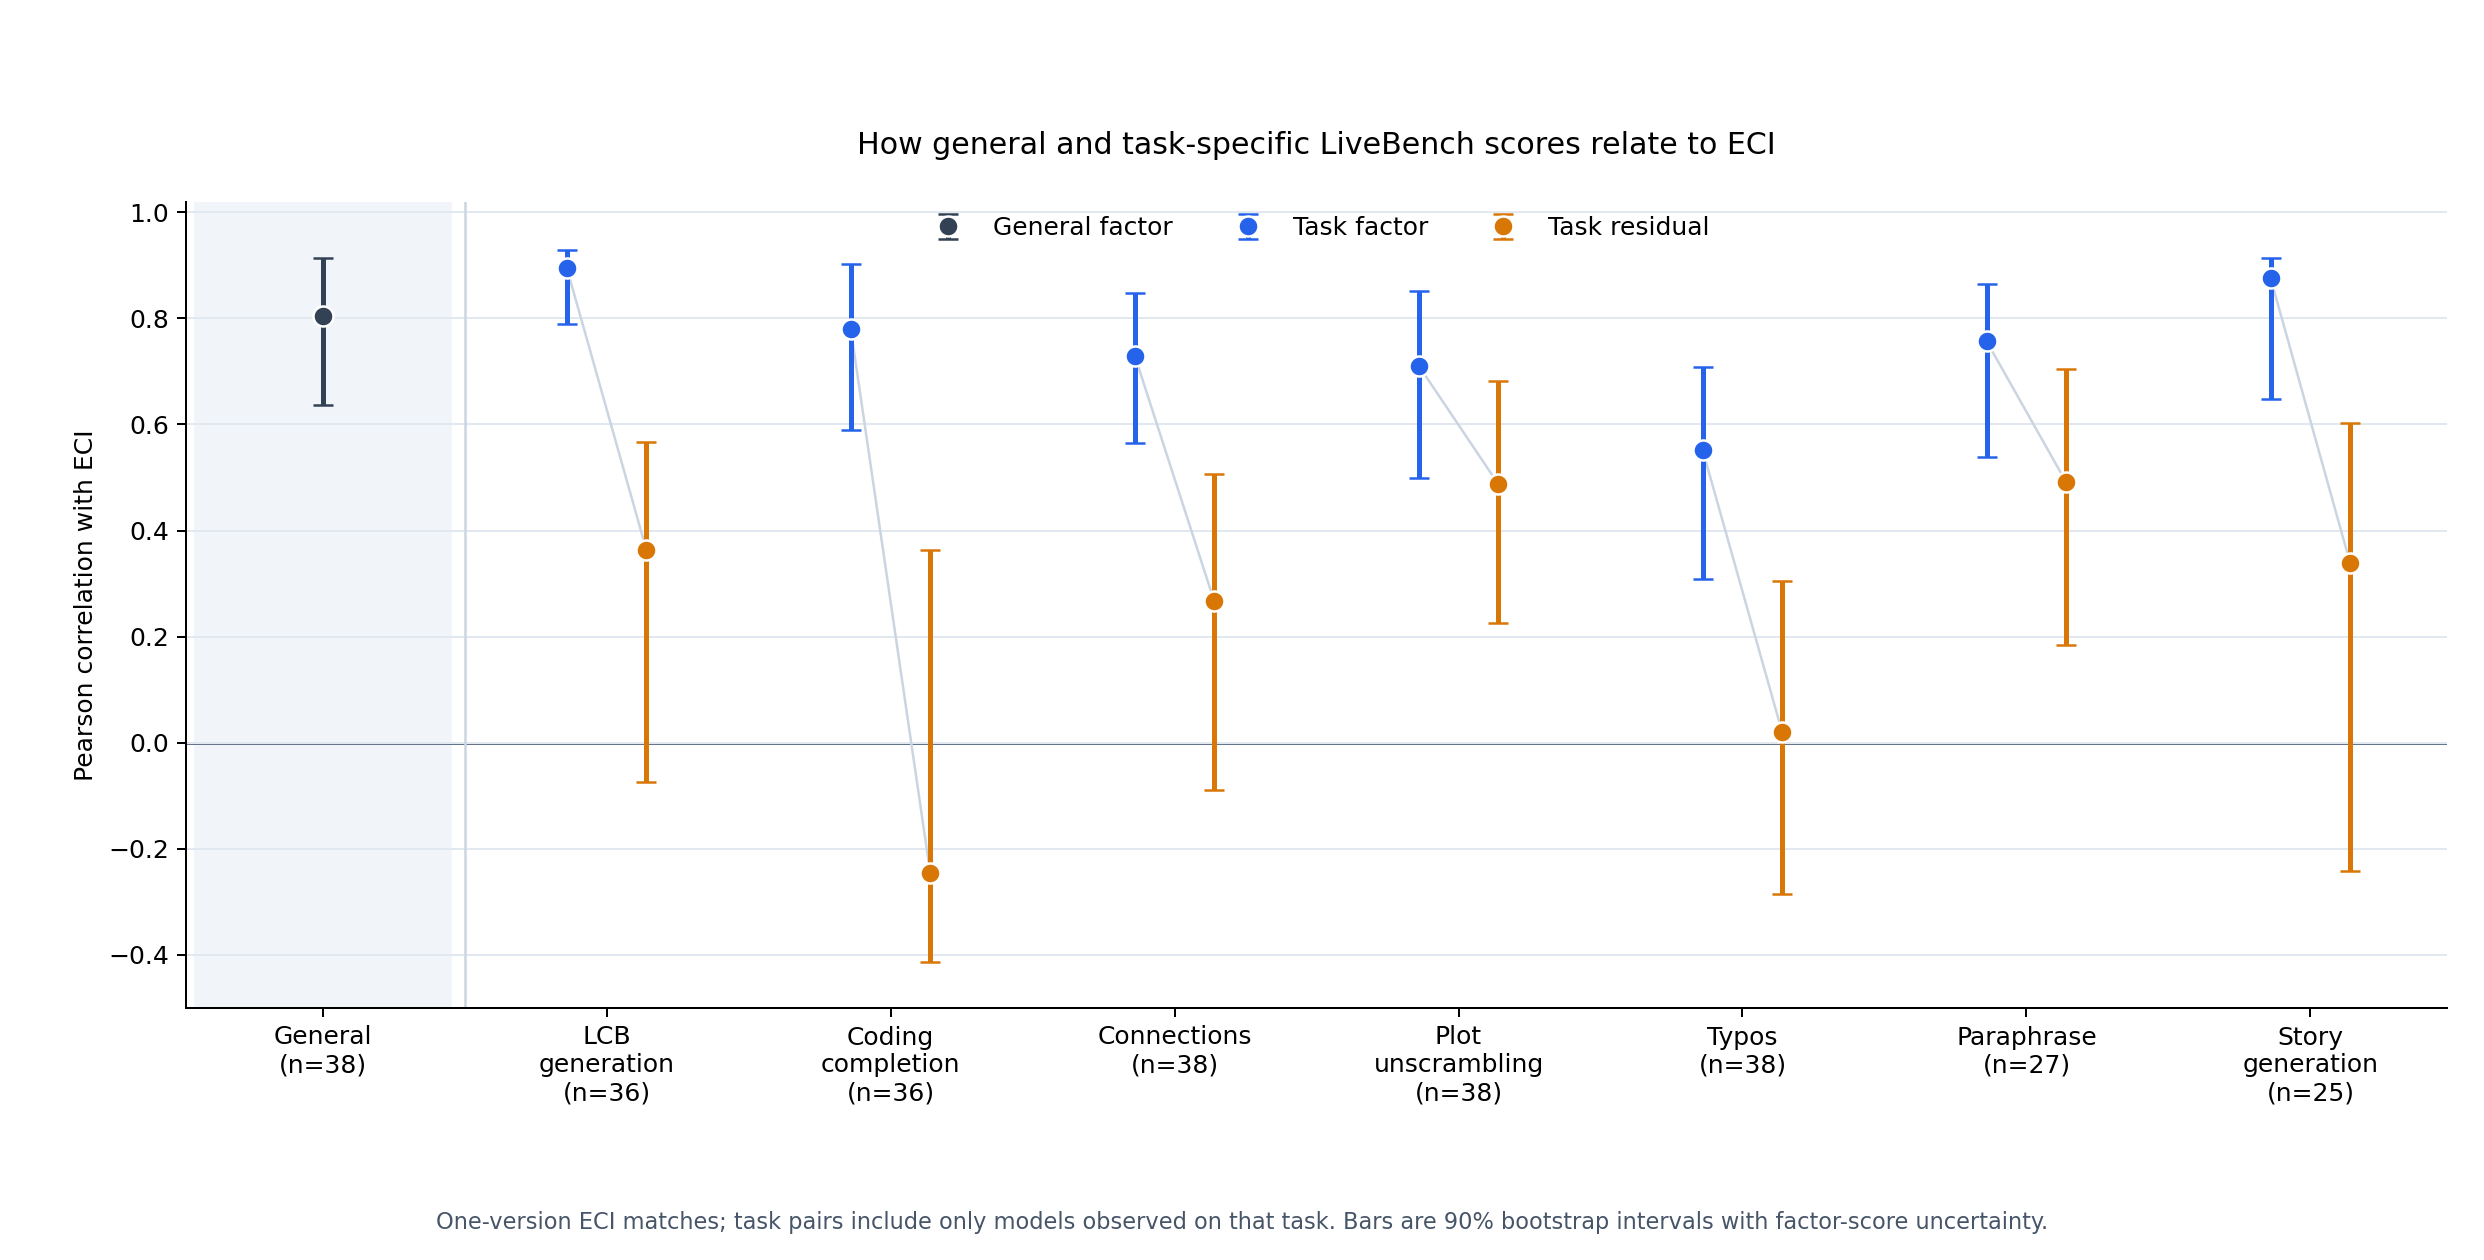
Blue: full task factor · Orange: task residual after removing the general factor · General factor at left. Bars show 90% bootstrap intervals; counts include direct task responses only.
Takeaways
Once again, benchmark item flags proved useful for finding problems. The task factors display a positive manifold, as expected. What’s more notable is the lack of clear domain factors beyond the general factor. Human cognitive ability is well modeled by g, but not perfectly: someone may be better at spatial tasks, and someone else better at verbal tasks, than their levels of g would predict. They could have the same g, yet if you needed to navigate an unfamiliar city or write an essay, you might have a clear choice between them.
That distinction is much less apparent for the AI models and tasks tested here. LiveBench divides its tasks into categories, but I find little evidence that these categories capture distinct abilities. It doesn’t seem especially useful to say “use Model A for Coding and Model B for Language” when performance across those domains is so closely tied to general performance. Individual tasks can still differ: Plot Unscrambling and Typos, for example, are more closely related than the general factor alone predicts. But LCB Generation and Coding Completion do not show much extra association, despite both involving coding. The distinctions worth paying attention to seem to lie with particular tasks, not the broad category labels.
Appendix
Classical Parallel Analysis
Flagged-item audit
Looking at the flagged items, along with items that have constant scores across models:
Typos
- For the item with ID prefix
832610e9, the scoring key says “algebraical” should be changed to “algebraic”. However, “algebraical” is a valid word listed in the Oxford English Dictionary. Of the 77 archived model answers I can check, 45 were scored wrong, and 19 of those retained “algebraical”. Among these models, crediting those otherwise-valid answers raises the item–Typos correlation from +.07 to +.52. - For the item with ID prefix
0becbf34, “behavour” can be corrected to either the US “behavior” or the UK “behaviour”, but only the US spelling was accepted. Of the 77 archived answers I can check, 74 were scored wrong, and 3 of those used the UK spelling. Among these models, crediting those answers raises the item–Typos correlation from +.19 to +.35. - The other six Typos items I was able to check showed no issues.
- I can’t audit 12 flagged Typos items. The public release has their scores but neither their prompts and keys nor archived answers.
LCB Generation
- The “Wrong Answer” item is simple: given $A$ and $B$, the program should print any digit from 0 to 9 except $A+B$. For the input
2 5, both0and2are valid, but the stored test expects one specific output, such as2. A valid program that prints0therefore fails. Despite the item’s simplicity, all 159 judged models received zero. Among the 76 with archived answers, 34 have at least one well-formatted program that prints a digit other than the sum. The current item–task correlation is undefined; crediting these 34 apparently valid archived programs results in a correlation of +.56. - “Takahashi Quest” has another fixed-output grading issue. All 178 judged models scored zero, making the current item–task correlation undefined. Among models with archived answers, crediting the 34 apparently valid programs results in a correlation of +.24.
- “Bad Juice” is an interactive problem, but it was not evaluated with an interactive judge. A correct program first prints how it will distribute the bottles among the minimum number of friends, reads the judge’s reply about which friends became sick, and then prints the spoiled bottle. LiveBench instead supplies one static input string,
3 1\n, and expects one fixed output transcript. It doesn’t provide replies tailored to each program’s printed groups. All 159 judged models scored zero. Under my provisional re-scoring of the archived answers, the item–task correlation becomes +.31, but I still cannot determine how many programs would pass a real interactive judge. - The other three LCB Generation items I was able to check showed no issues.
Coding Completion
- The two flagged items had correct answer keys and scoring.
Connections
- The two flagged items had correct answer keys and scoring.
Plot Unscrambling (No flagged items)
Paraphrase
- The three flagged items had correct answer keys and scoring.
Story Generation
- For the items with ID prefixes
0d828b10and6c5eb0ac, the prompt is somewhat contradictory. Models were given a news story and told to “Please generate a story based on the sentences provided. Answer with one of the following options: (‘My answer is yes.’, ‘My answer is no.’, ‘My answer is maybe.’)”. A typical prompt instead adds instructions such as “Entire output should be wrapped in JSON format. You can use markdown ticks such as ```.”, which modify the story’s format or content. Nonetheless, 91/97 models received full credit for0d828b10, and 93/97 received full credit for6c5eb0ac. This concerns me: among 77 archived answers per item, 34 and 31, respectively, consisted solely of a permitted phrase. Many models passed the mechanical check, but their scores did not reflect the story-writing request. - For the item with ID prefix
230fffb5, models were instructed to generate a story with fewer than 241 words and aP.P.Spostscript at the end. The checker counted\w+tokens, which can split hyphenated expressions andP.P.Sinto multiple “words” even when whitespace-based counting would count each as one. Of the 77 models with archived answers, 32 did not receive full credit, and 11 of those were affected by this word-count issue. The postscript check had a separate problem: three models putP.P.Sat the beginning of their answers but still received credit for that instruction; two received full item credit. Among models with archived answers, counting words by whitespace and requiringP.P.Sat the end raises the item–task correlation from +.08 to +.29. - The other flagged item had no scoring issue.
I can inspect archived answers for only a subset of items and models, so I cannot determine the full scope of these problems. Nonetheless, I’ve tried my best doing what I can do.
Initial Model Comparison
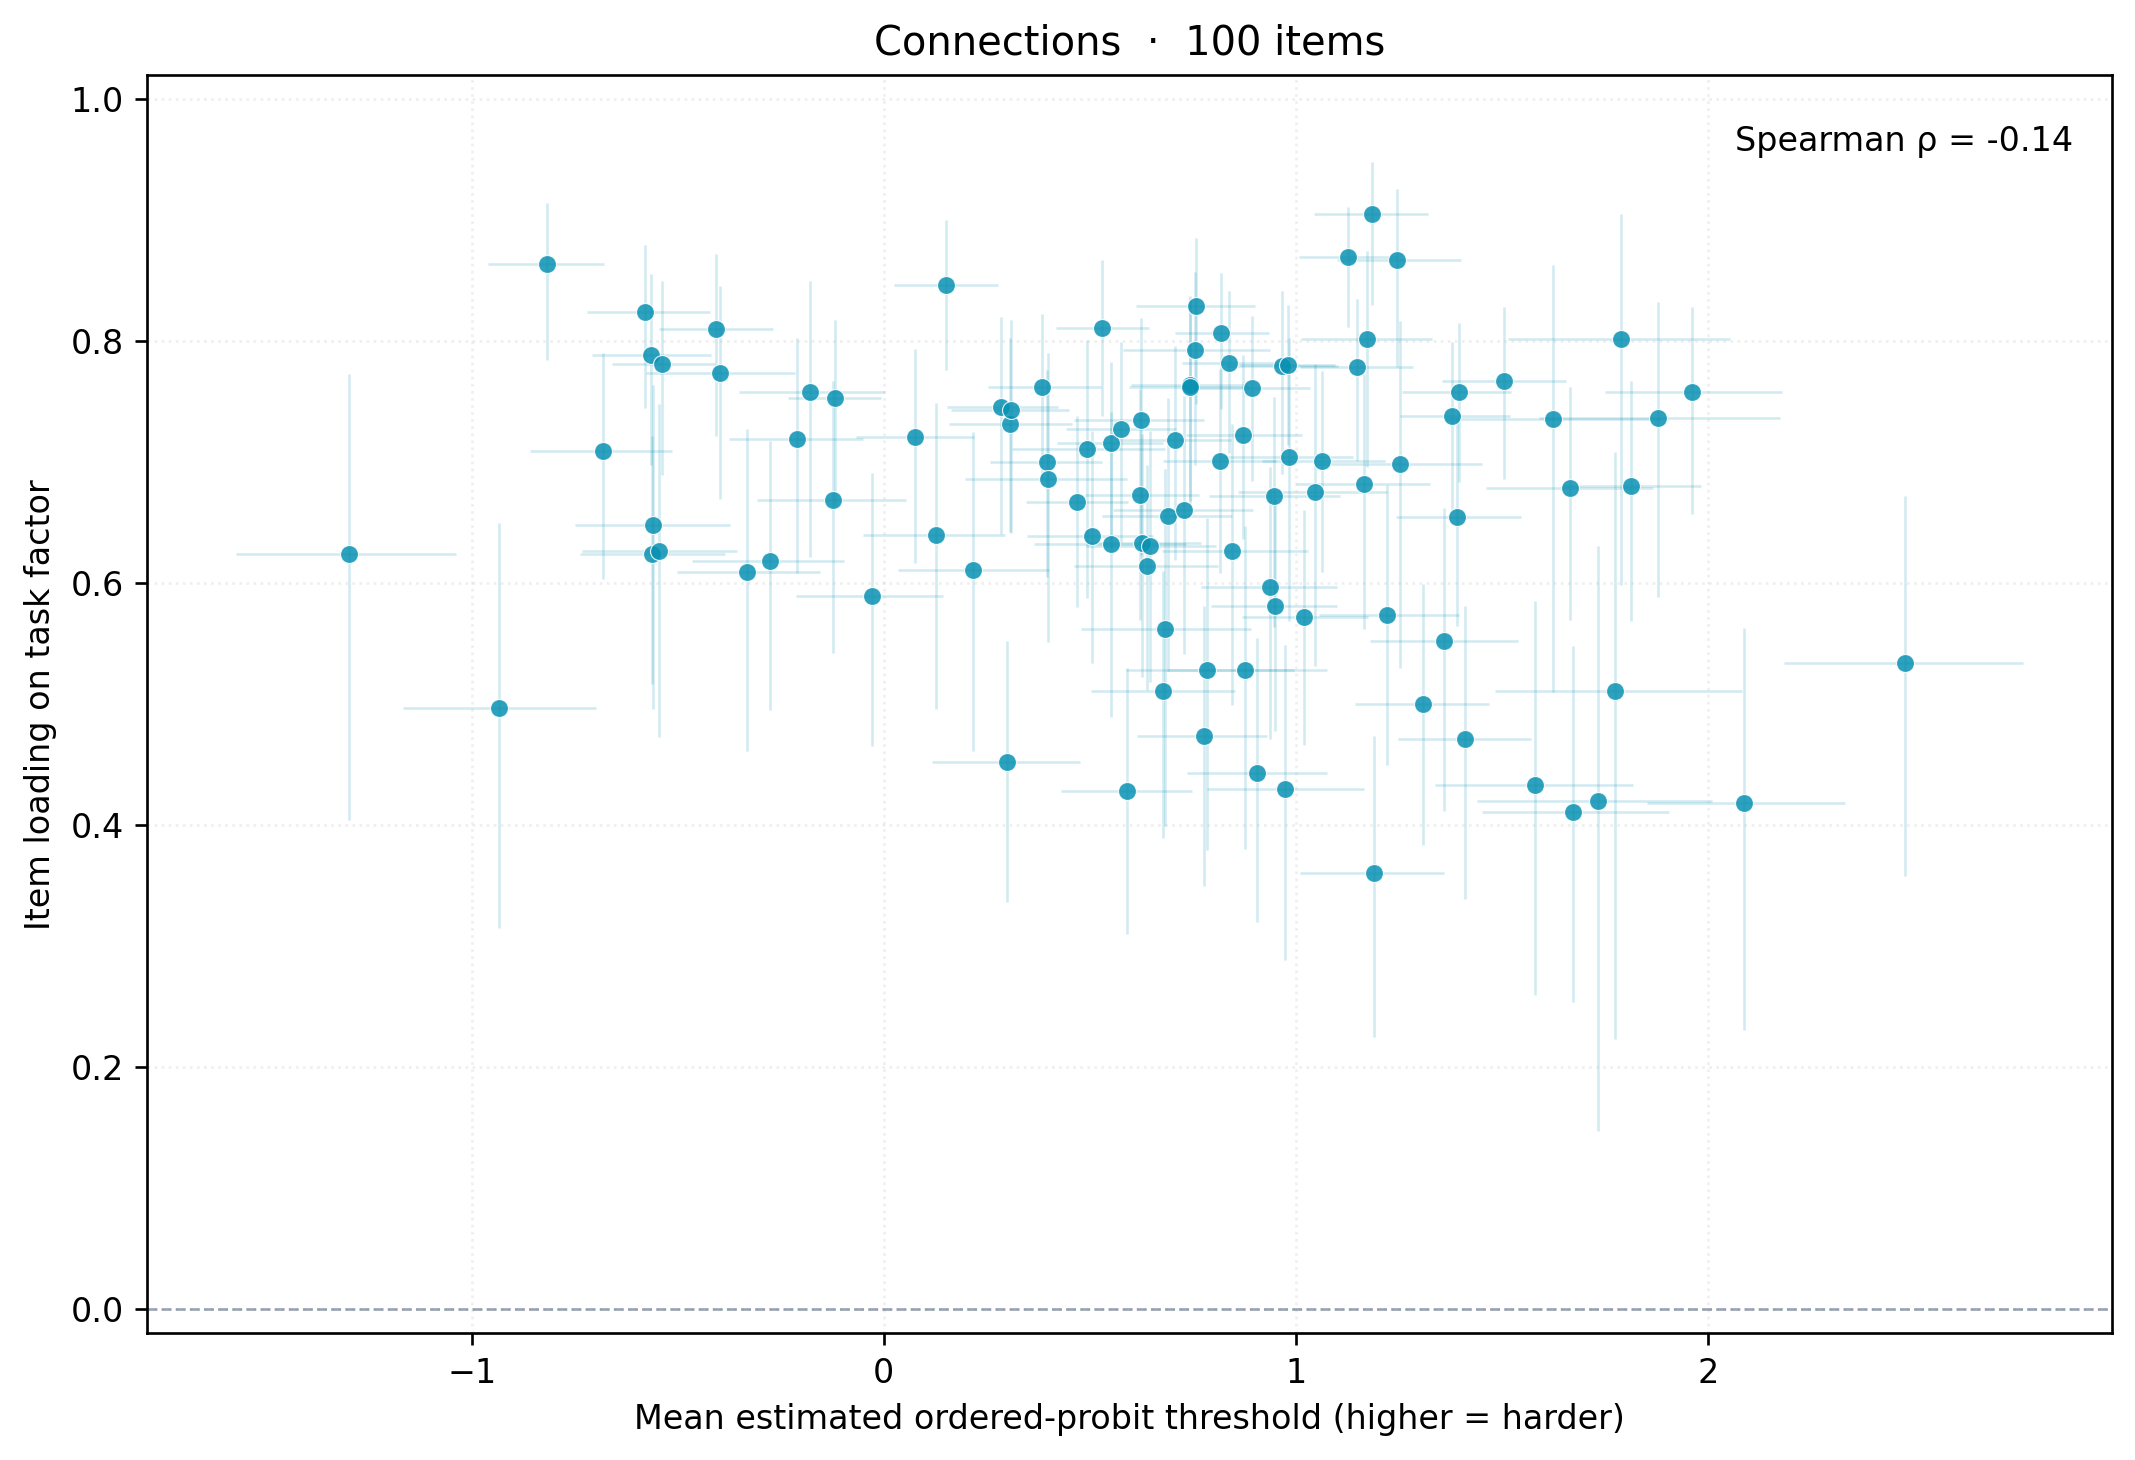
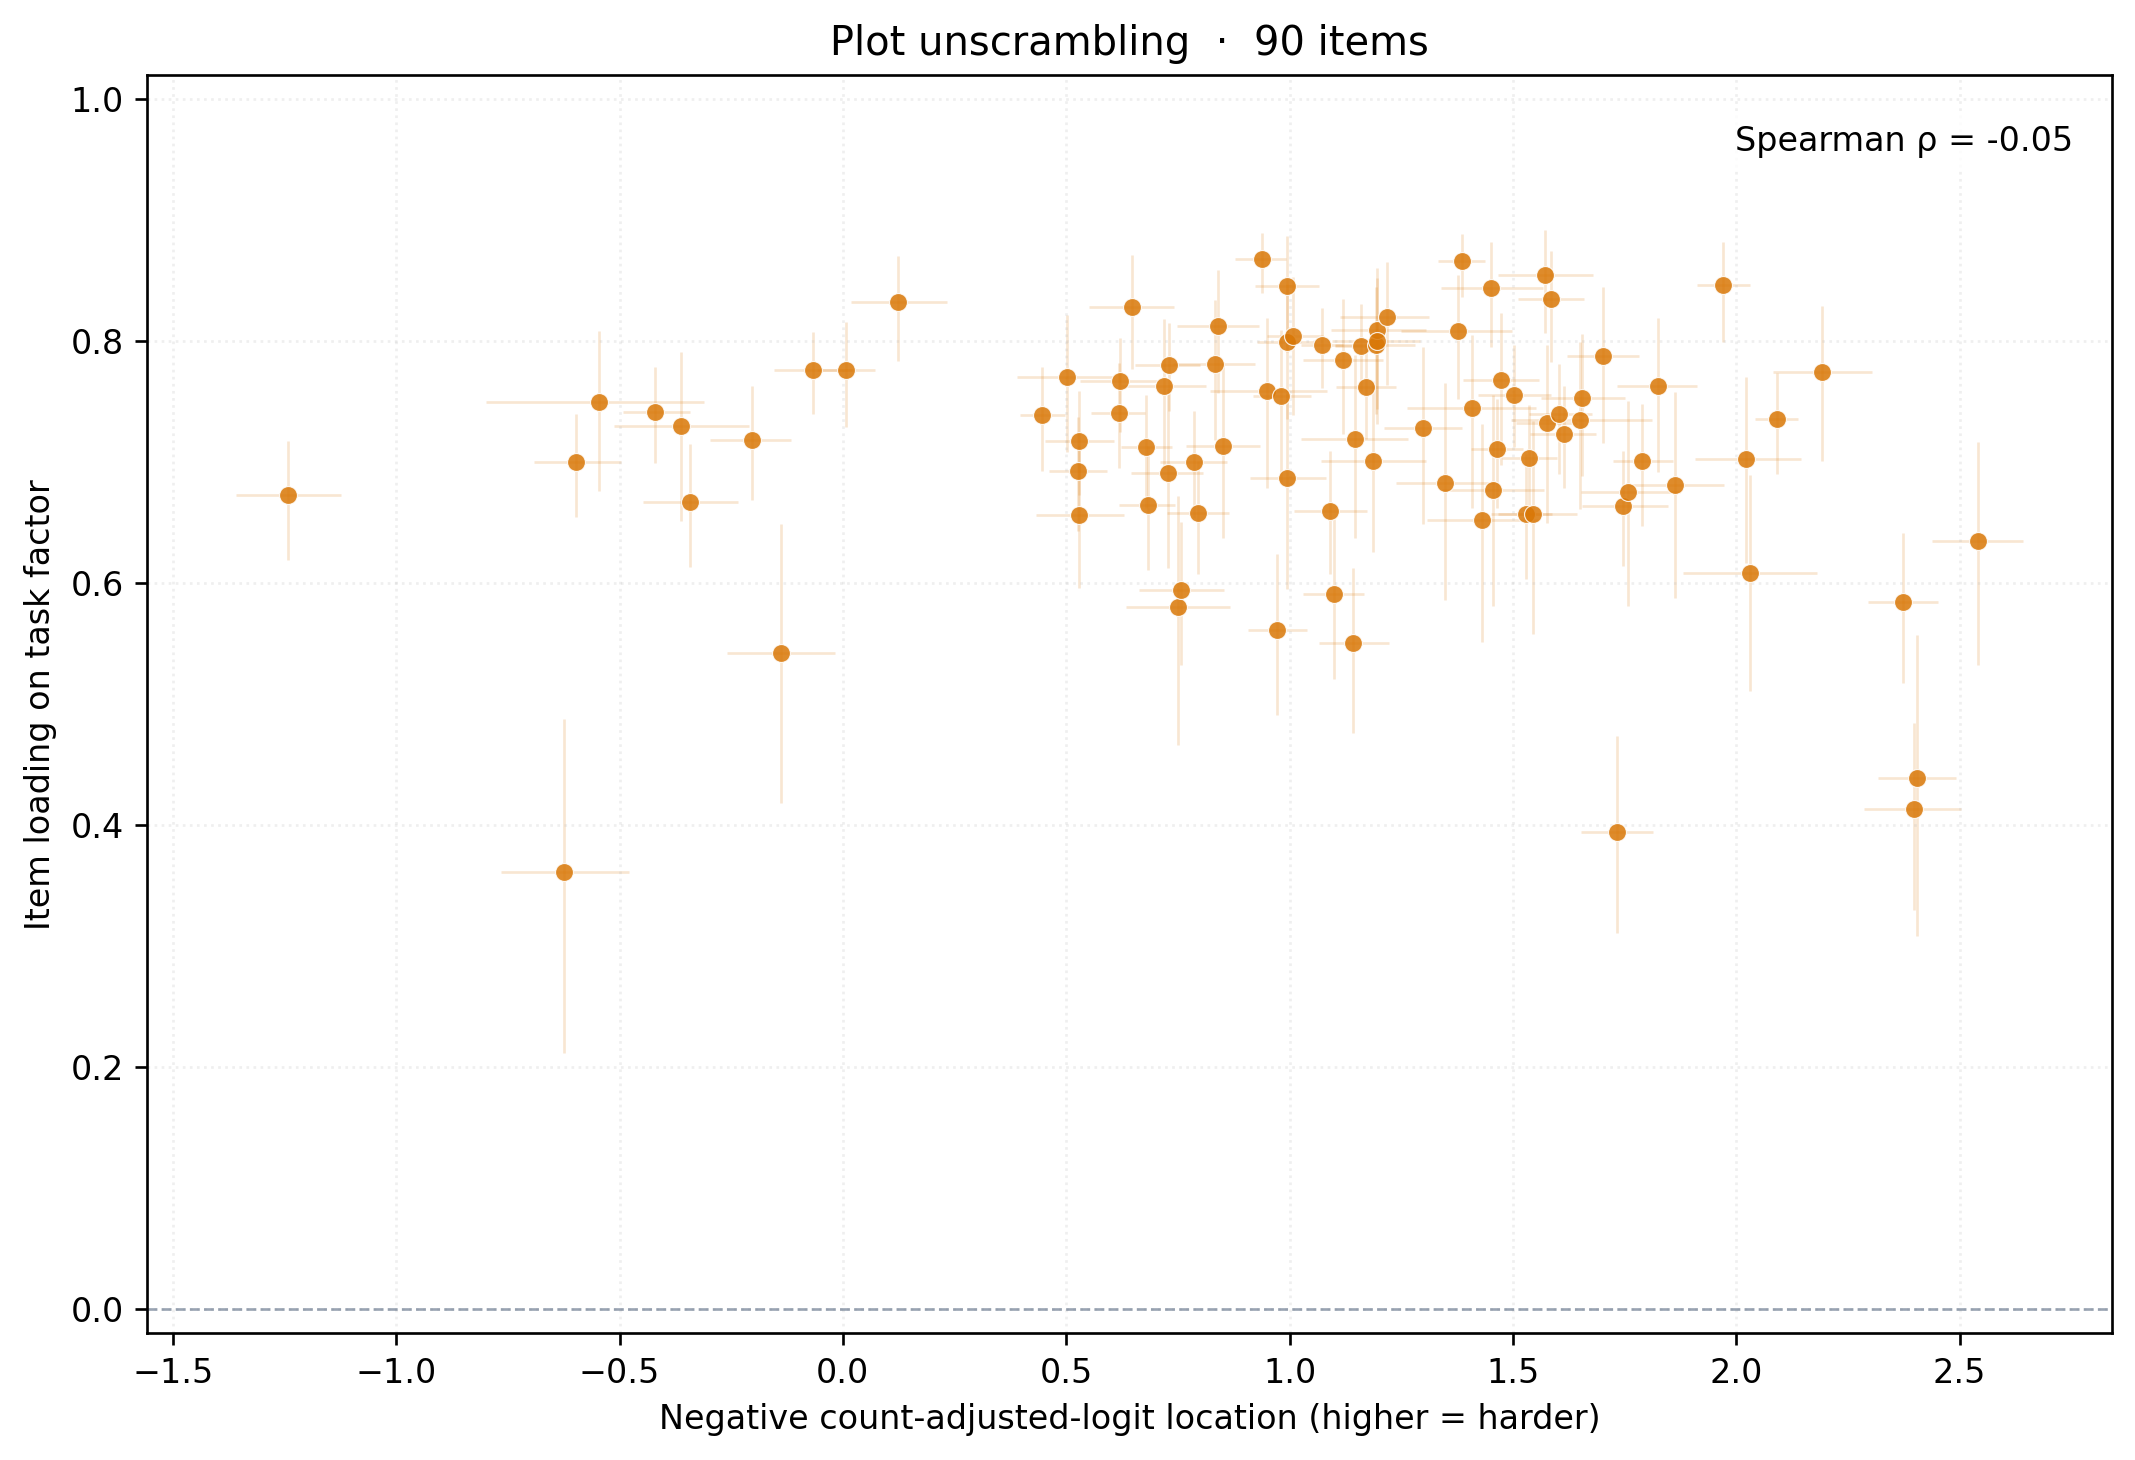
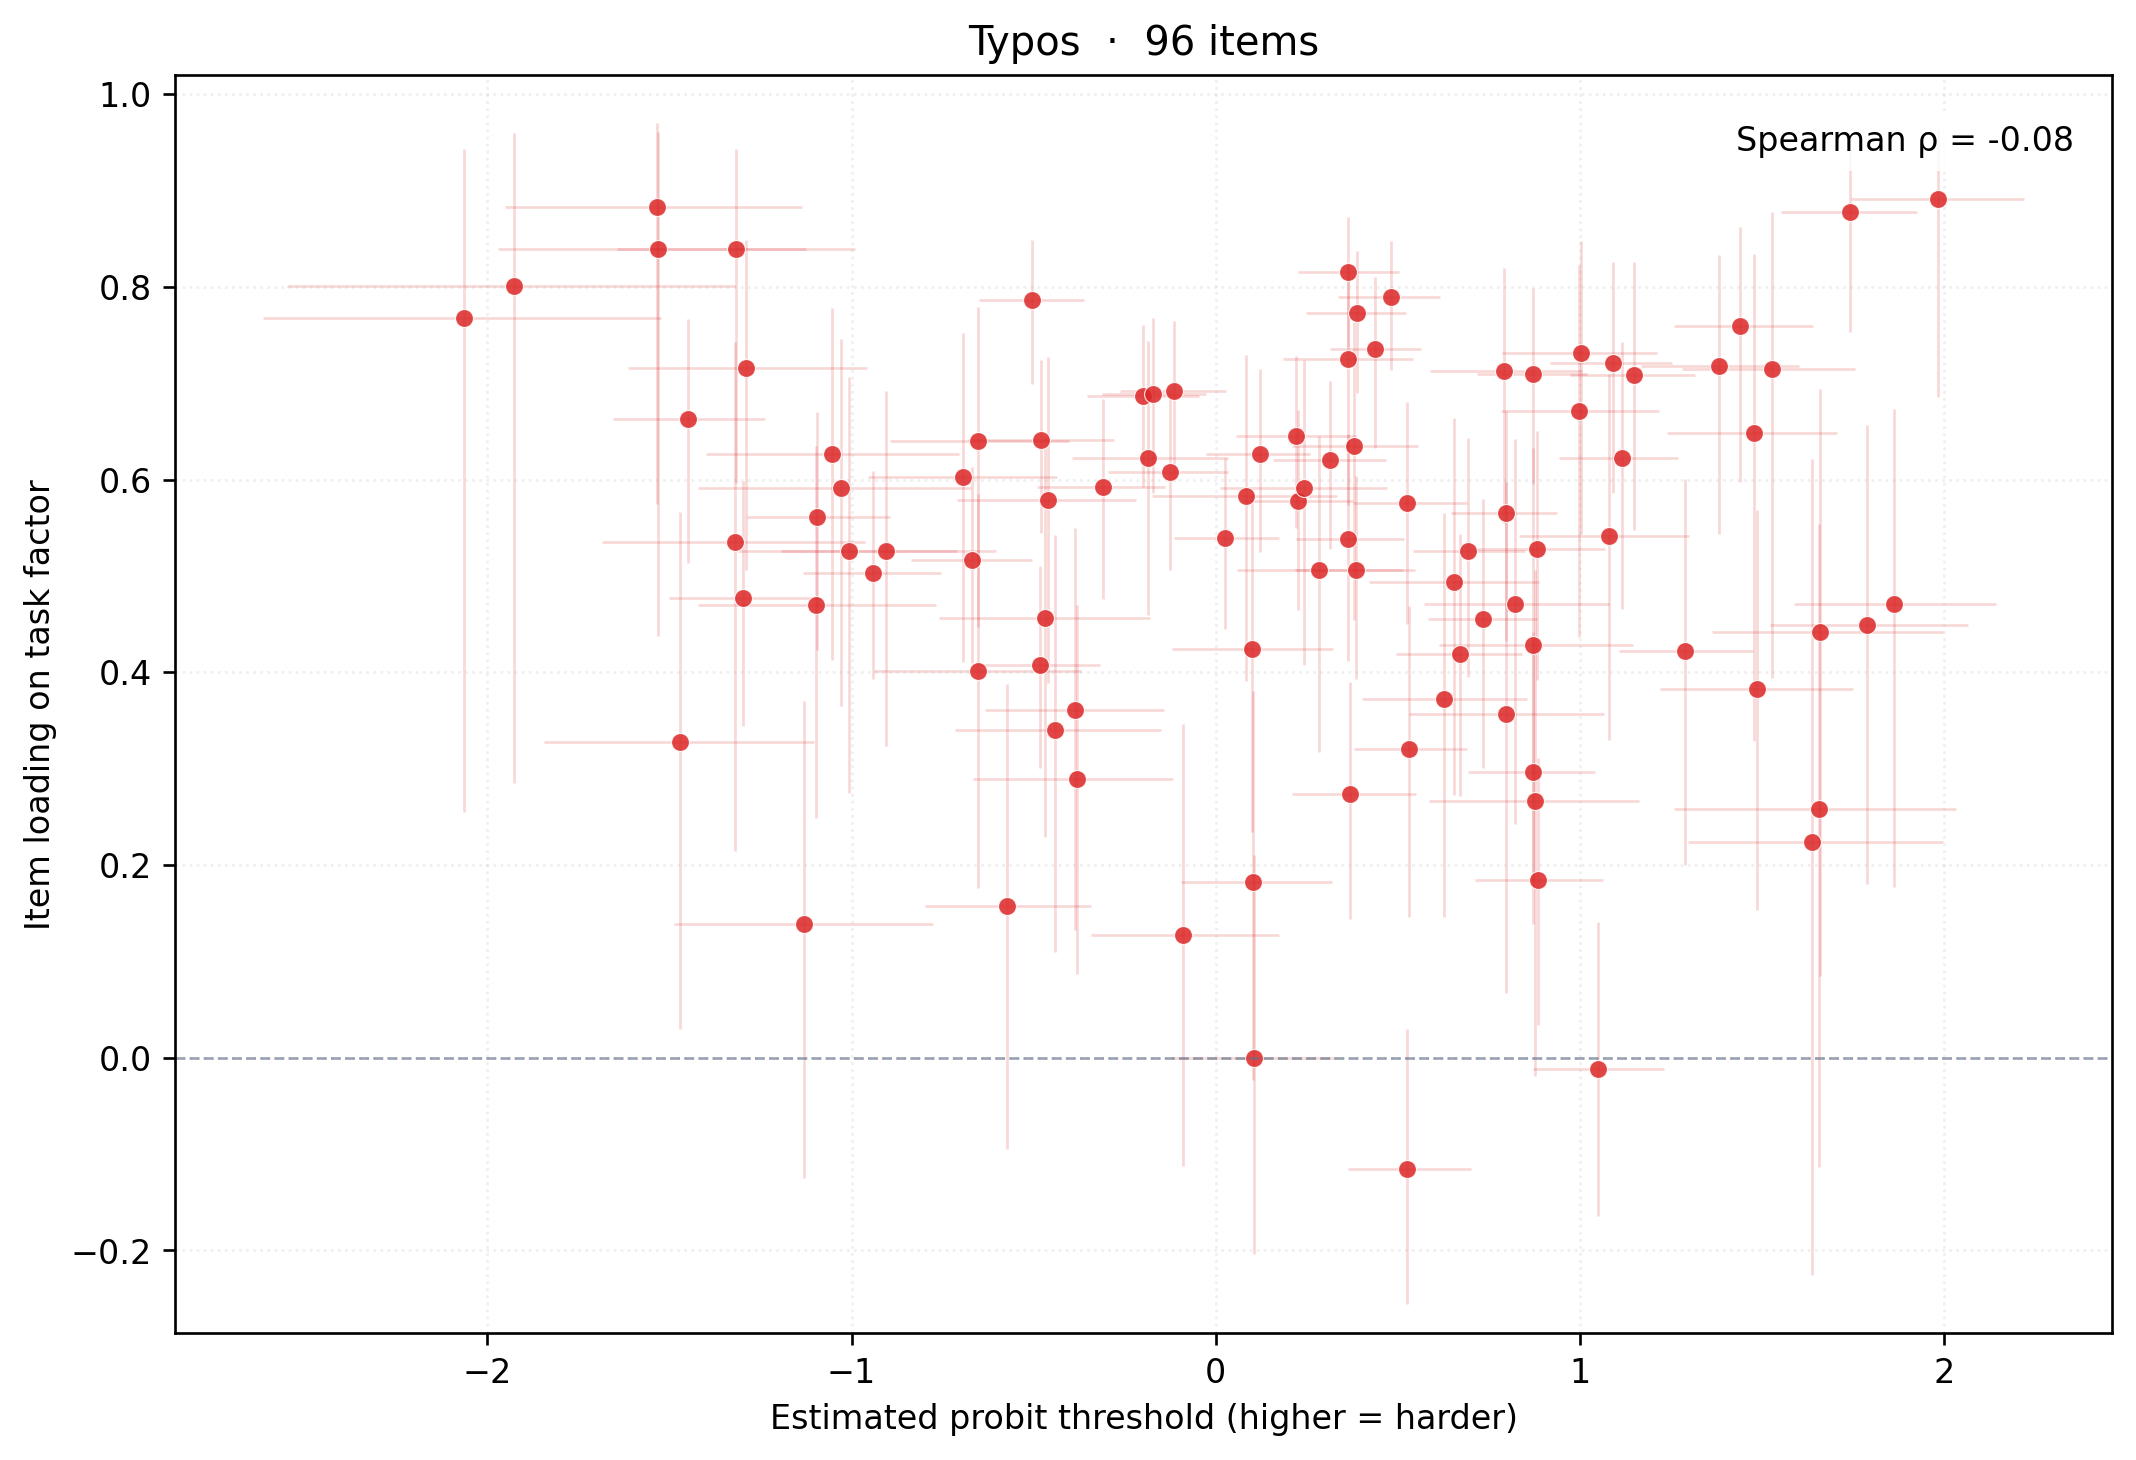
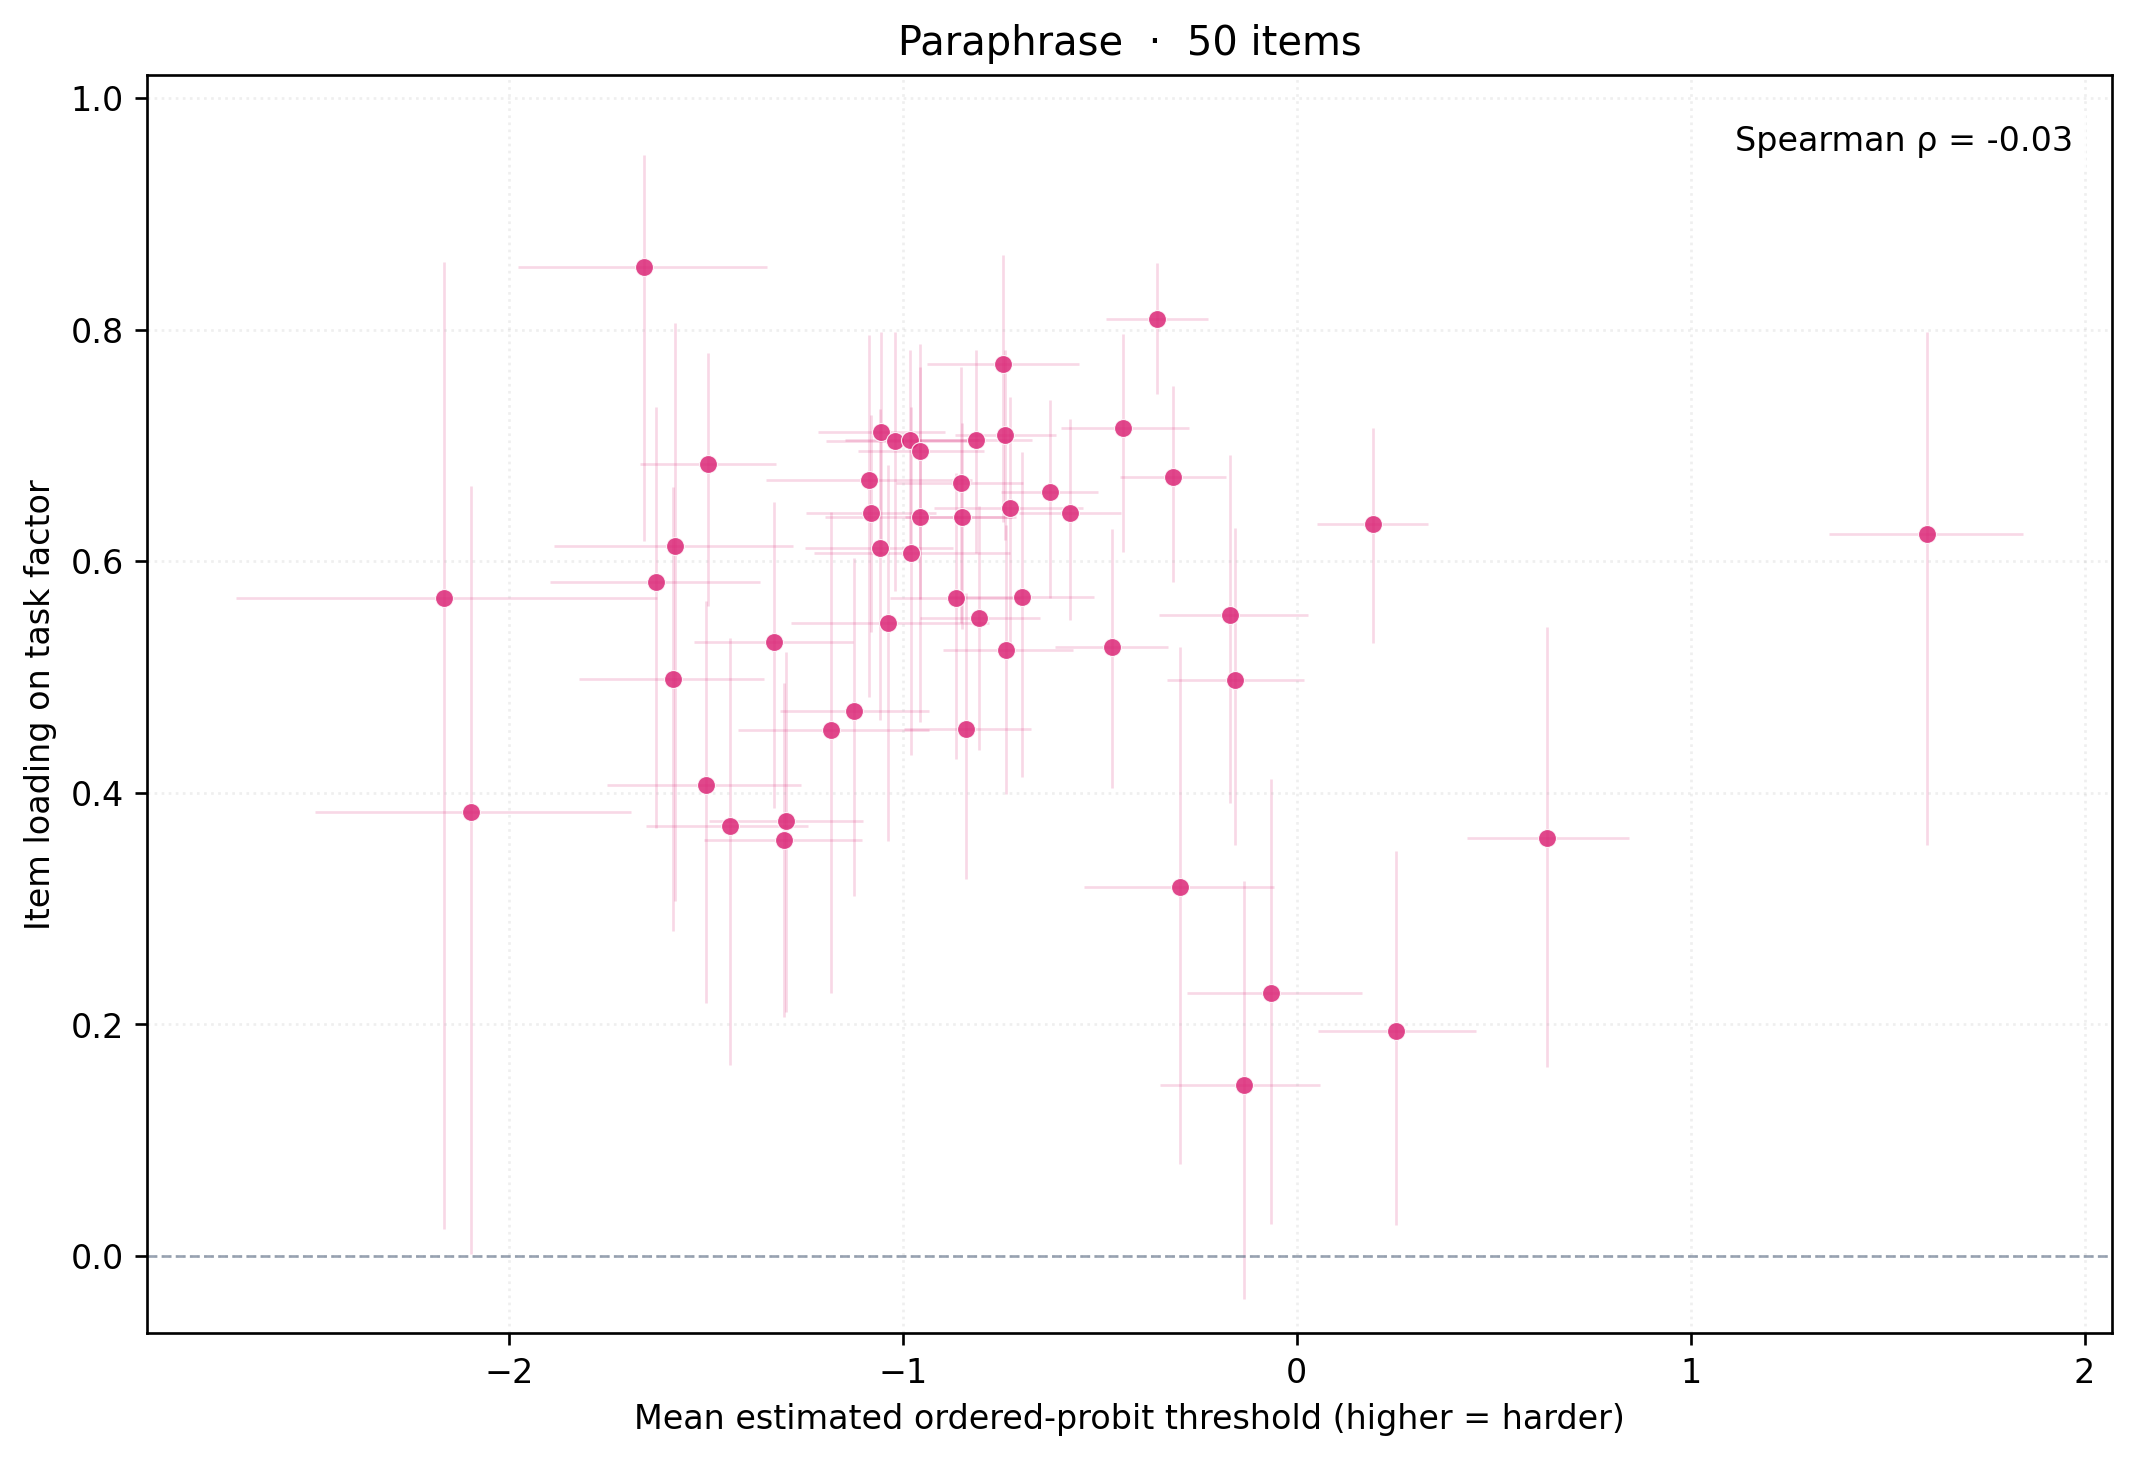
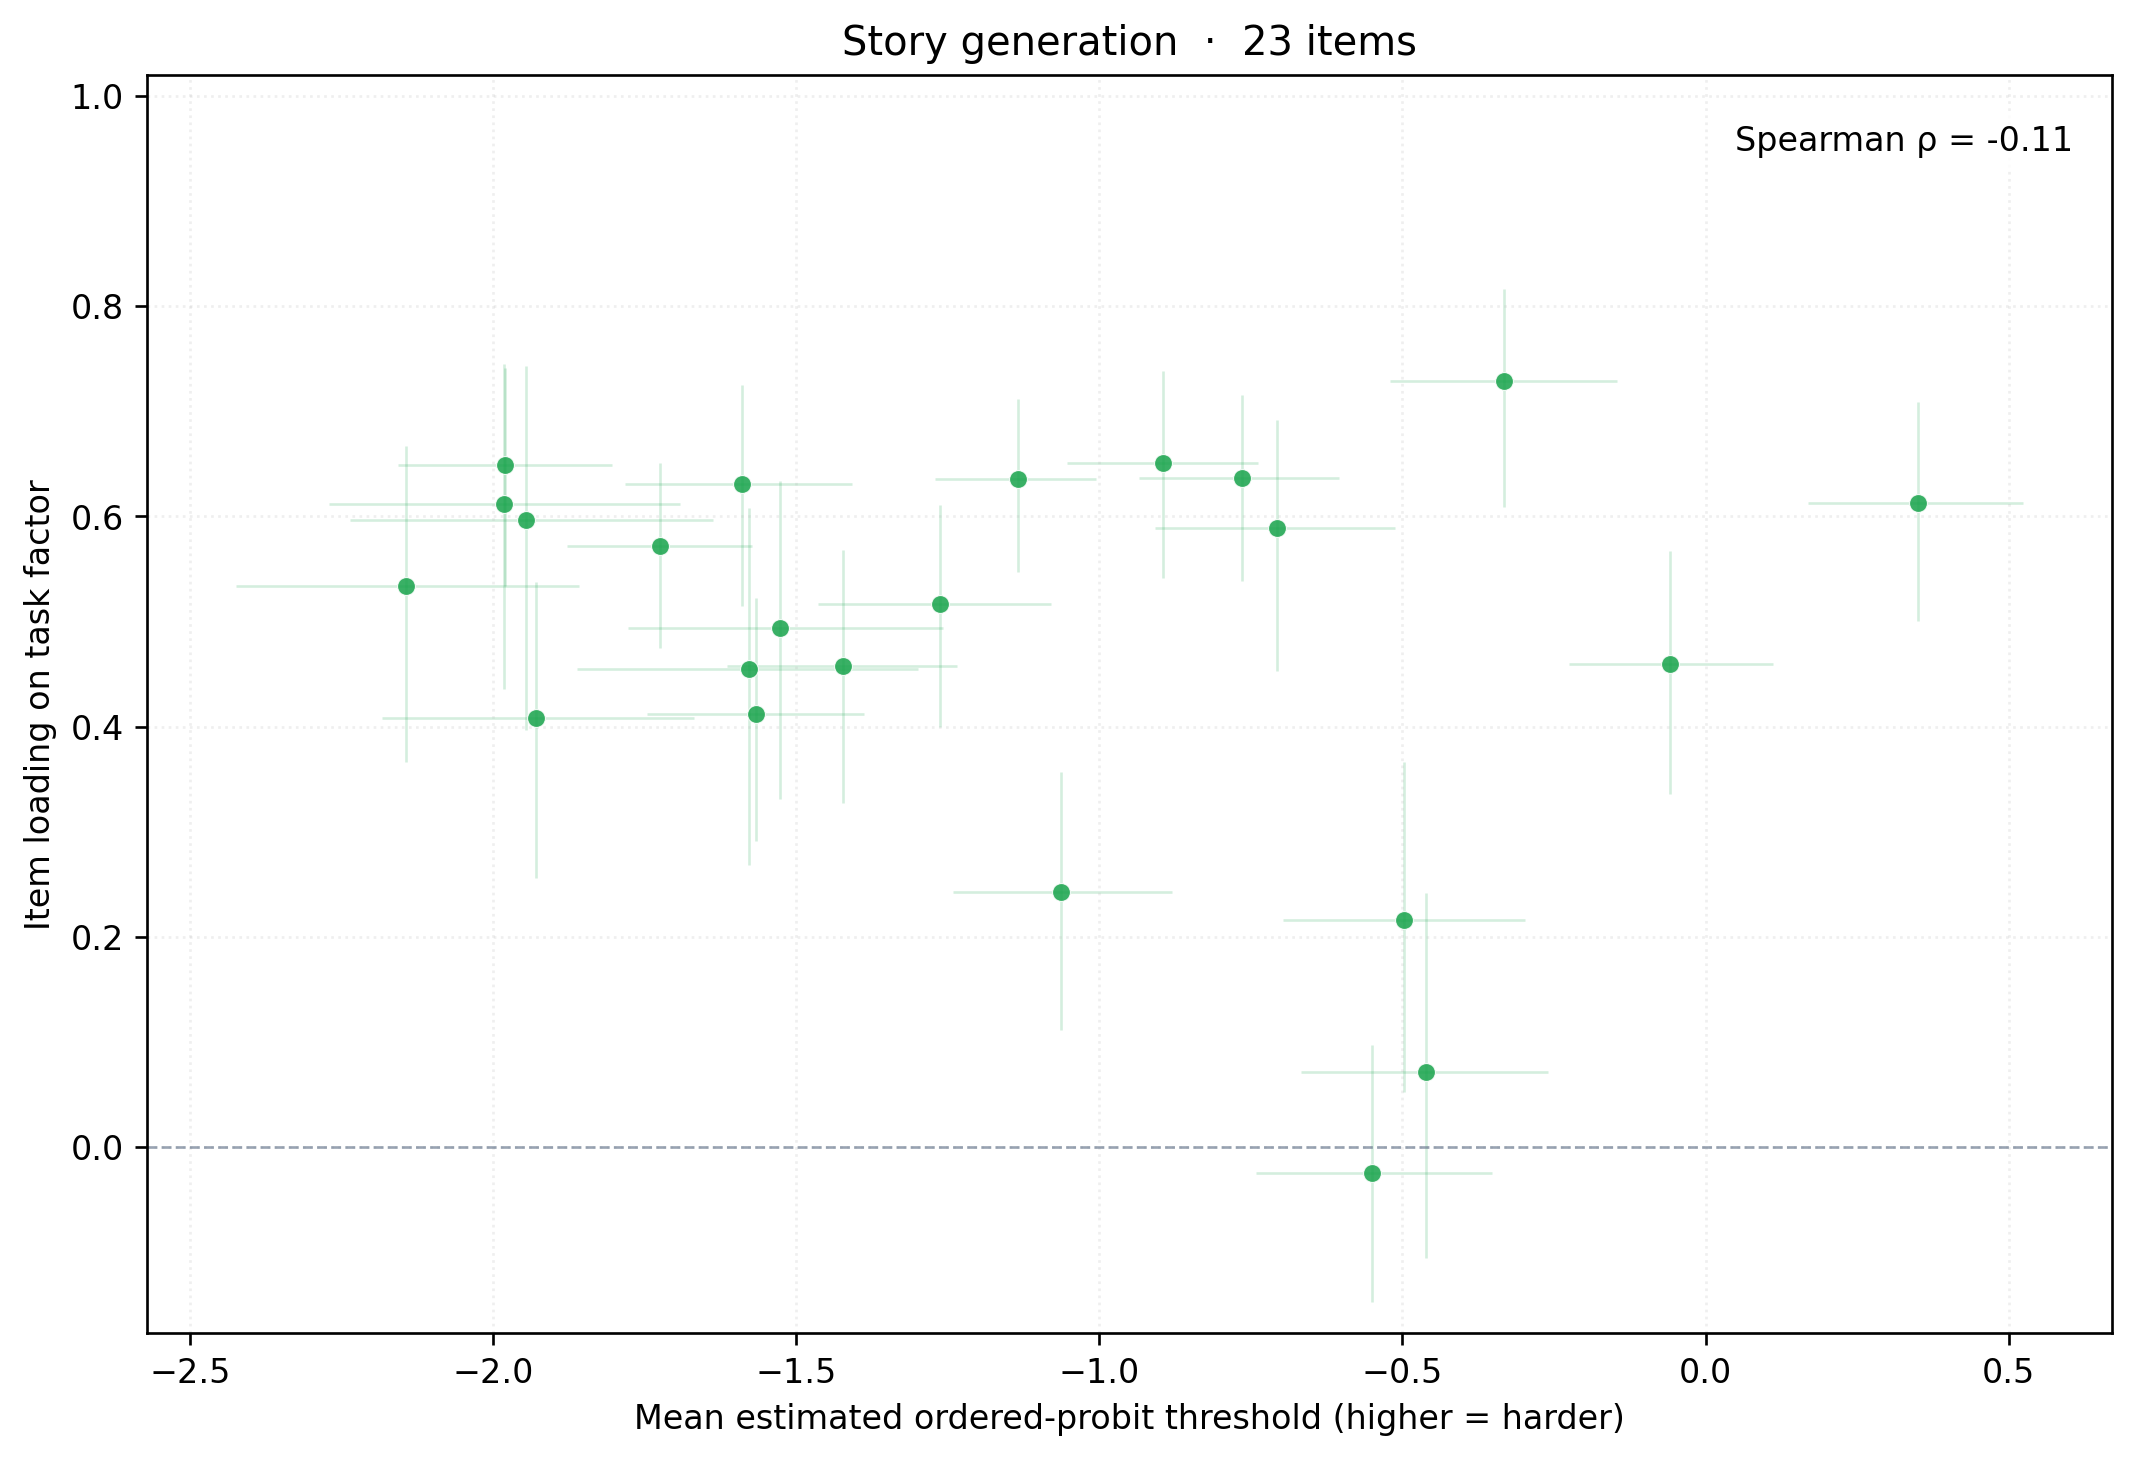
Loadings vs Difficulties
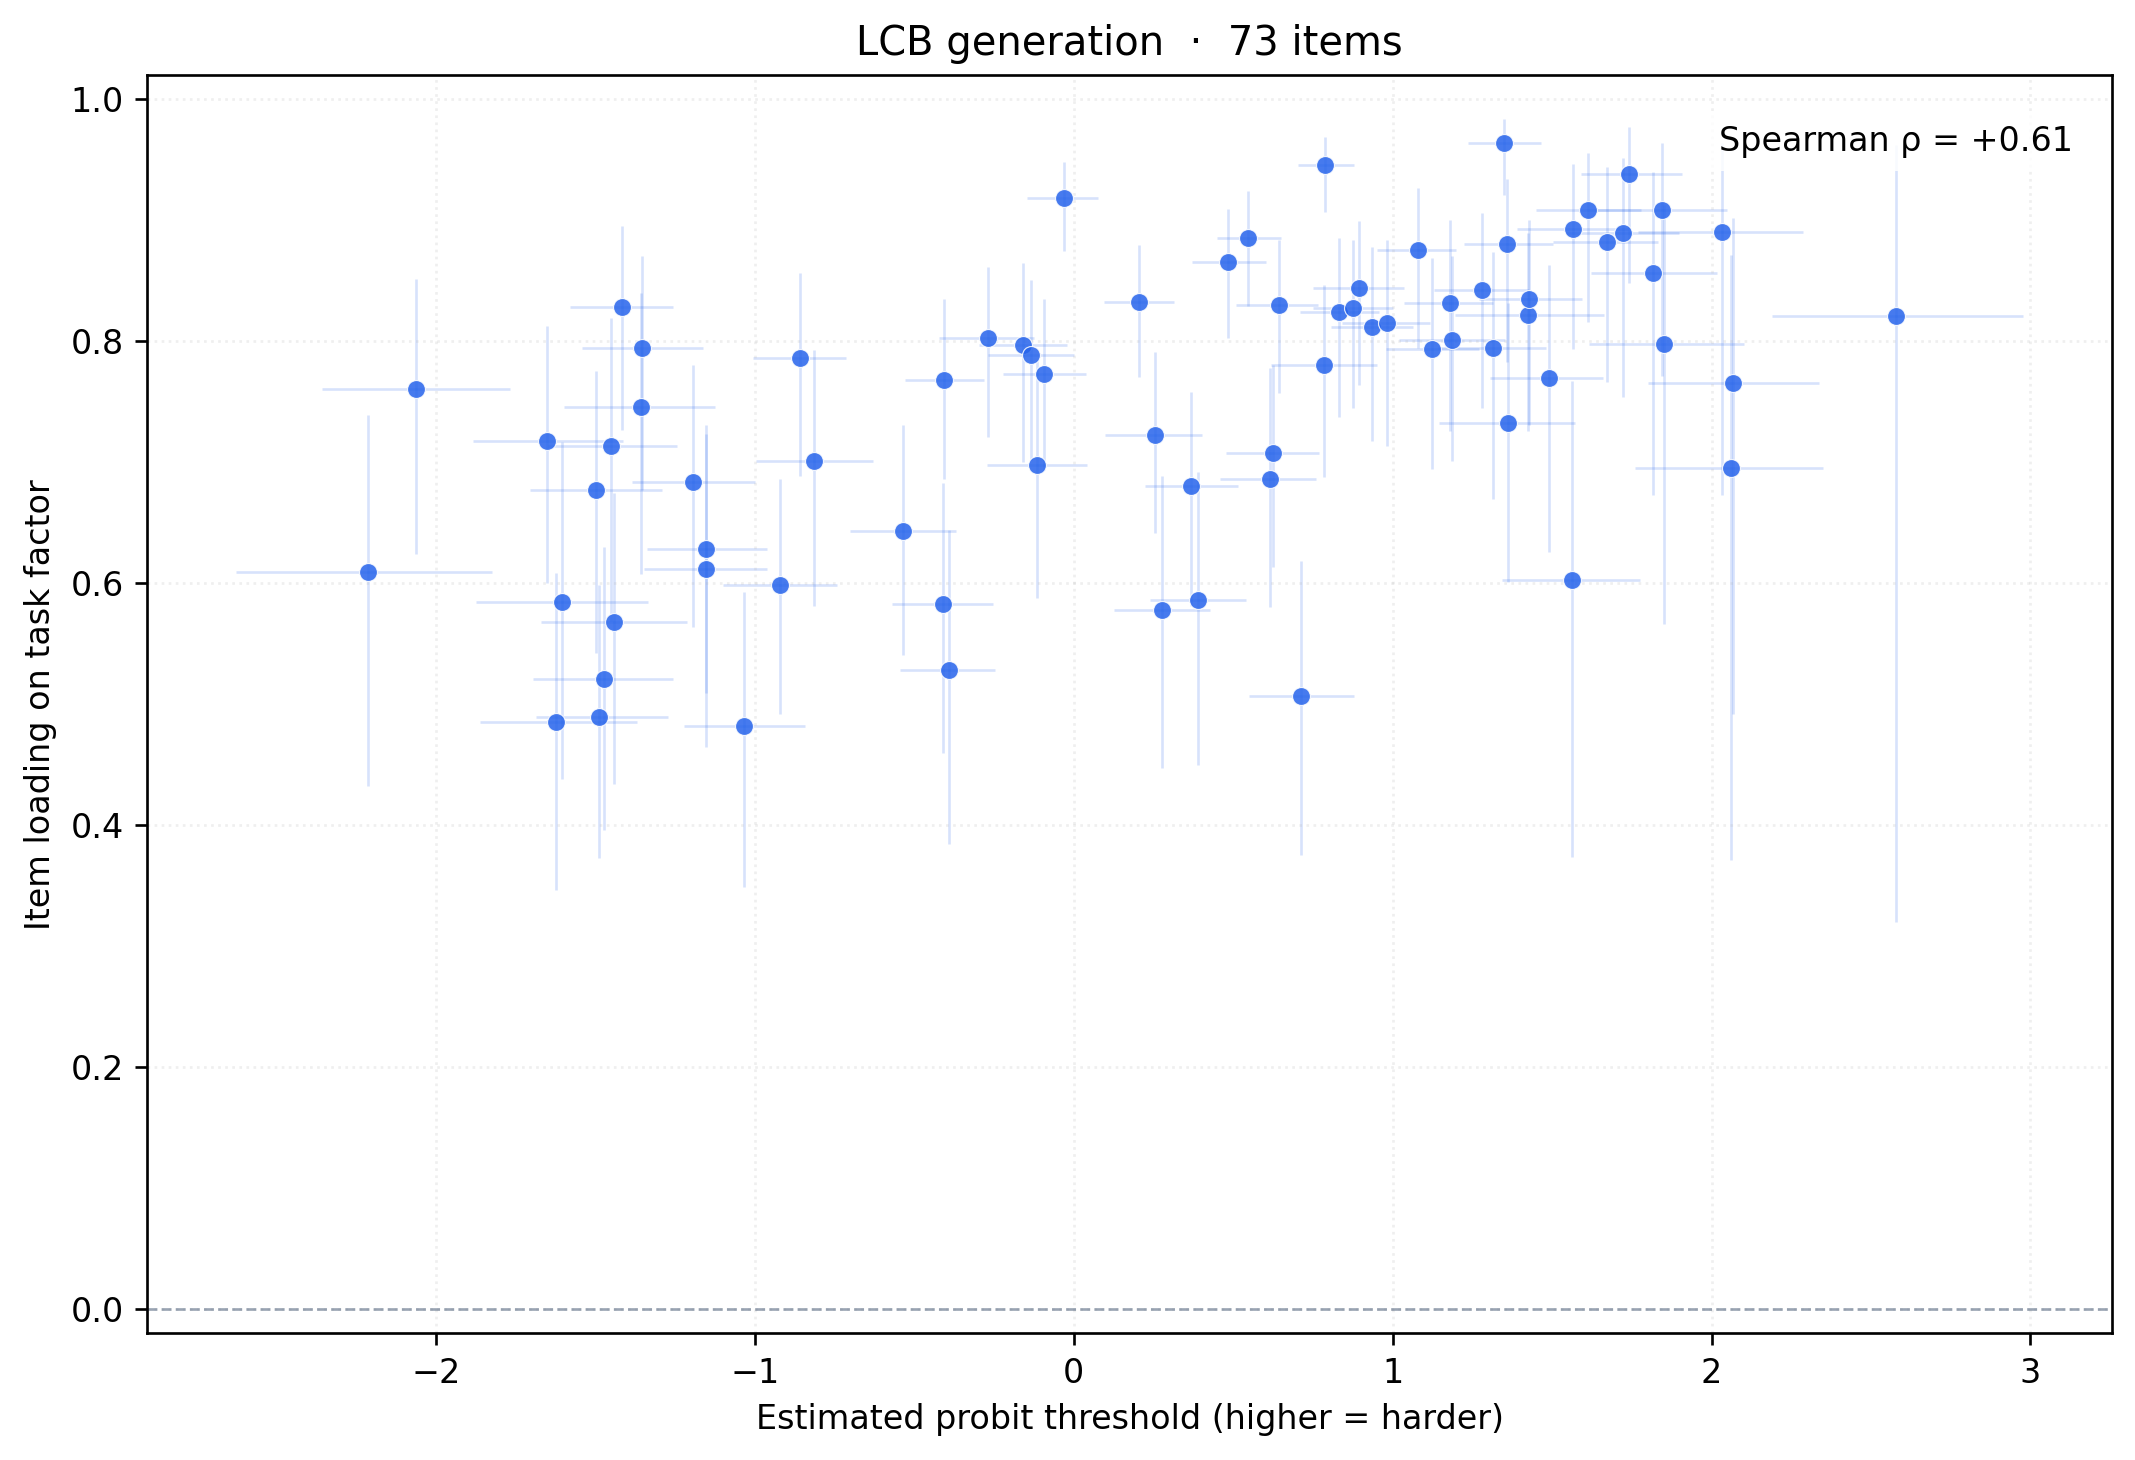
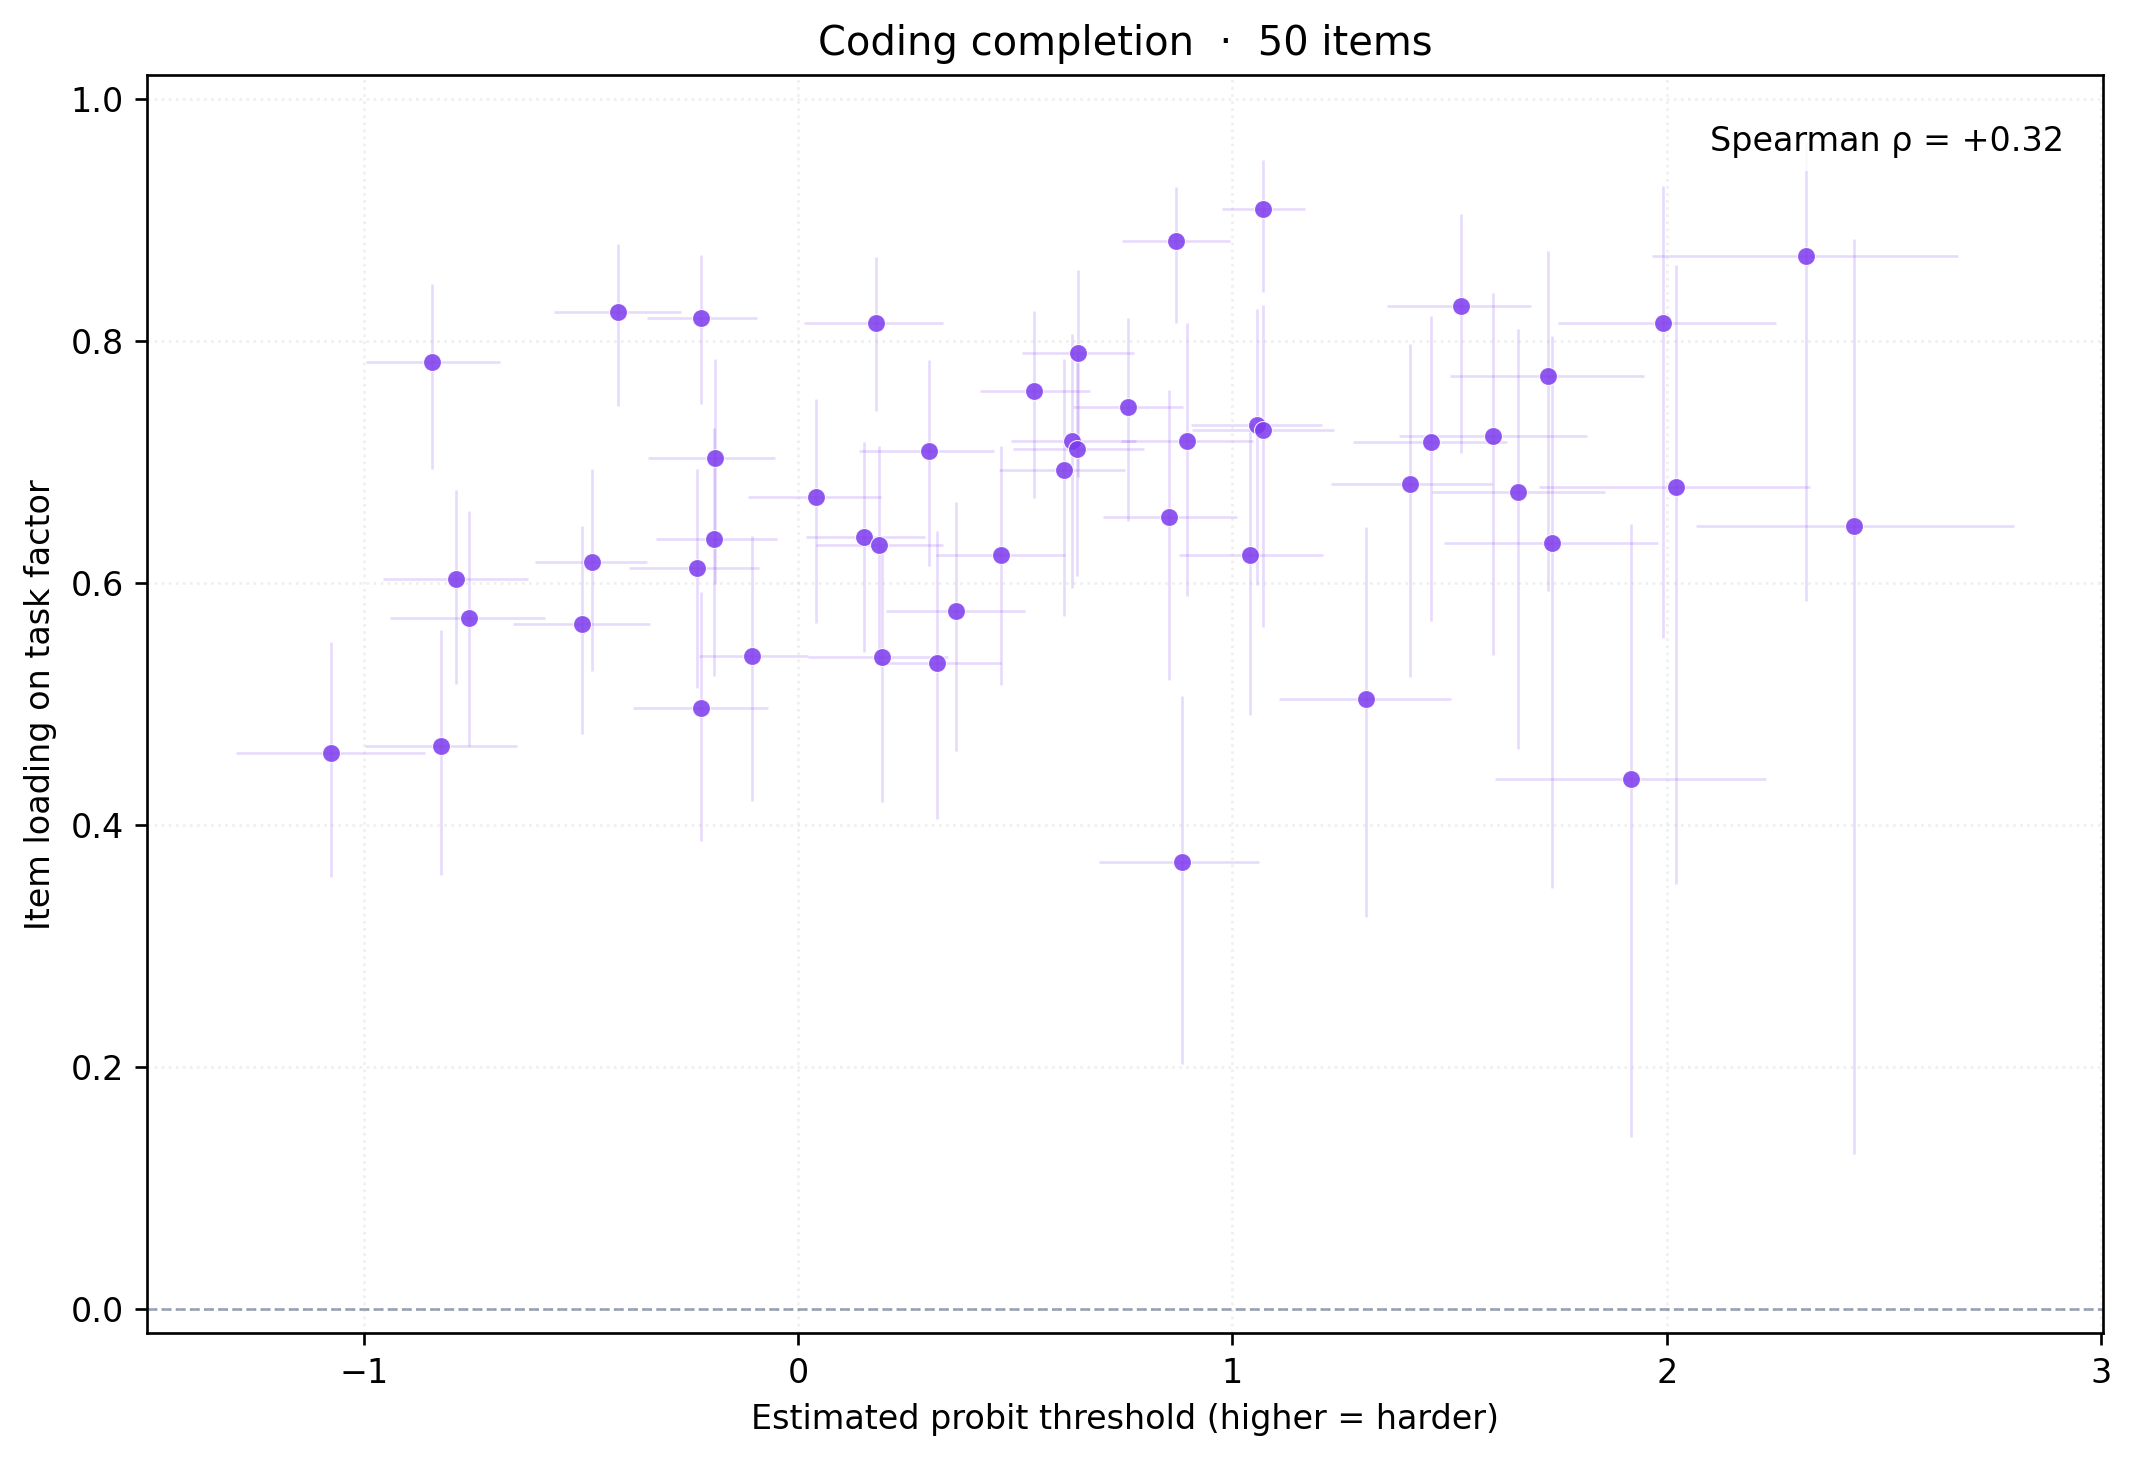
These plots place each item’s task-factor loading against its estimated difficulty in the selected hierarchical fit.
Choose a task, then select its plot for full size and 90% intervals. Difficulty uses a task-specific response scale, so compare horizontal positions only within a task.
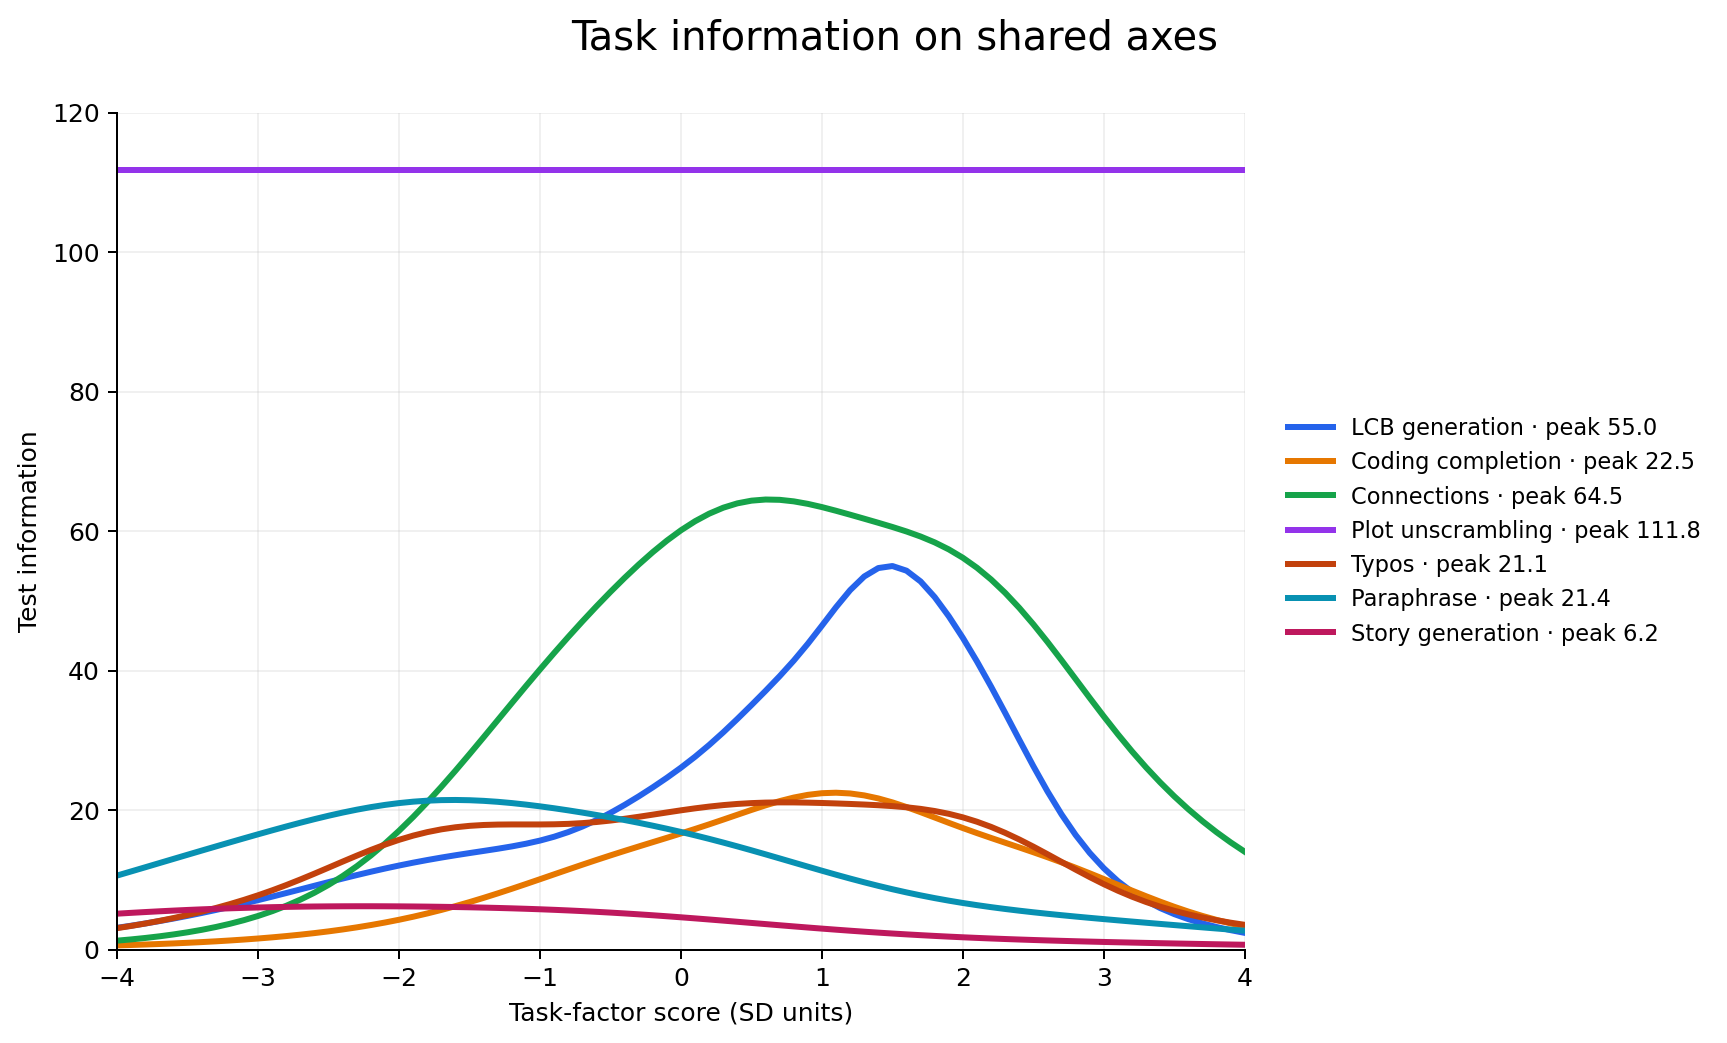
Task Information Curves
The seven task-factor information curves are overlaid on the same axes, so their heights are directly comparable.
Select a task or its curve to highlight it. Hover, focus, or tap a model marker for its name, median task score, 90% interval, and information at that score. The full-size plots also show individual item curves.
-
All values in the task-loading table are rounded to two decimal places. Coding Completion’s displayed 1.00 values are slightly below 1 before rounding. ↩
-
For this figure, I include ECI models with exactly one distinct model version in their benchmark records and ECI scores dated no later than April 7, 2025. I match version names to LiveBench after ignoring case and punctuation, but not version numbers or words. If several LiveBench runs match the same ECI model, I use the one with the most item responses. This leaves 38 ECI models before task-specific response requirements. ↩