How to Spot Suspicious Questions in AI Benchmarks
AI benchmarks have a problem: lots of the questions are scored incorrectly. Sometimes the answer key selects the wrong answer as correct, sometimes the question is literally impossible and there is no correct answer, and sometimes there’s more than one correct answer. Obviously, this makes measuring AI progress harder. We might think models are plateauing when really they’ve hit the benchmark’s ceiling and many of the remaining items are incorrectly scored, ambiguous, or otherwise flawed.
For example, in September 2026, GPT-5.6-Sol scored a 47.3% mean@4 on the Physics section of Humanity’s Last Exam. However, when researchers audited questions models repeatedly got wrong, they discovered that many of the questions were incorrect, ambiguous, or otherwise flawed. In many cases, the problem was with the question, not the model. After removing or repairing the flawed questions, GPT-5.6-Sol’s measured mean@4 increased from 47.3% to 78.7%.
How are we to avoid problems like these? Well, the basic idea behind benchmarks is to measure how capable AI models are and how much they know. As it turns out, there’s a field already dedicated to figuring out how to measure abilities and knowledge accurately in humans: psychometrics.
Psychometrics is especially pertinent because cognitive and achievement tests can be very important: they can determine what college one goes to, whether one is able to enter a profession they’ve spent years and hundreds of thousands of dollars preparing for, or inform education policies affecting millions of students. In short, these tests have an enormous effect on the lives of millions.
As such, it’s very important that these tests have correct items, measure the intended trait accurately, and are free of bias. Items undergo rigorous screening before they appear on an exam. I’m going to go through a few of the flags1 that psychometricians look at when deciding whether an item is suspicious and in need of a closer look: item discrimination, item difficulty, and distractor behavior. I’ll be looking at MMLU-Pro2. For each flag, I’ll look3 at some of the most extreme items it identifies, so we can see whether they really are bad items.
Discrimination
An item’s discrimination is the degree to which the item is able to distinguish between high-ability and low-ability respondents. There are a number of different measures we could use: the $a_i$ parameter from our fitted IRF, the point-biserial correlation between item correctness and total score, or the discrimination index, which is the difference in the proportion answering correctly between the top 27% and the bottom 27%.
Any of these being negative for an item is a bad sign: it means that less capable respondents are more likely to answer that specific item correctly than more capable respondents. That should make us wonder whether the indicated correct answer is actually correct, the question is ambiguous, or something else has gone wrong with the item.
But even positive, near-zero discriminations are suspect. For example, the SAT flags pretest items for review when their item-total score correlations are below 0.20, while the ACT generally expects items to have item-total correlations of at least 0.20. PISA flags items when their IRT discrimination parameter is below 0.1, while the MBE says that, for item selection, the discrimination index should at least be positive and preferably greater than 0.20. Such low discriminations indicate that item correctness barely changes with ability, which is still a problem. Is an item really measuring ability if more capable respondents are barely more likely to answer it correctly? At the very least, something about the item warrants investigation. And even if nothing is technically wrong with it, there’s not much point in including an item that contributes almost nothing to distinguishing between more and less capable respondents. We’re just wasting time (and tokens).
When looking at discrimination in the IRT fit, instead of using a logistic model, I’ll be using a probit model and reporting the standardized loading. A common rule of thumb treats loadings with magnitudes below 0.3 as weak, so I’ll use loadings below 0.3 as a flag for review. Negative loadings are even more suspect: they mean that respondents become less likely to answer the item correctly as their ability increases.
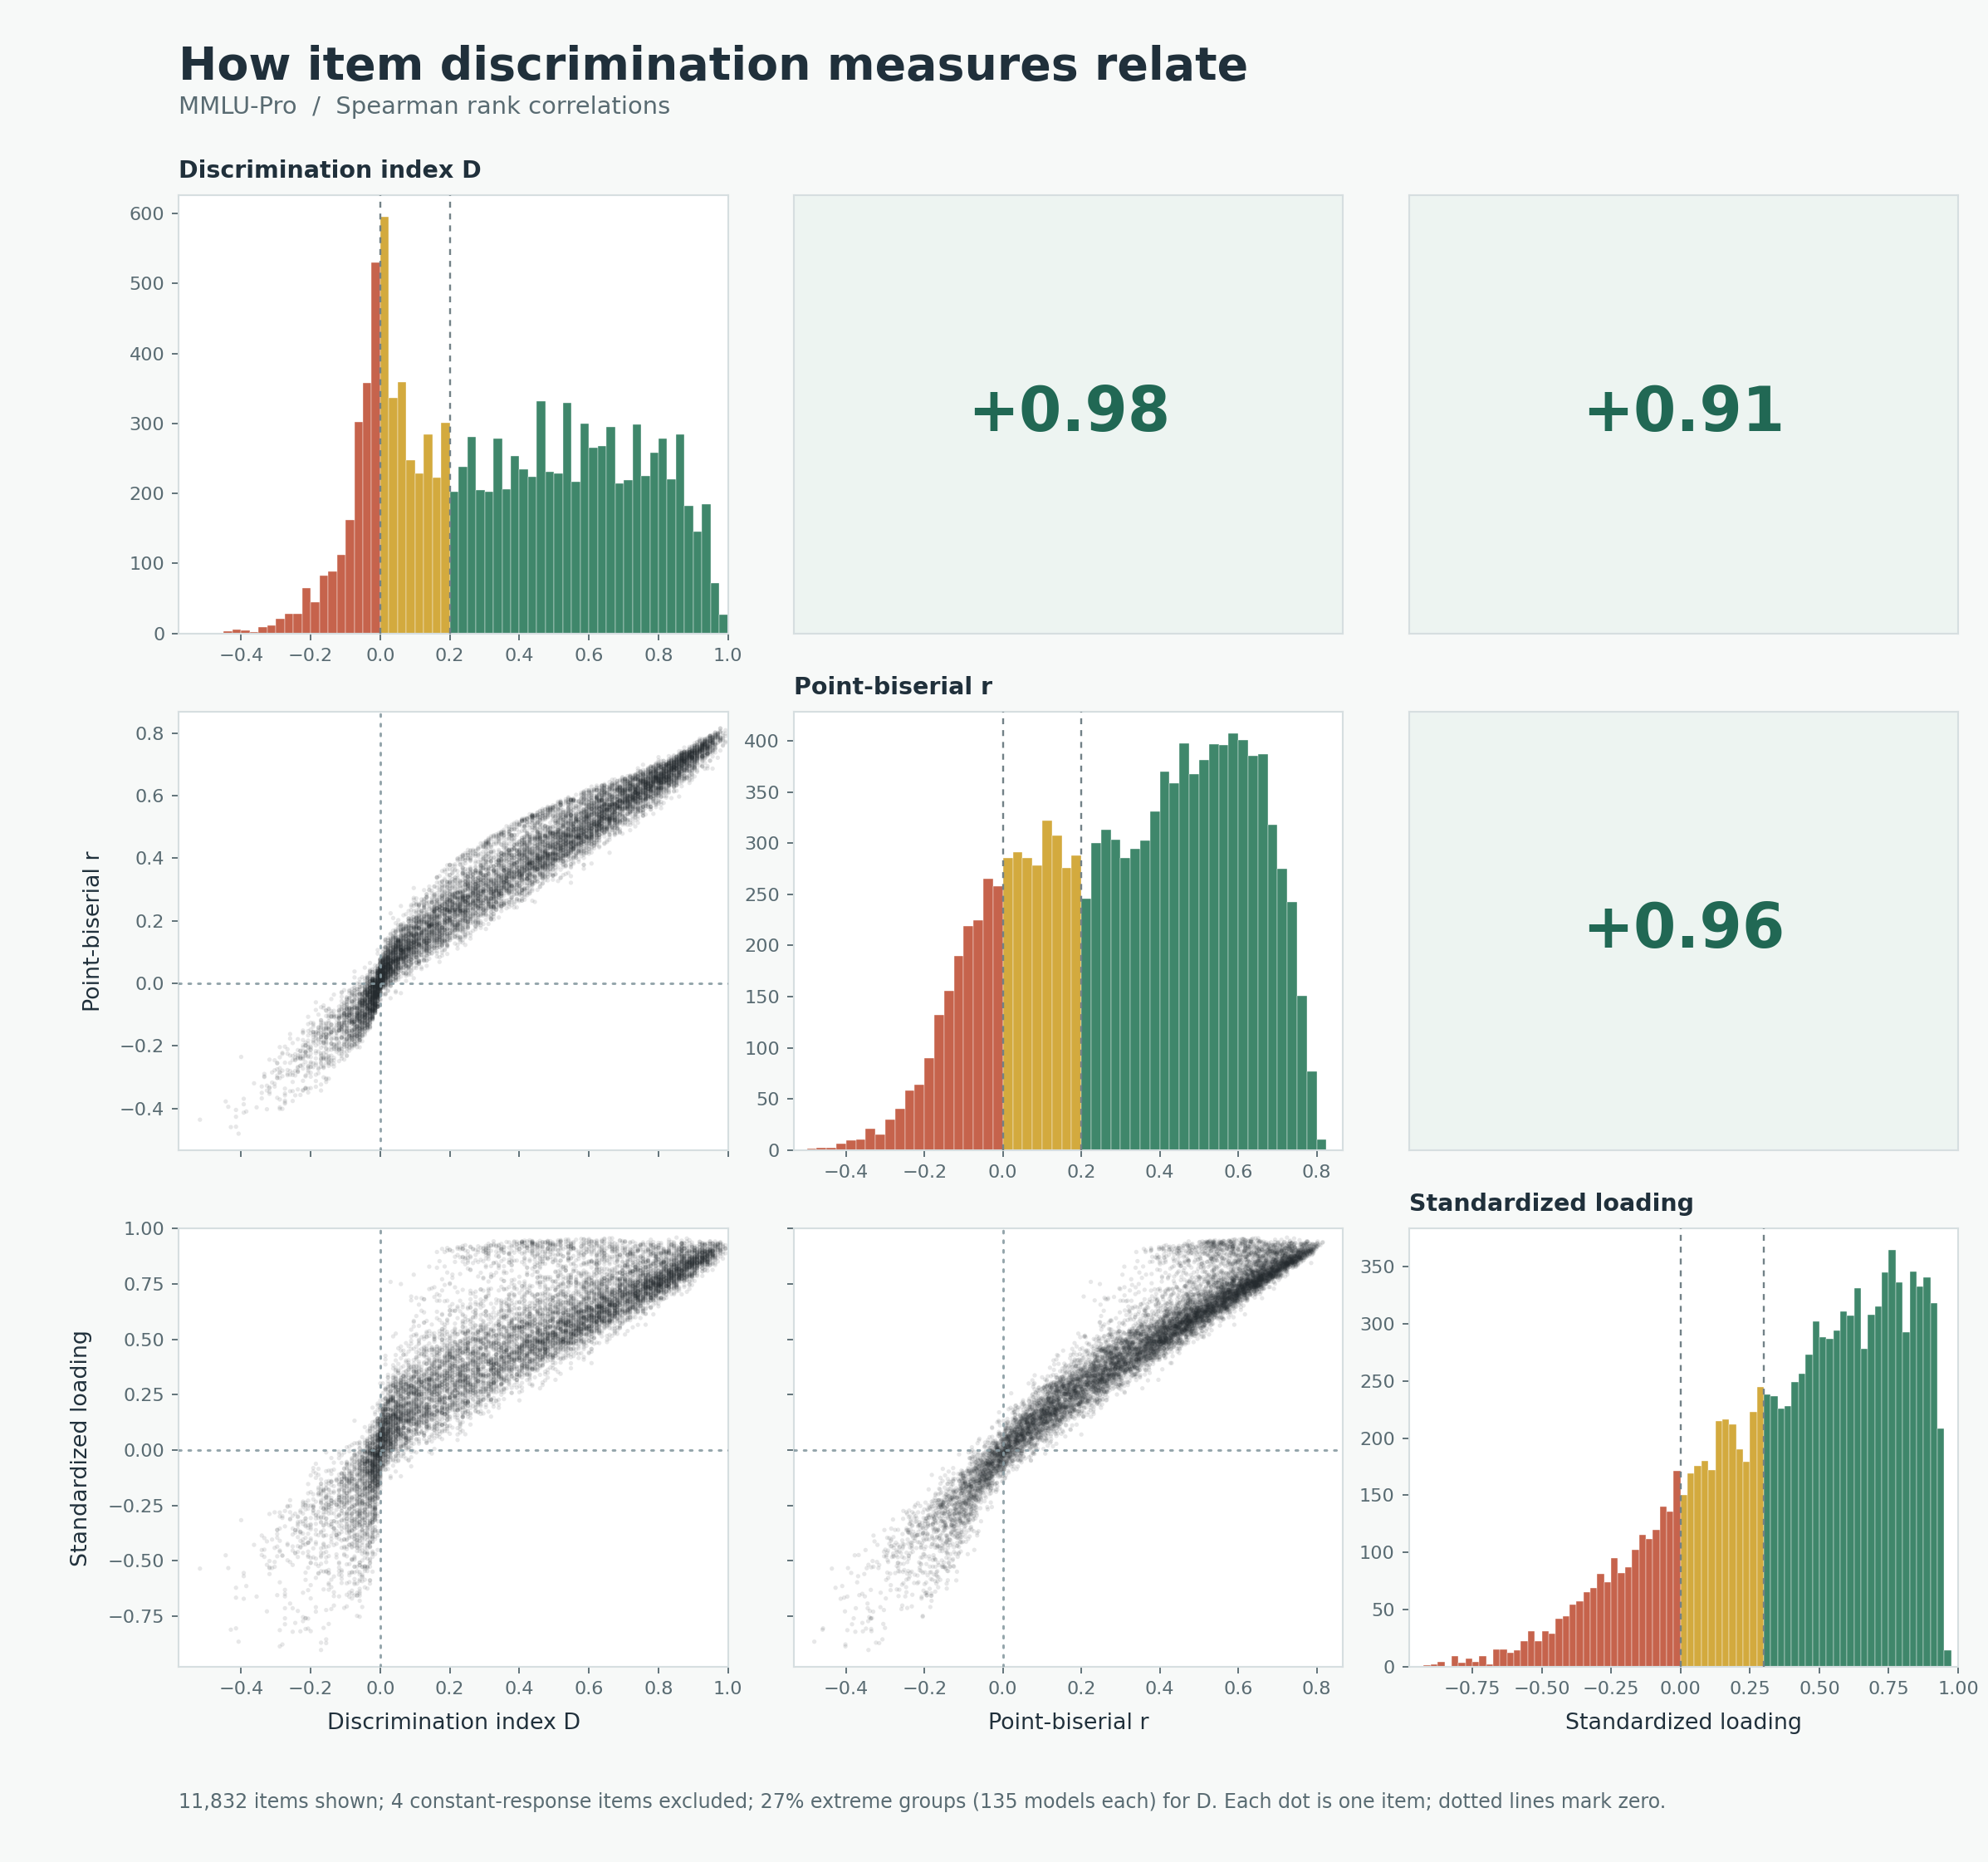
It looks like it doesn’t much matter which measure we use, since they’re all very correlated with each other. They also all agree that ~35% of the items should be flagged for review, indicated by the red and yellow, with ~15% having discriminations of the wrong sign, indicated by the red, and another ~20% merely having very weak discriminations, indicated by the yellow.
Now, let’s look at some of the items with the worst discriminations. We’ll use the item-total score correlation, since it has the highest average correlation with the other measures:
Question 8006
In one study half of a class were instructed to watch exactly 1 hour of television per day, the other half were told to watch 5 hours per day, and then their class grades were compared. In a second study students in a class responded to a questionnaire asking about their television usage and their class grades.
- A. The first study was an experiment without a control group, while the second was an observational study. [recorded key]
- B. Both studies were observational studies.
- C. The first study was a controlled experiment, while the second was an observational study.
- D. The first study was an observational study, while the second was an experiment without a control group.
- E. The first study was an experiment with a control group, while the second was an observational study.
- F. Both studies were controlled experiments.
- G. Both studies were experiments without control groups.
- H. The first study was an observational study, the second was neither an observational study nor a controlled experiment.
- I. The first study was a controlled experiment, while the second was neither an observational study nor a controlled experiment.
- J. The first study was an observational study, while the second was a controlled experiment.
While the fact that the second study is observational seems unambiguous, leaving only A, B, C, and E as our remaining options, what to call the first study is a bit trickier. The first study is obviously an experiment, eliminating B, but is it an experiment with or without a control group? In one sense, the first study does not have a control group, since both groups are assigned some amount of TV exposure. In another sense, the 1-hour-of-TV-per-day group serves as an active control, allowing us to estimate the effect of an additional 4 hours of TV exposure per day. So both A and E could be said to be either correct or incorrect depending on what one means by a “control group”. Meanwhile, C is unambiguously a controlled experiment. The item hinges on ambiguous terminology rather than a substantive statistical distinction, and so this item would not pass review.
Question 7977
Find the smallest positive integer that leaves a remainder of 2 when divided by 3, a remainder of 3 when divided by 5, and a remainder of 1 when divided by 7.
- A. 8 [recorded key]
- B. 31
- C. 10
- D. 37
- E. 23
- F. 12
- G. 14
- H. 52
- I. 15
- J. 26
So, 8 is clearly the correct answer, and when I checked there didn’t seem to be an issue like the models reporting “8” instead of “A”. The most popular model choices are 31 and 37, with 37 being more popular among the stronger models. The item passes review, though the question of what’s going on with the models remains.
Question 6931
Define Gross National Product (GNP).
- A. The total income earned by a nation’s residents in a year
- B. The total amount of money in circulation in an economy in a year
- C. The total market value of all final goods and services produced in the economy in one year [recorded key]
- D. The market value of all goods and services produced abroad by the residents of a nation in a year
- E. The total cost of all goods and services purchased in a year
- F. The total savings rate of a nation’s residents plus the value of imports minus the value of exports in a year
- G. The aggregate of all wages paid to employees, plus profits of businesses and taxes, minus any subsidies
- H. The sum of all financial transactions within a country’s borders in a year
- I. The total value of all consumer spending, government spending, investments, and net exports in a year
- J. The total value of all goods and services produced by a nation’s residents, regardless of the location
So, the US Bureau of Economic Analysis says the gross national product is “[t]he market value of goods and services produced by labor and property supplied by U.S. residents, regardless of where they are located”. The gross domestic product (GDP), on the other hand, is a measure of “the value of final goods and services produced within the United States”. So C is describing GDP, not GNP. J is actually the correct answer. This item would not provide review.
Question 8473
Let V and W be 4-dimensional subspaces of a 7-dimensional vector space X. Which of the following CANNOT be the dimension of the subspace V intersect W?
- A. 0 [recorded key]
- B. 1
- C. 9
- D. 8
- E. 2
- F. 5
- G. 4
- H. 7
- I. 3
- J. 6
While it’s correct that 0 cannot be the dimension of the subspace V intersect W, it’s also the case that 5, 6, 7, 8, and 9 cannot be the dimensions either. This means options C, D, F, H, and J are correct, in addition to the recorded key, A. So there’s more than one correct answer. This item would not pass review.
Question 10750
Which is the largest asymptotically?
- A. O(n^2) [recorded key]
- B. O(n^3)
- C. O(sqrt(n))
- D. O(2^n)
- E. O(log n)
- F. O(n log n)
- G. O(log log n)
- H. O(1)
- I. O(n)
O(n^3) is obviously larger than O(n^2), but O(2^n) is much larger than both of them. So this is another case of an incorrect key: D, not A, is the intended correct answer. This item would not pass review.
4 out of the 5 items we looked at would not pass review. This suggests that using the discrimination flag would be quite helpful for identifying defective or anomalous items.
Difficulty
An item’s difficulty is, uh, how difficult it is. One way to measure it is to look at what proportion of respondents answer the item correctly. Another way is to look at the $b_i$ parameter of the fitted IRF, where $b_i$ indicates the ability level at which a respondent has a 50% chance of answering the item correctly.
In typical high-stakes assessments, test-makers want items to be neither too difficult nor too easy. The SAT flags items for review when the proportion answering correctly exceeds 0.90 or falls below 0.20. The ACT flags items for review when the proportion answering correctly falls outside the range 0.100–0.899 and, additionally, tries to ensure a balanced distribution of items across defined difficulty bands. PISA flags items where $|b_i| > 5$.
While it makes sense for benchmark creators to want to exclude items that are too easy, the case for excluding very difficult items is trickier. If we’re interested in measuring progress in AI, we may actually want to retain some easy items so that the benchmark remains informative for weaker models. Likewise, if you ensure that none of your items are too difficult, then your benchmark will quickly saturate and become obsolete. But the problem with items that no model can answer correctly is that, a lot of the time, the reason no model can answer them correctly is that the item is faulty, as in the case of Humanity’s Last Exam mentioned above.
Extreme difficulties also pose problems for estimating other item parameters, such as discrimination. It’s difficult to determine how well an item discriminates when nearly every model gives the same response, either because almost all models answer it correctly or almost all answer it incorrectly, regardless of ability. That said, let’s look at the most difficult items, as measured by the percentage of models answering correctly, and see what happens:
Question 10053
A block is dragged along a table and experiences a frictional force, f, that opposes its movement. The force exerted on the block by the table is
Options (models selecting each letter):
- A. parallel to the table — 49/500
- B. equal to the frictional force — 57/500
- C. in the opposite direction of movement — 193/500
- D. perpendicular to the table — 146/500
- E. in the direction of movement — 27/500
- F. zero — 10/500
- G. equal to the gravitational force — 3/500
- H. neither parallel nor perpendicular to the table — 1/500 [scored key]
- I. always greater than the frictional force — 8/500
- J. always less than the frictional force — 6/500
There are two forces exerted on the block by the table: the normal force, which is perpendicular to the table, and the frictional force, which is parallel to the table and opposite the direction of motion. The net contact force exerted by the table is the vector sum of these two forces, so it is neither parallel nor perpendicular to the table. Thus, H is in fact the correct option. This item would pass review.
Question 6998
Suppose a bank has $250,000 in deposits, and $10,000 in ex-cess reserves. If the required reserve ratio is 20%, what are the bank's actual reserves?
Options (models selecting each letter):
- A. $30,000 — 119/500
- B. $50,000 — 136/500
- C. $20,000 — 68/500
- D. $110,000 — 107/500
- E. $80,000 — 26/500
- F. $40,000 — 16/500
- G. $100,000 — 16/500
- H. $60,000 — 1/500 [scored key]
- I. $90,000 — 7/500
- J. $70,000 — 4/500
I would assume excess reserves refers to reserves the bank holds in excess of the required amount, so the bank’s actual reserves should be $(0.20 \times $250,000) + $10,000 = $60,000$. Thus, H is the correct option. This item would pass review.
Question 5401
By what nickname is the Federal National Mortgage Association known?
Options (models selecting each letter):
- A. Feddie Mac — 26/500
- B. Fannie Mac — 245/500
- C. FedNat — 6/500
- D. Federal Mae — 5/500
- E. FEMA — 1/500 [scored key]
- F. FedMort — 7/500
- G. Frankie Mae — 1/500
- H. Freddie Mac — 203/500
- I. Morty — 6/500
A quick Wikipedia search tells us that the Federal National Mortgage Association is commonly known as Fannie Mae. Interestingly, that’s not an option here. Its abbreviation, FNMA, isn’t an option either. So, not only is the scored key incorrect, but there isn’t even a correct option. This item would not pass review.
Question 7918
Compute 22 / 2 + 9.
Options (models selecting each letter):
- A. 24 — 158/500
- B. 23 — 196/500
- C. 21 — 23/500
- D. 22 — 55/500
- E. 10 — 10/500
- F. 25 — 27/500
- G. 2 — 3/500
- H. 20 — 1/500 [scored key]
- I. 19 — 11/500
- J. 11 — 16/500
Using the order of operations, $22 / 2 + 9 = 11 + 9 = 20$, so H is the correct option. In fact, I’m not sure how one arrives at most of the popular answers here. Even evaluating the expression strictly from left to right gives 20. You could get 2 only by incorrectly treating the expression as $22 / (2 + 9)$. So I am confused why models prefer options such as A or B. Anyway, the item would pass review, though I do wonder what’s going on with the models.
Question 8280
John is playing a game in which he tries to obtain the highest number possible. He must put the symbols +, $\times$, and - (plus, times, and minus) in the following blanks, using each symbol exactly once:[2 \underline{\hphantom{8}} 4 \underline{\hphantom{8}} 6 \underline{\hphantom{8}} 8.] John cannot use parentheses or rearrange the numbers. What is the highest possible number that John could obtain?
Options (models selecting each letter):
- A. 22 — 36/500
- B. 90 — 119/500
- C. 100 — 108/500
- D. 78 — 13/500
- E. 99 — 204/500
- F. 46 — 2/500 [scored key]
- G. 56 — 5/500
- H. 50 — 2/500
- I. 66 — 7/500
- J. 38 — 4/500
It does seem like the highest possible number one could obtain is 46, from $2 - 4 + 6 \times 8 = 46$, so F is the correct option. In fact, the only values obtainable from the six possible arrangements of the three operations are 18, -42, 6, 10, 46, and -14, so I’m confused why a model would choose any other option. Regardless, this item would pass review.
1 out of the 5 items we looked at would not pass review. In fact, the fact that so many models aren’t able to answer some of these items correctly confuses me a bit. Interestingly, 47 of the 102 (46%) most difficult items had H4 as the scored key, compared to 1,100 of 11,836 (9%) items overall. Regardless, the difficulty flag seems less useful than the discrimination flag for identifying defective items.
Distractor Behavior
Distractors are the incorrect answer choices in multiple-choice questions. In the same way that we expect the probability of selecting the correct option to increase with capability, we expect the probability of selecting an incorrect option to decrease with capability. If, instead, the probability of selecting a particular distractor increases with capability, we have to wonder what’s going on. Perhaps the indicated correct answer is not actually correct, perhaps there’s more than one defensible answer, perhaps the question itself is ambiguous, or perhaps something else has gone wrong. This is why the SAT flags items for review when “a distractor has a correlation with the total score greater than 0.05.”
So, I’ll take a look at the items with the highest distractor-total score correlations. However, because I’m taking the highest distractor-total correlation for each item and I’m also looking at 11,832 items, some correlations may appear quite high purely by chance. So, I use p-values5 and adjust them for the false discovery rate using the Benjamini-Hochberg procedure.
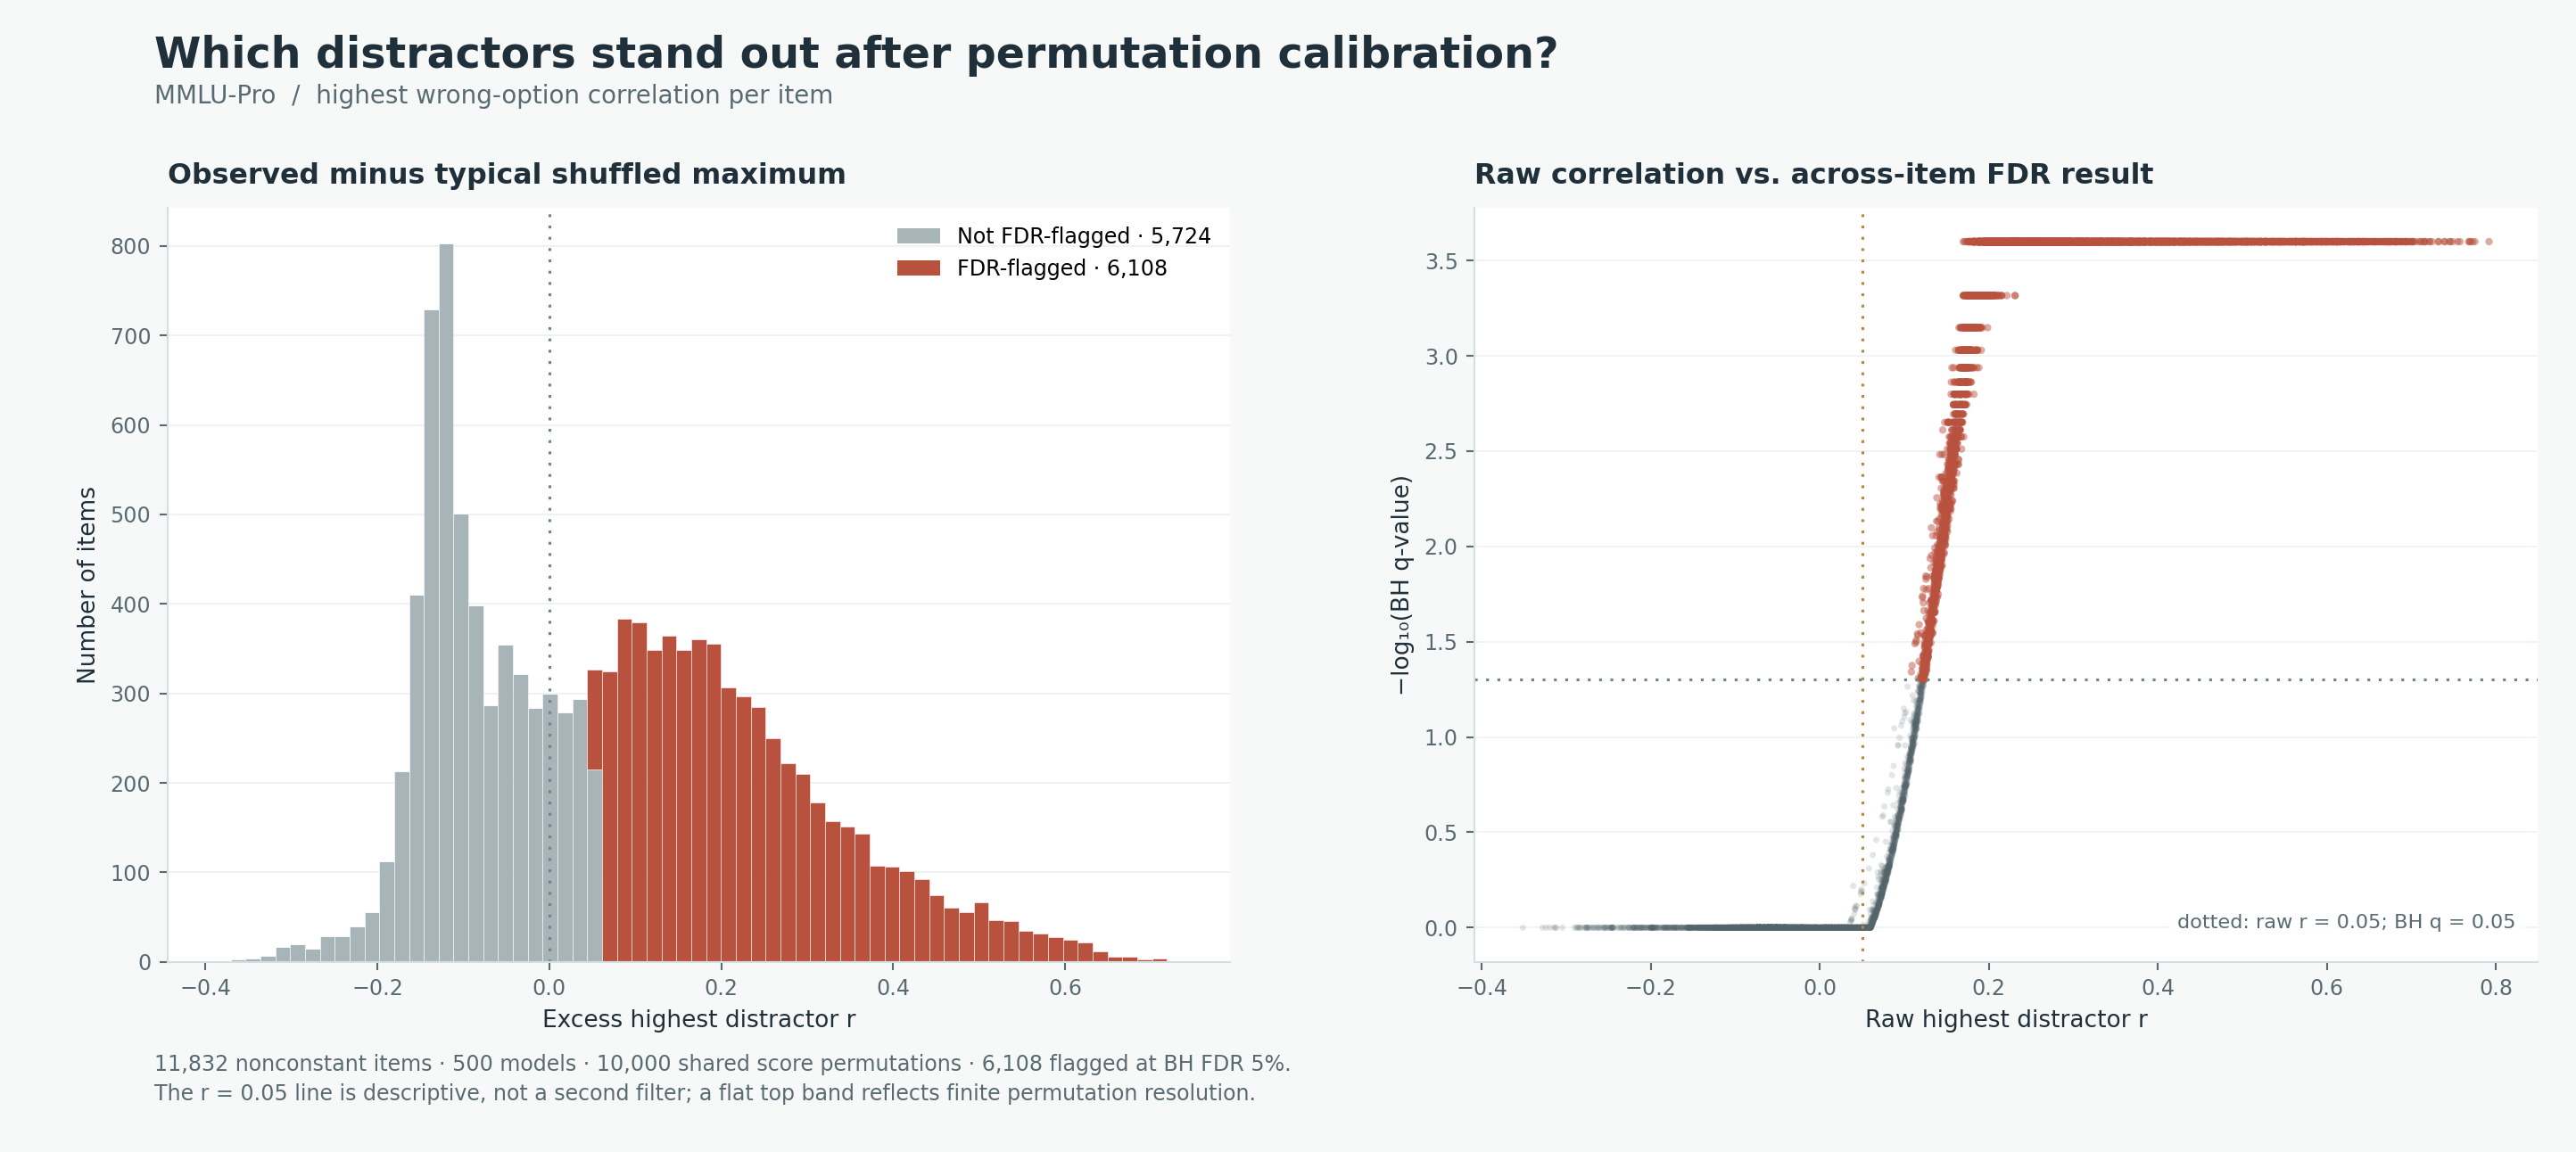
So, lots of items were flagged: more than half. This is another indicator of potential problems. Items with concerning distractor behavior also tend to have concerning discriminations.
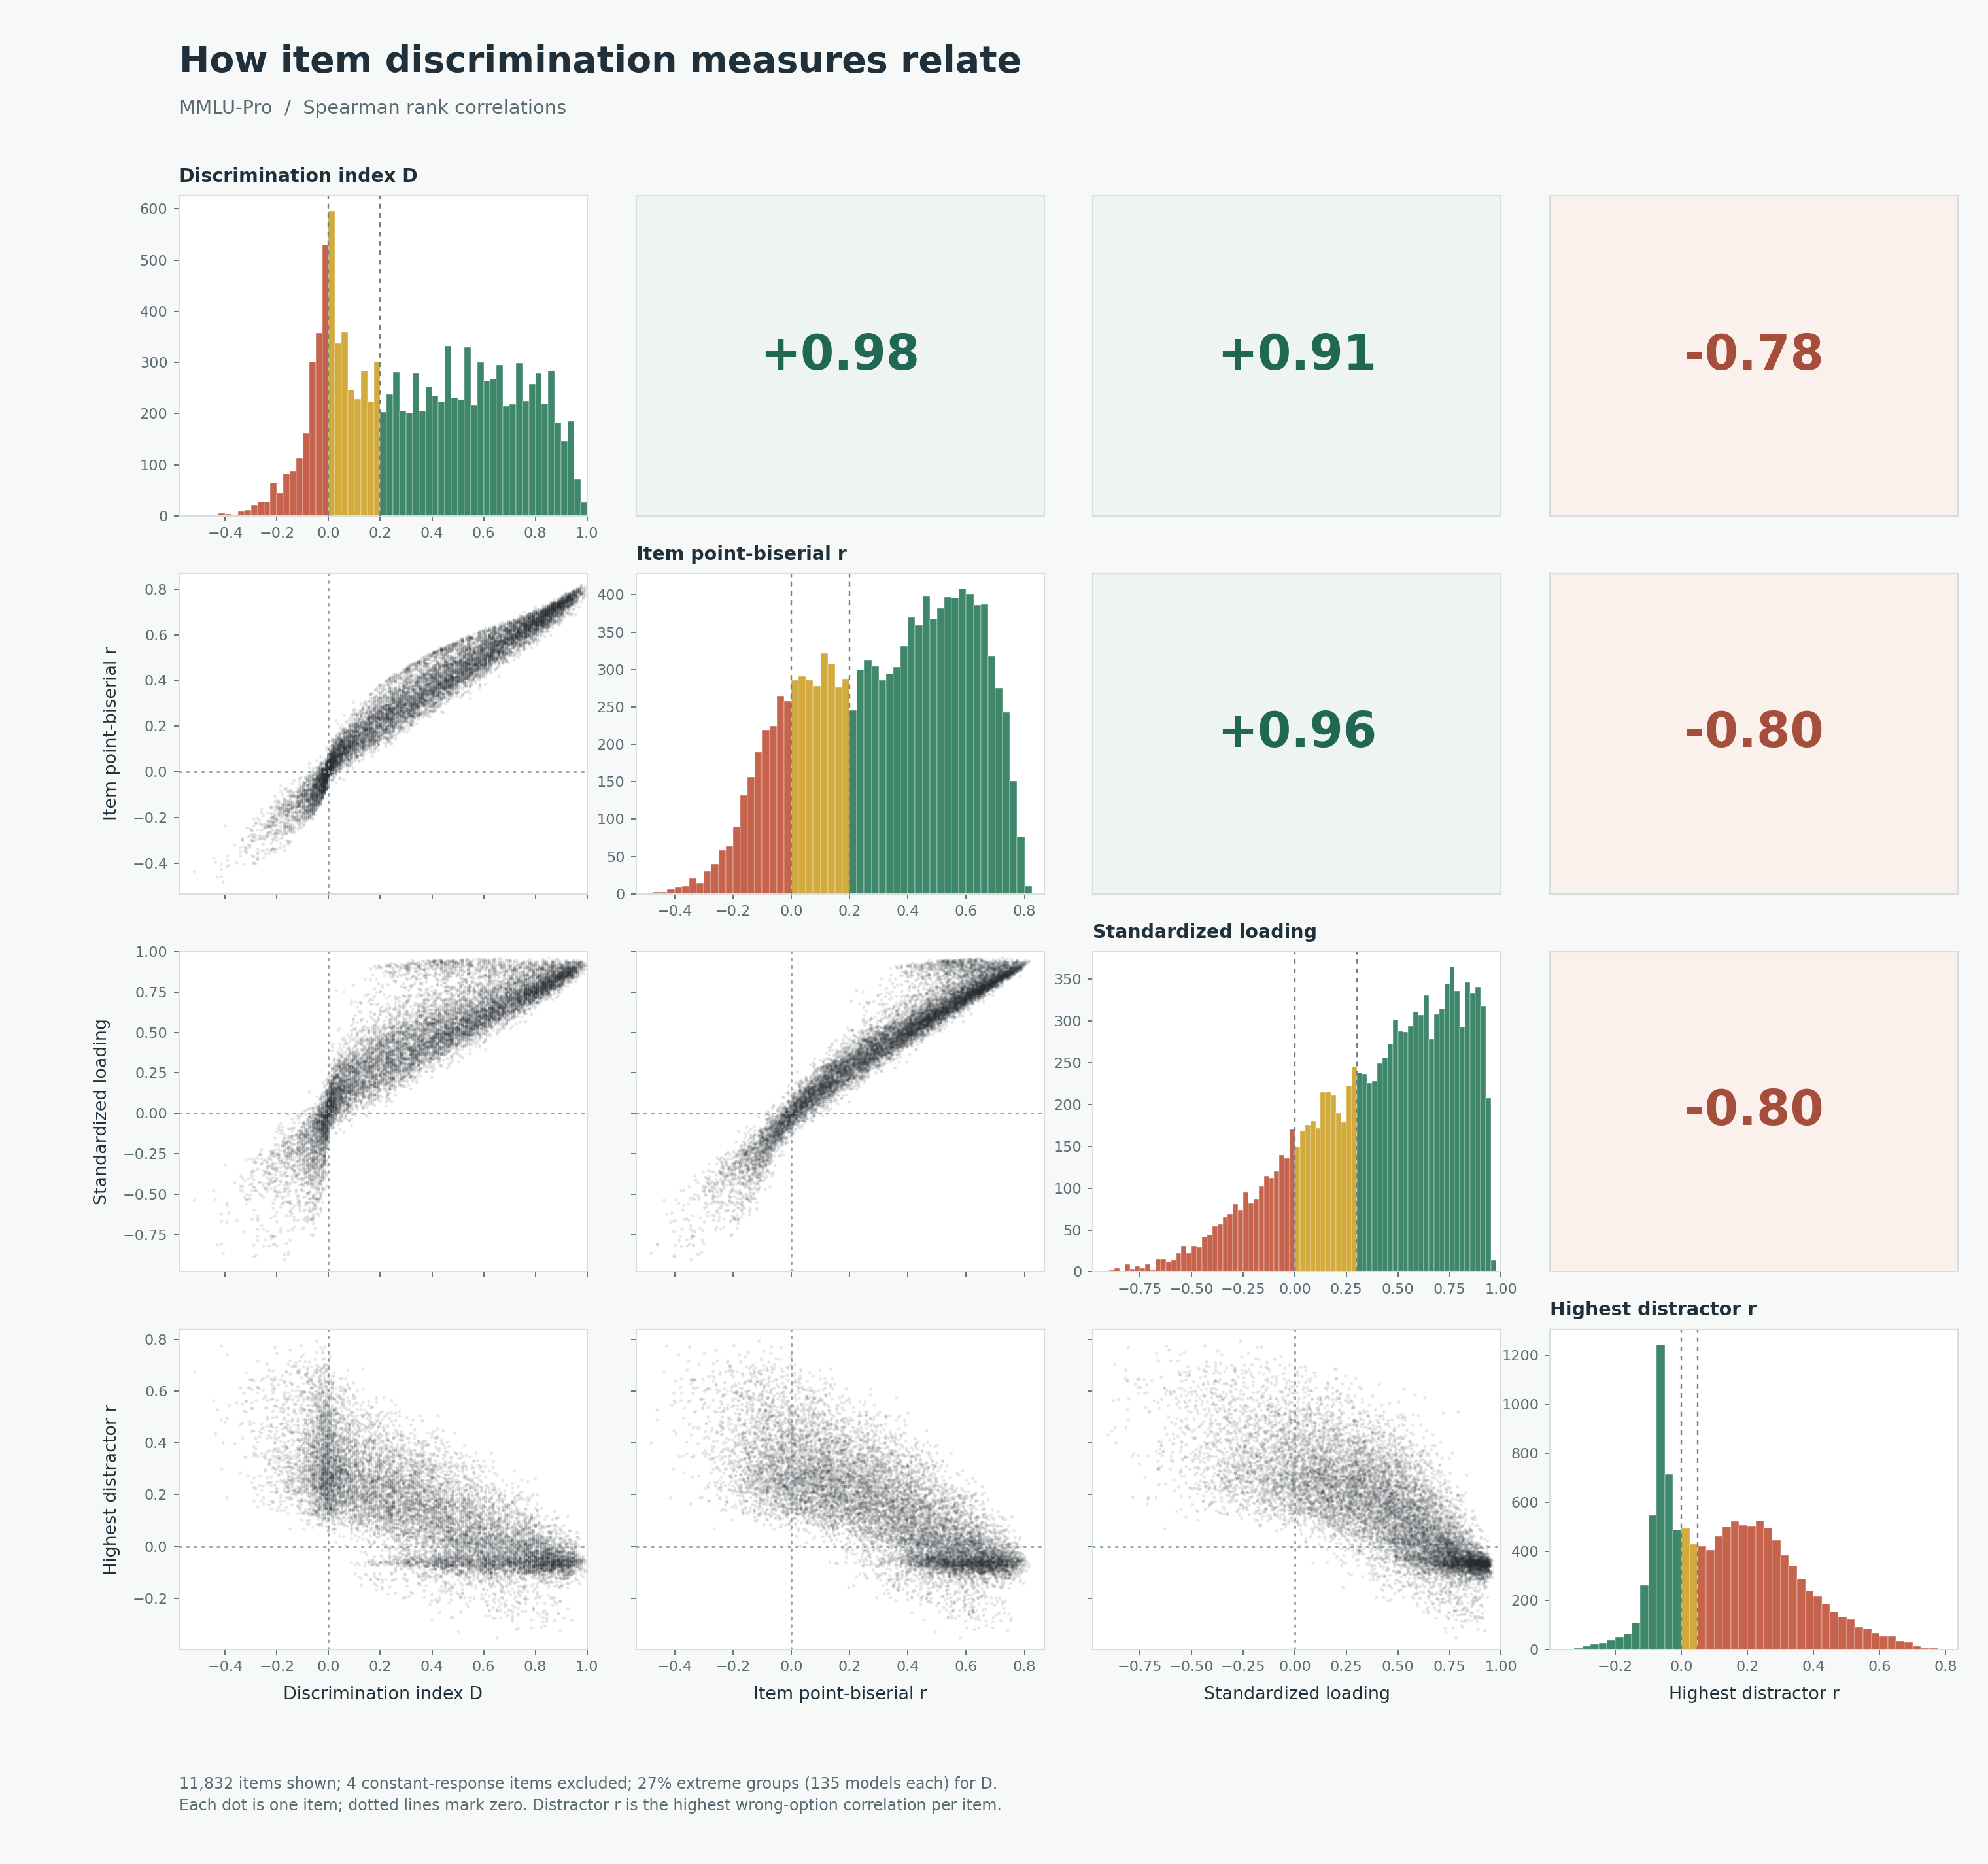
Let’s look at the worst offenders:
Question 9811
Two identical containers are filled with different gases. Container 1 is filled with hydrogen and container 2 is filled with nitrogen. Each container is set on a lab table and allowed to come to thermal equilibrium with the room. Which of the following correctly compares the properties of the two gases?
- A. The pressures of the gases cannot be compared without knowing the number of molecules in each container. [scored key]
- B. The pressures of the gases cannot be compared without knowing the temperature of the room.
- C. The thermal conductivity of the hydrogen gas is less than the nitrogen gas.
- D. The average force exerted on the container by the hydrogen gas is greater than the nitrogen gas.
- E. The viscosity of the hydrogen gas is greater than the nitrogen gas.
- F. The diffusion rate of the hydrogen gas is less than the nitrogen gas.
- G. The average speed of the hydrogen gas molecules is less than the nitrogen gas molecules.
- H. The density of the hydrogen gas is less than the nitrogen gas. [highest-r distractor]
- I. The average kinetic energy of the hydrogen gas is greater than the nitrogen gas.
- J. The average kinetic energy of the nitrogen gas is greater than the hydrogen gas.
Luckily, $PV = nRT$, the ideal gas law, has been burned into my brain. Volume is equal between the gases since the containers are identical, and temperature is also equal since they’ve both reached thermal equilibrium with the room. So, the only two variables left free to vary are $P$, the pressure, and $n$, the number of moles, and we’re not given any information about either. As such, A is the correct answer, so the key is correct. H would be true if we were told that the two containers held equal numbers of molecules, but we weren’t, so it’s incorrect, though it’s understandable how a model could arrive at that answer. All that said, though the item would be flagged for review, it would pass, since upon inspection I see no problems.
Question 5160
As of 2019, which of the following had the lowest life expectancy?
- A. Australia
- B. Japan
- C. United States
- D. Canada
- E. Iran
- F. Germany
- G. Brazil
- H. Russia [highest-r distractor]
- I. China
- J. Mexico [scored key]
According to Our World in Data, in 2019 Mexico had a life expectancy of 74.5 years, while Russia had a life expectancy of 73.1 years. So Russia, not Mexico, is the correct option. This item would not pass review.
Question 9205
An object of mass 2 kg is acted upon by three external forces, each of magnitude 4 N. Which of the following could NOT be the resulting acceleration of the object?
- A. 0 m/s^2
- B. 12 m/s^2
- C. 18 m/s^2 [highest-r distractor]
- D. 4 m/s^2
- E. 10 m/s^2
- F. 14 m/s^2
- G. 16 m/s^2
- H. 8 m/s^2 [scored key]
- I. 2 m/s^2
- J. 6 m/s^2
Since each force has magnitude 4 N, the greatest possible net force occurs when they’re all pointing in the same direction, giving a total force of 12 N. Since the mass is 2 kg, the maximum possible acceleration is $6\ \mathrm{m/s^2}$. As such, while H is a correct answer, so are B, C, E, F, and G. This item would not pass review.
Question 10478
Question:
The procedure below is intended to display the index in a list of unique names (nameList) where a particular name (targetName) is found. lf targetName is not found in nameList, the code should display 0. PROCEDURE FindName (nameList, targetName) { index ← 0 FOR EACH name IN nameList { index ← index + 1 IF (name = targetName) { foundIndex ← index } ELSE { foundIndex ← 0 } } DISPLAY (foundIndex) } Which of the following procedure calls can be used to demonstrate that the procedure does NOT Work as intended?
- A. FindName ([“Andrea”, “Ben”, “Chris”, “Diane”, “Eva”, “Frank”, “Grace”, “Hannah”, “Igor”], “Igor” )
- B. FindName ([“Andrea”, “Ben”, “Chris”, “Diane”], “Diane” )
- C. FindName ([“Andrea”, “Ben”, “Chris”, “Diane”, “Eva”, “Frank”], “Frank” )
- D. FindName ([“Andrea”, “Ben”], “Ben” )
- E. FindName ([“Andrea”, “Chris”, “Diane”], “Ben”) [highest-r distractor]
- F. FindName ([“Andrea”, “Ben” ], “Diane” )
- G. FindName ([“Andrea”, “Ben”, “Chris”], “Ben”) [scored key]
- H. FindName ([“Andrea”, “Ben”, “Chris”, “Diane”, “Eva”], “Eva” )
- I. FindName ([“Andrea”, “Ben”, “Chris”, “Diane”, “Eva”, “Frank”, “Grace”, “Hannah”], “Hannah” )
- J. FindName ([“Andrea”, “Ben”, “Chris”, “Diane”, “Eva”, “Frank”, “Grace”], “Grace” )
G does seem to be the correct answer. The problem with the procedure is that, while it sets foundIndex to index when it finds targetName, it resets foundIndex to 0 if it processes any nonmatching names afterward. G exposes this problem: it finds “Ben” at index 2, then resets foundIndex to 0 when it processes “Chris.” E is notable, along with F, in that nameList does not contain targetName, but that doesn’t expose a problem with the procedure, since returning 0 is exactly what it’s supposed to do in that case. The item seems correct and would pass review.
Question 10666
Statement 1 Overfitting is more likely when the set of training data is small. Statement 2 Overfitting is more likely when the hypothesis space is small.
- A. False, False, False
- B. True, True
- C. False, False
- D. False, True [scored key]
- E. False, Not enough information
- F. True, False [highest-r distractor]
- G. Not enough information, True
- H. True, Not enough information
- I. Not enough information, Not enough information
- J. Not enough information, False
Statement 1 is generally true: holding other things equal, overfitting is more likely with a smaller training set. So D, the scored key, is already incorrect. Statement 2 also seems false: if anything, overfitting is generally more likely when the hypothesis space is larger, since a more flexible hypothesis class can fit idiosyncrasies in the training data more easily. So F seems to be the correct option, not D. This item would not pass review.
3 out of the 5 items we looked at would not pass review. So, the distractor flag also seems helpful for identifying defective or anomalous items.
Takeaways
As you can see, all of the above criteria are flags for further review. They’re not automatic exclusion criteria that mean an item should immediately be eliminated. It’s also the case that the discrimination and distractor flags seem much more informative than the difficulty flags, which makes sense: they more directly indicate that something may be wrong with the item itself.
This is also much faster than going through every item one by one or randomly selecting items to inspect. And it’s better than simply looking at the items that many models got wrong, since, as we saw, difficulty by itself isn’t nearly as informative as discrimination or distractor behavior.
Psychometric flags can’t automatically tell us which benchmarks are faulty. But they can tell us where to look. Instead of waiting until models appear to hit a mysterious performance ceiling and only then auditing hundreds or thousands of items, we can use the same kinds of statistical diagnostics that psychometricians already use to identify suspicious items for closer review. If we’re going to use benchmarks to measure increasingly capable AI systems, the current state of affairs is abysmal, and we need to start holding benchmarks to higher standards.
-
There’s other flags like item response time (how quickly respondents spend on an item), item omission (what proportion of items attempt to answer the item), and differential item functioning (DIF) / measurement invariance (whether the item functions differently between groups). Flags like reponse time and item omission aren’t as applicable to AI models as they would be in humans. DIF, on the other hand, deserves its own post. ↩
-
Because I was going to use the MMLU-Pro for a different post idea, before realizing how utterly terrible it is. ↩
-
Well, since I’m not a polymath6, I’ll be looking through the most flagrant violators that I can actualy verify the veracity of. I could just ask an LLM whether the answer is scored correctly. But that seems akin to asking the students you’re testing whether their answers are correct. If they’re going to be more correct than you, then what’s the point in testing them? And if you think there is a point in testing them, then you necessarily don’t think you can trust their judgement of what is correct. ↩
-
H has become a most ominous letter ↩
-
This is unfortunately quite Frequentist of me. ↩
-
Looking through the items, I seem to know less than a high schooler. 😔 ↩