A Factor Analysis of Tailcalled’s Gender Surveys
Tailcalled ran a “Gender satisfaction and other things” survey with responses from 185 cis men recruited on Prolific, and a “Gender themes” survey with responses from 188 cis men recruited on Prolific. Some respondents took both surveys, so we can combine the responses and analyze them as a whole.
Factors
Parallel analysis suggested extracting 11 factors. And yet, there are 20 factors described below. This is because I thought splitting several of the original factors might provide a more informative analysis. For example, the following pairs of factors were originally merged:
- Feminization Fantasies (F2) and Comfort with Feminization (F3)
- Attraction to Men (F17) and Attraction to Women (F18)
- BDSM Dominance (F15) and BDSM Submission (F16)
- Gender Progressivism (F11) and Perceived Female Advantage (F12)
- Male Identification (F4) and Gender Traditionalism (F10)
The splits seem reasonable, though the original relationships are reflected in the correlations between the resulting factors (especially Attraction to Men and Attraction to Women). Additionally, Masculine Interests (F5) and Extraversion (F6) were merged for some strange reason, but don’t seem to be that closely related now that they’re split apart. From some spare items that weren’t assigned to any factors, I created Machismo (F14). I also created General Sexual Interest (F20) to control for differences in overall sexual interest. The Trans/Androgynous Attraction (F19) factor was also added because, what the hell, it works.
F1: Gender Dysphoria
Enable JavaScript to explore this diagram.
F2: Feminization Fantasies
Enable JavaScript to explore this diagram.
F3: Comfort with Feminization
Enable JavaScript to explore this diagram.
F4: Male Identification
Enable JavaScript to explore this diagram.
F5: Masculine Interests
Enable JavaScript to explore this diagram.
F6: Extraversion
Enable JavaScript to explore this diagram.
F7: Psychological Distress
Enable JavaScript to explore this diagram.
F8: Female Affiliation
Enable JavaScript to explore this diagram.
F9: Belief in Gender Stereotypes
Enable JavaScript to explore this diagram.
F10: Gender Traditionalism
Enable JavaScript to explore this diagram.
F11: Gender Progressivism
Enable JavaScript to explore this diagram.
F12: Perceived Female Advantage
Enable JavaScript to explore this diagram.
F13: Sexual Experience
Enable JavaScript to explore this diagram.
F14: Machismo
Enable JavaScript to explore this diagram.
F15: BDSM Dominance
Enable JavaScript to explore this diagram.
F16: BDSM Submission
Enable JavaScript to explore this diagram.
F17: Attraction to Men
Enable JavaScript to explore this diagram.
F18: Attraction to Women
Enable JavaScript to explore this diagram.
F19: Trans/Androgynous Attraction
Enable JavaScript to explore this diagram.
F20: General Sexual Interest
Enable JavaScript to explore this diagram.
Factor Structure
Factor Correlation Matrix
Loading correlation matrix…
Select a cell to see the factor names and 90% credible interval. Use the arrow keys to move between cells; scroll sideways on smaller screens.
Residual Correlations
There are also some residual correlations in our factor model worth listing. Some arise because the same item was asked in both surveys, allowing us to see how stable responses were over time. Others arise because two questions are basically identical, either because they ask about the same behavior or experience, or because they're paraphrases of each other. Still others reflect relationships that aren't fully explained by our 20 factors.
Repeated questions ("test–retest")
| Question | Observed r | Residual r [90% CI] |
|---|---|---|
| Do you believe there are more than two genders? | 0.96 | 0.88 [0.81, 0.94] |
| If you had the opportunity to magically try being female, with the option of switching back, how long would you try? | 0.89 | 0.71 [0.63, 0.78] |
| Do you feel like people can choose their gender? | 0.88 | 0.68 [0.57, 0.77] |
| Do you think it is important for men to be manly and women to be womanly? | 0.88 | 0.48 [0.36, 0.61] |
| Would you be offended if people thought you were unmanly or gay? | 0.86 | 0.72 [0.63, 0.80] |
| Do you feel men or women have it easier in life? | 0.85 | 0.64 [0.52, 0.74] |
| Do you believe men have an obligation to take care of and protect women? | 0.84 | 0.73 [0.64, 0.81] |
| Do you believe women can do anything men can? (Other than physical strength) | 0.83 | 0.77 [0.68, 0.85] |
| Do you feel like women are prone to excessively overthinking things? | 0.83 | 0.40 [0.28, 0.52] |
| Body sex satisfaction | 0.83 | 0.32 [0.23, 0.41] |
| Do you feel young women tend to have a lot of unnecessary drama? (More than young men) | 0.79 | 0.43 [0.32, 0.54] |
| Do you think you could be happy if you were a woman? | 0.79 | 0.40 [0.29, 0.53] |
| How psychologically different do you feel men and women are? | 0.77 | 0.65 [0.55, 0.75] |
| If you were to suddenly magically become a woman, how confusing would it feel? | 0.76 | 0.31 [0.20, 0.43] |
| If you somehow magically became a woman in mind and body, would you still consider that to be "you"? | 0.75 | 0.54 [0.43, 0.65] |
| Who do you think has a most healthy understanding of gender? | 0.71 | 0.52 [0.41, 0.62] |
| Do women feel too much guilt about everything? | 0.69 | 0.41 [0.31, 0.53] |
| Do you feel you have learned a lot of lessons about how to succeed as a man? | 0.55 | 0.39 [0.28, 0.50] |
Similar or overlapping questions
| Questions | Observed r | Residual r [90% CI] |
|---|---|---|
| Are you autistic?Mental conditions [Autism-spectrum] | 0.96 | 0.91 [0.85, 0.95] |
| Sexuaity [Having causal sex with a stranger]Sexual arousal [Having casual sex with a stranger] | 0.85 | 0.80 [0.76, 0.85] |
| Do you do muscle training and/or activity that requires a lot of upper body strength?I do not exercise on a regular basis [-] | −0.66 | −0.60 [−0.70, −0.49] |
| Cross-gender fetishism screener [Wearing women's clothes or makeup or other feminine accessories]Do you have a fetish for women's underwear? | 0.84 | 0.59 [0.43, 0.74] |
| I get upset easily [-]Is it easy for people to hurt your feelings? | 0.71 | 0.56 [0.45, 0.65] |
| Sexuaity [Feeling affection and emotional attachment during sex]Sexual arousal [Feeling emotional attachment or affection during sex] | 0.59 | 0.54 [0.43, 0.64] |
Other residual associations
| Questions | Observed r | Residual r [90% CI] |
|---|---|---|
| Sexual arousal [Being treated as a slave by your partner]Sexual arousal [Treating your partner as a slave] | 0.85 | 0.76 [0.66, 0.84] |
| Sexual arousal [Being tied up by your partner using rope]Sexual arousal [Tying up your partner using rope] | 0.79 | 0.75 [0.67, 0.82] |
| Sexual arousal [Having sex with a male-to-female transsexual]Sexual arousal [Making out with someone whose sex you cannot tell] | 0.90 | 0.68 [0.56, 0.78] |
| Sexual arousal [Being treated roughly by your partner in bed, e.g. spanked, pulled hair, or shoved around]Sexual arousal [Treating your partner roughly in bed, e.g. spanking, pulling hair or shoving them around] | 0.72 | 0.57 [0.45, 0.68] |
| Do you have a negative opinion of gay men?Do you wear makeup in your everyday life? | −1.00 | −0.54 [−0.92, 0.15] |
| Mental conditions [Borderline personality disorder]Mental conditions [Some psychotic or dissociative disorder] | 0.80 | 0.52 [0.22, 0.76] |
| Have you had a threesome? [Two men]How many different sexual partners have you had? | 0.74 | 0.51 [0.29, 0.70] |
| I don't think I could ever adapt to being a woman [-]I would be very unhappy if I had to be a woman [-] | 0.72 | 0.51 [0.40, 0.60] |
| Have you been shamed for not being masculine enough?Have you gotten teased about looking like a girl? | 0.71 | 0.51 [0.32, 0.67] |
| If you magically woke up as a woman tomorrow, which emotions would you feel as a result? [Fury]If you magically woke up as a woman tomorrow, which emotions would you feel as a result? [Humiliation] | 0.75 | 0.49 [0.34, 0.63] |
| I regularly experience a "phantom vagina", having sensations as if I had a vagina [-]I think of myself as being transgender [-] | 0.75 | 0.49 [0.26, 0.69] |
| I would be better able to attract partners if I was a woman [-]I would have more friends if I was a woman [-] | 0.55 | 0.39 [0.28, 0.50] |
Higher-Order Factor Structure
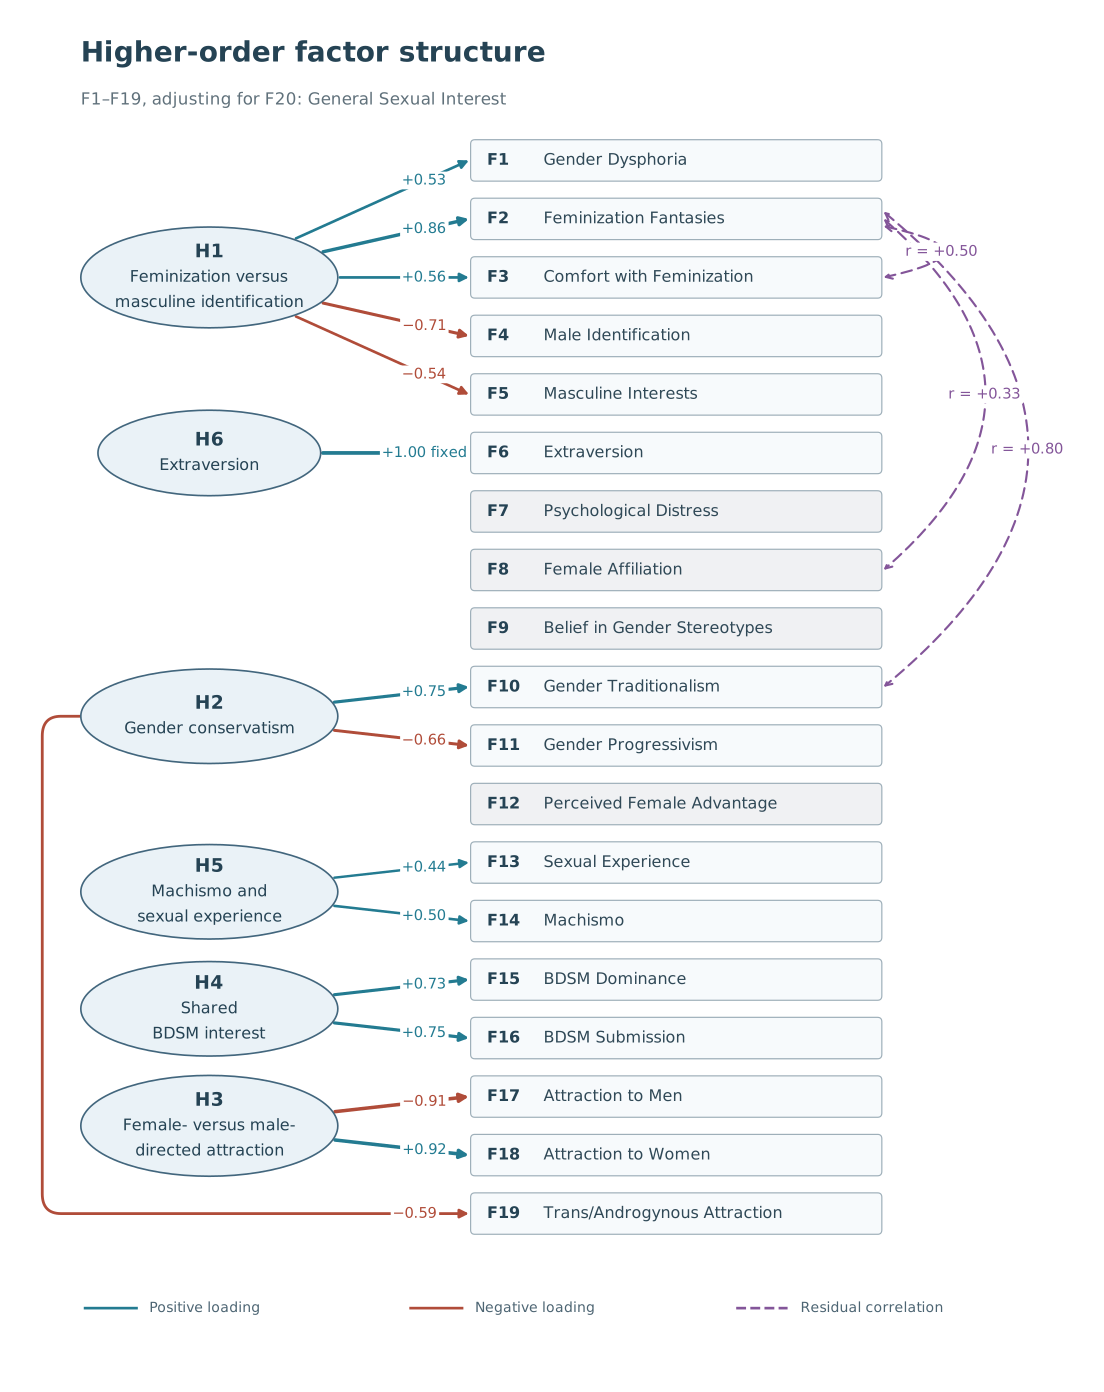
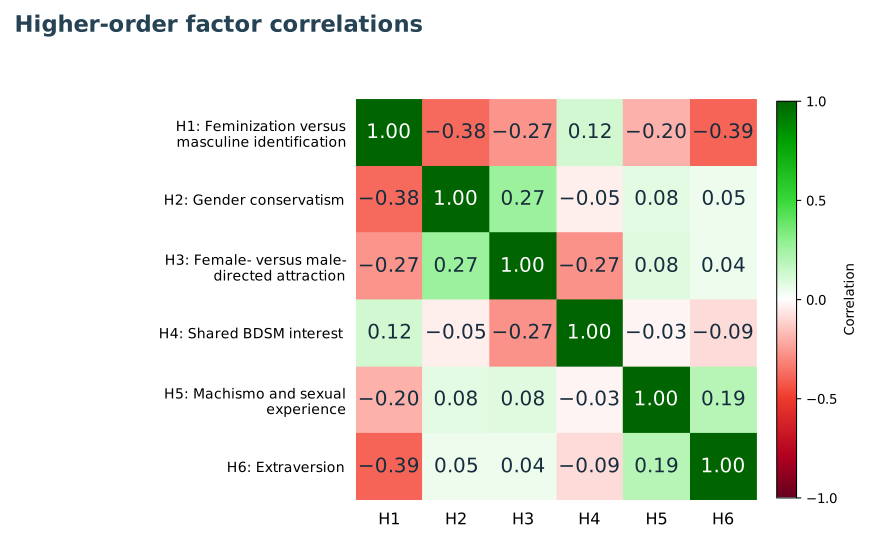
Implications
Correlations are nice, but sometimes we want to look at more complicated relationships. In his paper The Factor Structure of Conspiracist Beliefs, Zimmer notes that for some pairs of factors, not only is the correlation high, but almost all points lie on one side of the bottom-left-to-top-right diagonal. For example, comparing the Flat Earth and Generic Conspiracy factor scores, the vast majority of points lie below the diagonal. That is, respondents who score highly on Flat Earth almost always score at least as highly on Generic Conspiracy. One might conclude that high Flat Earth belief implies high Generic Conspiracy belief (or, equivalently, that low Generic Conspiracy belief implies low Flat Earth belief). I use a different measure from Zimmer’s, but we can look for similar patterns in the survey data.
Loading implication plots…
| Rank | Implication | Strength | Converse |
|---|
How the scores and ranking work
For an implication sX ⇒ tY, where s and t are +1 for high and −1 for low, each violation has severity d = max(0, min(sX, −tY)). This is the distance to the nearest nonviolating point.
The average severity is V = mean(d). Independent standard-normal variables have expected severity V₀ = (√2 − 1)/(2√π) ≈ 0.11685. Implication strength is I = 1 − V/V₀: 1 means no violations, 0 matches the independence baseline, and negative values mean more severe violations than that baseline.
By default, the table ranks pairs by max(0, I) − max(0, I_converse), favoring strong implications with weak converses; ties are broken by implication strength. Selecting “Strength” ranks by I alone. Each pair appears once, using its highest-scoring direction under the selected rule. The converse of A ⇒ B is B ⇒ A. The contrapositive, not B ⇒ not A, has exactly the same score as the original implication.
Severities are averaged across 191 participants and 1,000 posterior draws, retaining the fitted population scale. The 90% credible intervals describe uncertainty in this sample’s implication strength; they do not include resampling participants.
There are many potential implications one could look at, but let’s take a look at High F2: Feminization Fantasies ⇒ High F3: Comfort with Feminization. I think this makes intuitive sense. For example, we shouldn’t expect to see someone who frequently fantasizes about feminization yet is very uncomfortable with feminization. In a sense, comfort with feminization is (loosely) necessary but not sufficient for feminization fantasies. Or perhaps feminization fantasies cause comfort with feminization. Both are consistent with the data. Of course, the contrapositive is logically equivalent: not being high in comfort with feminization implies not being high in feminization fantasies. So, the data is also consistent with discomfort with feminization inhibiting feminization fantasies as well as a lack of feminization fantasies being (loosely) necessary but not sufficient for discomfort with feminization.
Usually, when dealing with correlations, one must keep in mind that correlation is not causation. But in most cases where two variables are correlated but neither causes the other, the reason is that they share a common cause. Implication patterns are more informative than correlations alone, since there’s an asymmetry must be explained, yet which a common cause is incapable of explaining. That said, the implication pattern doesn’t necessarily imply causation. For this example, we might think that feminization fantasies are really a more extreme example of the same sort of phenomenon as comfort with feminization. For example, frequently initiating conversations with complete strangers is a more extreme form of extraversion than enjoying time with one’s friends. We would notice a lack of people who enjoy starting conversations with strangers but not spending time with their friends, especially compared to people who enjoy spending time with their friends but not starting conversations with strangers. But one doesn’t cause the other. That might be the case with the two factors we’re looking at, which were, to be fair, originally merged before I split them apart, and even now correlate with each other at +.59.
But I don’t think this kind of explanation works as well for implications involving more distinct factors, such as High F17: Attraction to Men ⇒ High F11: Gender Progressivism. In this case, gender-progressive beliefs aren’t a more extreme version of attraction to men. I think, in a case like this, we might really suspect that attraction to men causes gender-progressive beliefs.
Regardless, measuring implication strength like this seems like it may yield interesting hypotheses, and seems like something that should at least be considered more often in research.
Benefits/Harms
Let’s take a look at how the factors we’ve extracted relate to whether people see aspects of being male or female as beneficial or harmful. These coefficients describe the association with a one-SD increase in each factor, holding the other factors fixed. Positive coefficients mean that higher factor scores are associated with seeing the aspect as more beneficial to men.
Loading benefits/harms results…
Overall male advantage is the mean coefficient across the 16 appraisals, rather than an additional survey response.
Response options, from low to high
Estimates are posterior means with 90% credible intervals, rounded to two decimal places.
About this fit
The 20-factor measurement model and the 16 ordinal appraisal regressions were fitted jointly. Power in society, Male femininity, and Male gender norms were removed from the measurement indicators and used only as appraisal outcomes. The joint fit includes 191 participants, of whom 185 answered the appraisal questions.
Each item coefficient is an overall coefficient plus an item-specific departure. Departures sum to zero across the 16 appraisals for each factor. The model also includes a shared participant appraisal residual whose variance can shrink toward zero.
We’ve got some interesting results. Male Identification seems to consistently predict belief in greater male advantage (which didn’t surprise me), while Extraversion seems to consistently predict belief in greater female advantage (which did surprise me). Also, Perceived Female Advantage has a particularly large association with how one thinks power in society would affect them as either gender, but smaller associations with some of the other aspects. This might be surprising unless you remember that the factor deals with how each gender is treated by society.
Takeaways
I originally did this analysis because I thought it would help me understand the nature of gender. Unfortunately, it did not. It is interesting, I guess, to see that some men like being men while others dislike being men, and that some men fantasize about being women or think it would be nice if they were women. But I don’t know how to connect that to the thing some people call gender. Is gender just what we wish we were? Or something more? I can think of only one solution to this puzzle: I am demanding Tailcalled release the gender survey.
That said, thanks to Tailcalled for sharing the data!