We Still Can't Measure Rationality
I am, I suppose, a rationalist. In the olden days, it was popular to call oneself an aspiring rationalist, to emphasize that one still falls short of the ideal, though one aspires to it. Yet, in our journey to become more rational, how do we know whether our reasoning has improved? How do I know if I’m more rational than I was a year ago? Or if I’m even more rational than average? ¯\_(ツ)_/¯
Science
One might think this is a solved problem. After all, there is a Rationality Quotient1. The Rationality Quotient is intended to measure, what else, rationality, and its creator Keith Stanovich argues that rationality is distinct from intelligence: intelligence concerns algorithmic processing power, while rationality concerns whether beliefs and decisions conform to logic, probability, and instrumental goals. On this view, rationality is not merely being smart; it is using one’s cognitive machinery well. Yet a closer look casts doubt on the stronger claim that broad rationality, measured this way, is separable from intelligence.
Conveniently, the book in which Stanovich introduces the Rationality Quotient, The Rationality Quotient: Toward a Test of Rational Thinking, contains enough published data to investigate the relationship between intelligence and rationality. In Table 12.4 (page 228), Stanovich displays the correlations among the short-form CART subtests; in Table 13.4 (page 242), Stanovich displays the correlations between CART subtests, the total score, and different cognitive measures. The cognitive measures included the SAT total score, a cognitive composite composed of the sum of the z-scores of three tasks (analogies, antonyms, word checklist) called Cognitive Ability Composite3, and a cognitive composite composed of those same tasks plus SAT total score, called Cognitive Ability Composite4.
Looking at Table 13.4, the observed correlation between Cognitive Ability Composite4 and the CART total score is 0.705. That is already high by psychometric standards; it is in the same broad range as correlations between g and standardized tests, which are considered substantially g-loaded measures of intelligence2. In other words, the CART appears g-loaded enough that it would probably function reasonably well as a rough intelligence proxy, which casts doubt on the supposed distinction between rationality and intelligence.
The relationship becomes even stronger if we estimate the correlation with latent rationality rather than the observed CART total score. Reconstructing the CART factor structure from the published correlation matrices, extracting3 one factor4 from the CART, and correlating it with Cognitive Ability Composite4 gives an estimated latent correlation of about 0.85. The exact estimate should not be overinterpreted, since Cognitive Ability Composite4 is still an observed composite rather than a latent g factor. But if cognitive ability were modeled latently using a broader battery, I would expect the latent CART-g correlation to be at least as high, and possibly higher. Either way, a latent correlation of about 0.85 is already difficult to reconcile with the claim that the CART measures broad rationality as a trait substantially distinct from intelligence.
There’s also a 2025 paper, Cognitive rationality is heritable and lies under general cognitive ability, which investigates the relationship between cognitive rationality (CR) and cognitive ability (CA). They test three models:
- An independence model in which CA measures and CR measures load on separate latent pathways, not sharing genetic and environmental influences.
- An overlap model including a miserly cognition latent factor influencing CR (and able to influence CA performance) as well as a general ability factor impacting CR and CA.
- A domain-general model in which CR was accounted for by a general CA factor influencing all CA scales and CR.
They find that the domain-general model had the strongest fit, with CA accounting for 70% of the variance in CR, which corresponds to a correlation of 0.845 in the simple one-factor interpretation. If the four-question CR measure has substantial measurement error, which is likely due to its brevity, then the observed CA-CR relationship is probably attenuated. So, the latent CA-CR correlation may be higher than the reported 0.84. I would not put much weight on the exact number, but the direction is inconsistent with the claim that CR is independent of CA.
So, Stanovich’s attempt to build a broad rationality measure with substantial discriminant validity from intelligence does not seem to have succeeded. But could he have known sooner that it would fail? There is a recurring psychometric pattern: when a test requires people to solve decontextualized problems with right and wrong answers (e.g., standardized achievement tests, admissions tests, ‘critical thinking’ tests), it often becomes substantially g-loaded, even if it was designed to measure something else. Taking this into account, it’s not surprising that Stanovich’s measure appears to have limited discriminant validity from intelligence. It does seem to imply that disentangling rationality from intelligence will be very difficult, if it is possible at all.
Bayes
The academic literature does not yet seem to provide what we need: a broad, externally validated rationality measure that is useful for evaluating rationality interventions and not mostly a proxy for cognitive ability. But I’m told Bayes is faster than Science, so perhaps the rationalist community has done better. It’s hard to find any systematic attempts to measure rationality, but the closest example I found was CFAR’s 2015 evaluation of their 2014-2015 workshops. It used an uncontrolled pre-post design with N = 135. The outcomes were loosely categorized into four broad areas:
- Well-being: On the whole, is the participant’s life going better than it was before the workshop?
- Personality: Have there been changes on personality dimensions which seem likely to be associated with increased rationality?
- Behaviors: Have there been increases in rationality-related skills, habits, or other behavioral tendencies?
- Productivity: Is the participant working more effectively at their job or other projects?
The behavioral outcomes are the most pertinent here, because they are closest to the thing rationalists usually mean by “becoming more rational”: better reasoning habits, better conversational norms, better handling of emotions, and fewer cognitive errors. These include:
- a self-report measure of the rate at which a person’s toolkit of useful techniques is growing
- a self-report measure of three useful conversational behaviors
- performance measures of four cognitive biases or reasoning errors
- a self-report measure of whether a person relates to their emotions in a way that helps them pursue their goals
Self-report measures do not directly measure our target outcome. Ideally, we’d like to know whether people are actually reasoning and deciding better, not merely whether they feel more rational or report using more rationality-flavored techniques. To its credit, the follow-up questionnaire did include performance-based rationality items. Unfortunately, the four questions were taken from Stanovich’s work, so they inherit the issues discussed above.
A useful measure of rationality would need to do at least three things. First, it would need external validity: scores should predict real-world belief accuracy, decision quality, or goal achievement. Second, it would need incremental validity over cognitive ability: it should explain something important after controlling for g. Third, it would need to be sensitive to interventions: if a rationality intervention works, the measure should be able to detect improvement without merely tracking test familiarity. Existing measures do not seem to satisfy all three requirements.
Conclusion
So, both the scientists and the rationalists have failed us. We still do not seem to have a clean measure of broad rationality6 as a trait distinct from intelligence. The problem has two parts. Measures that seem psychometrically rigorous often turn out to overlap heavily with cognitive ability. Measures used in intervention evaluations are often too self-reported or too narrow to tell us whether broad rationality actually improved.
Why does this matter? It means we can’t determine whether interventions, such as reading LessWrong, actually make people more rational7. Sure, people feel that some interventions work, but we can’t trust subjective impressions. We need external validation. And currently, we don’t even have the tools we’d need to obtain such proof. This seems unideal.
Appendix
One-Factor Model of the CART
Using the published CART subtest correlations from Table 12.4 and fitting a one-factor model4 to the correlation matrix yields a factor with the following loadings:
- Reflection vs Intuition (0.68)
- Scientific Reasoning (0.67)
- Probabilistic Reasoning (0.64)
- Probabilistic Numeracy (0.60)
- Syllogistic Reasoning (0.60)
- Superstitious Thinking (0.52)
- Antiscience Attitudes (0.46)
- Conspiracy Beliefs (0.37)
- Ratio Bias (0.36)
- Disjunctive Reasoning (0.33)
Estimating the correlation with the Cognitive Ability Composite4 yields 0.85. The square root of the average variance extracted of the CART factor is 0.54, which is less than 0.85, thus under the Fornell-Larcker criterion discriminant validity is not satisfied. In plain English, the CART factor is more strongly related to cognitive ability than it is, on average, to its own indicators. That is a very bad sign for the claim that the CART factor is measuring a construct cleanly distinct from cognitive ability. We can investigate the same issue using the method of correlated vectors: do the subtests that load more strongly on the extracted CART factor also correlate more strongly with cognitive ability?
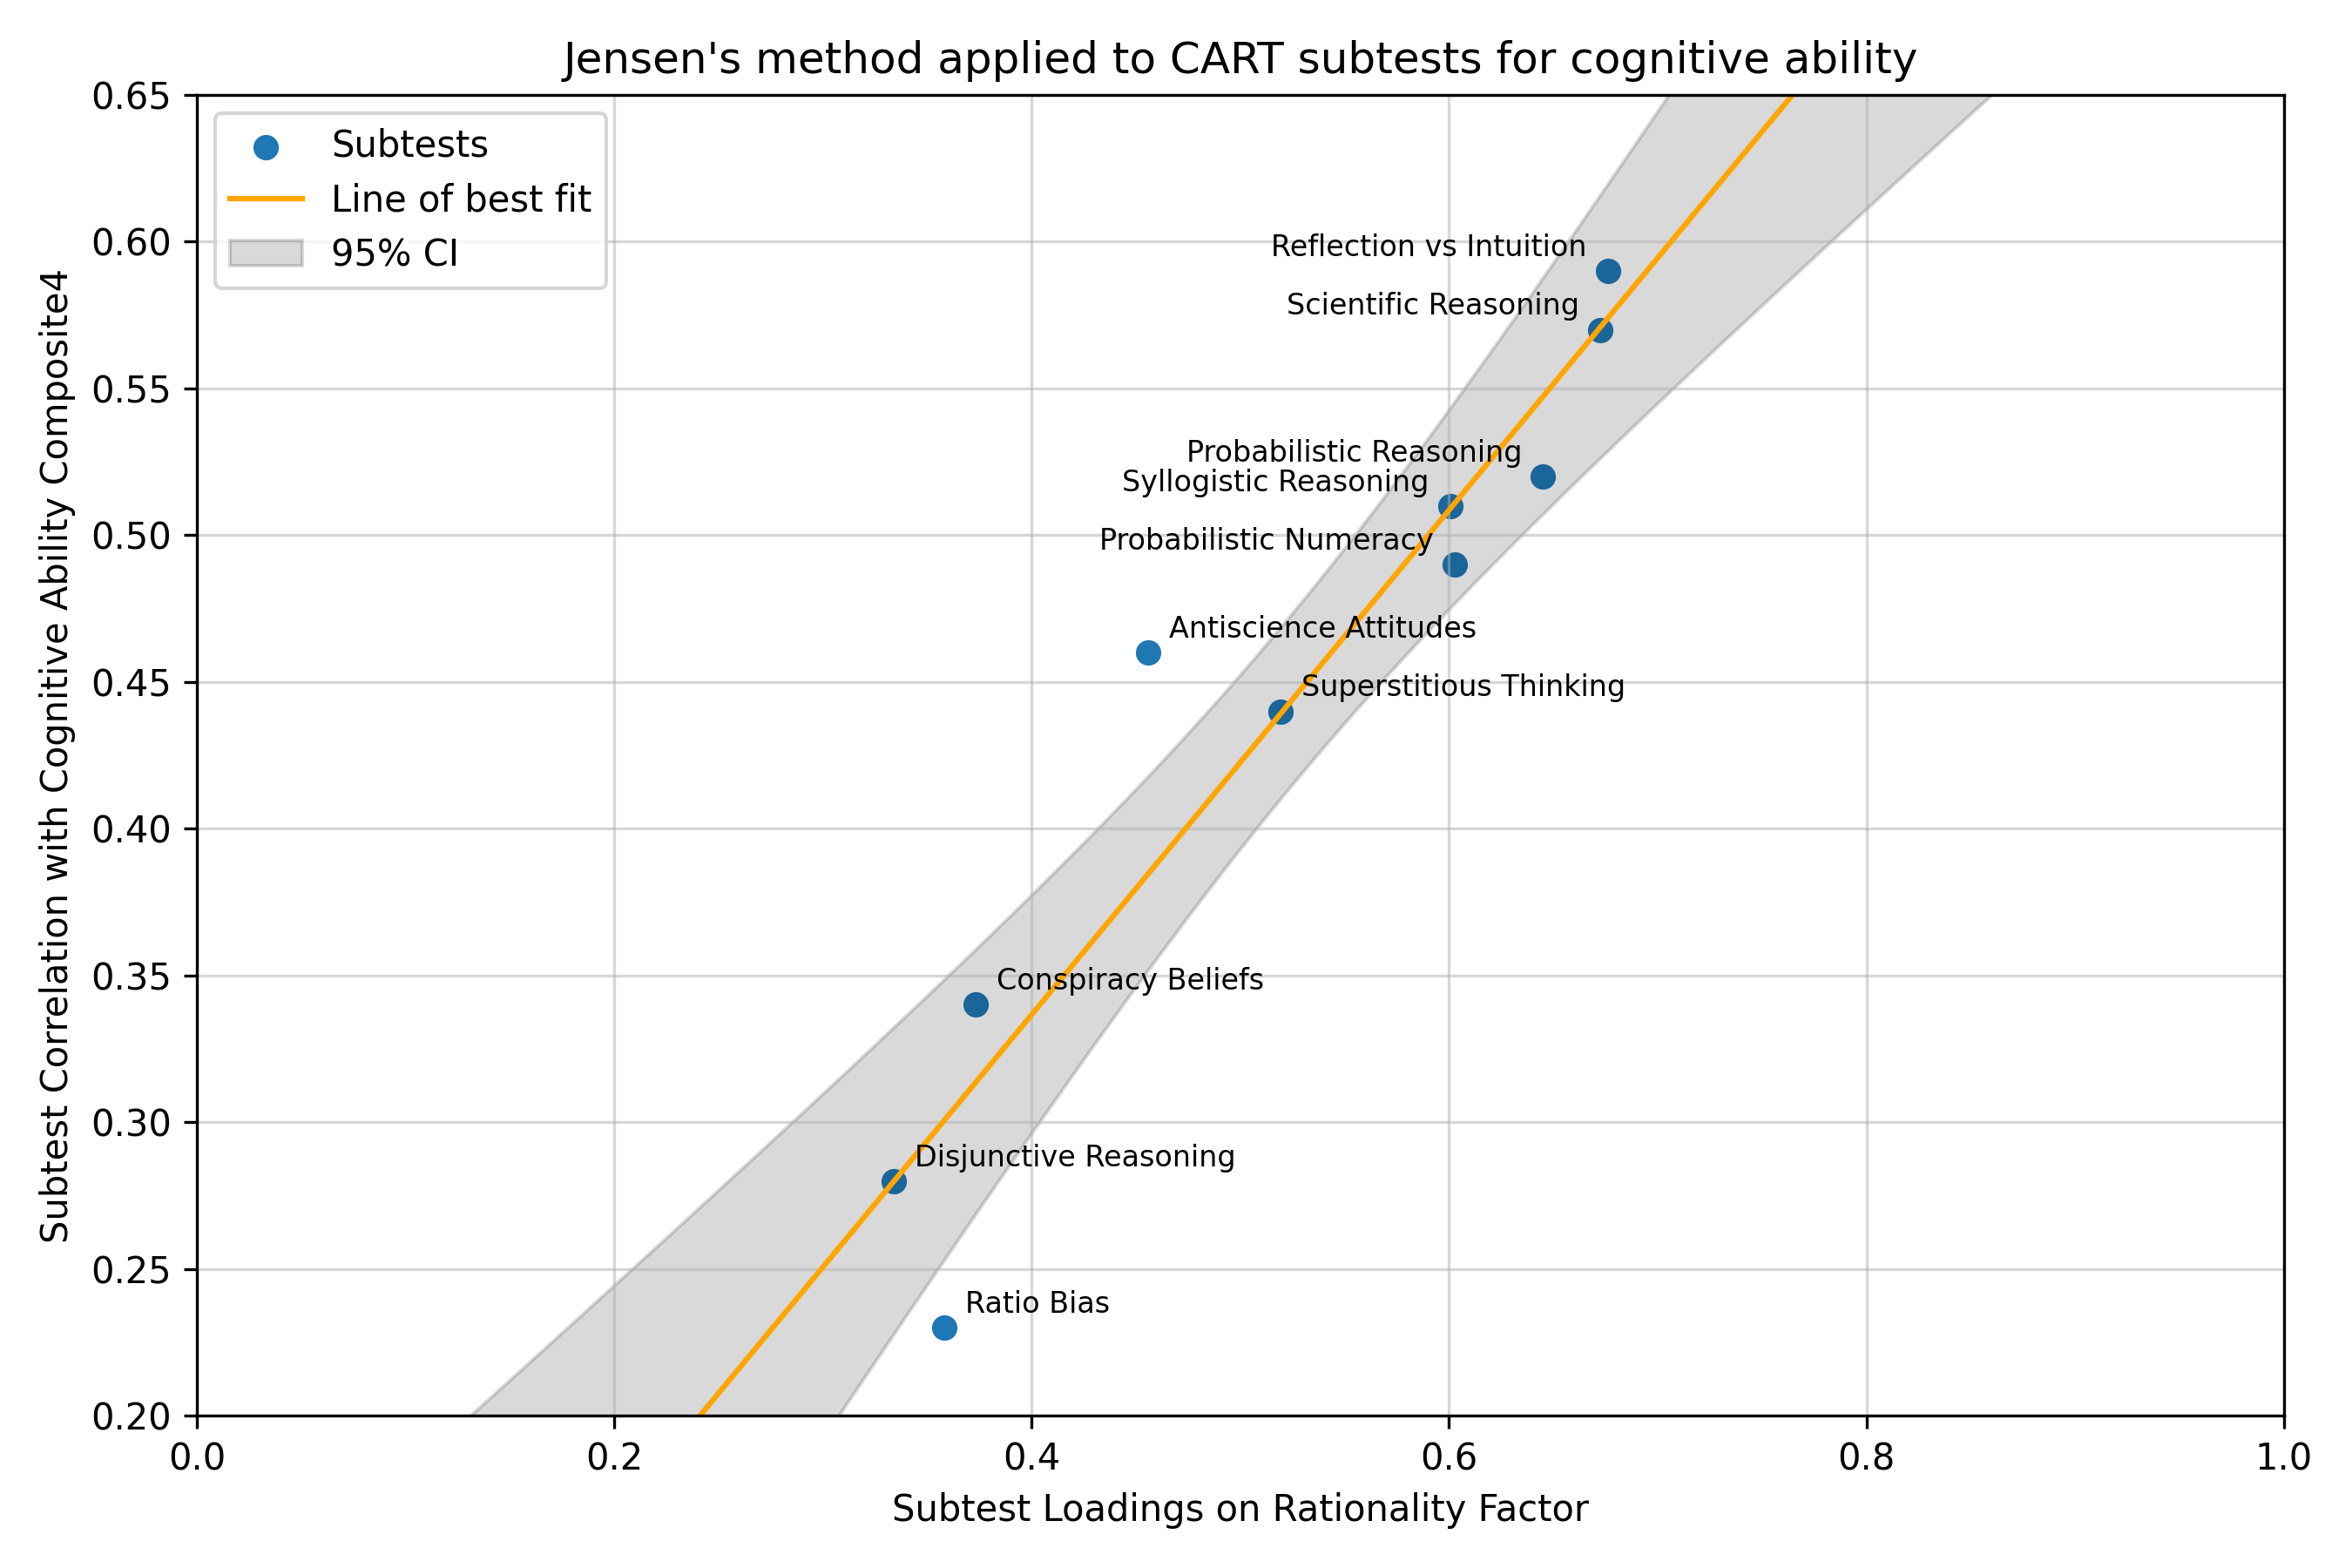
The x-axis shows each subtest’s loading on the extracted CART factor. The y-axis shows that subtest’s correlation with Cognitive Ability Composite4. The positive slope means that the subtests that most define the rationality factor are also the subtests most related to cognitive ability. This is what we would expect if the common CART factor is substantially g-like.
Two-Factor Model of the CART
What if, instead of extracting one factor from the CART, we extract two? Then we get two factors which I will call Analytic Thinking and Correct Beliefs. The loadings are as follows:
Analytic Thinking
- Reflection vs Intuition (0.70)
- Scientific Reasoning (0.68)
- Probabilistic Reasoning (0.65)
- Probabilistic Numeracy (0.62)
- Syllogistic Reasoning (0.61)
- Ratio Bias (0.37)
- Disjunctive Reasoning (0.34)
Correct Beliefs
- Superstitious Thinking (0.63)
- Antiscience Attitudes (0.56)
- Conspiracy Beliefs (0.53)
The estimated correlations among Cognitive Ability Composite4, Analytic Thinking, and Correct Beliefs are:
| Cognitive Ability Composite4 | Analytic Thinking | Correct Beliefs | |
|---|---|---|---|
| Cognitive Ability Composite4 | 1.00 | 0.81 | 0.72 |
| Analytic Thinking | 0.81 | 1.00 | 0.67 |
| Correct Beliefs | 0.72 | 0.67 | 1.00 |
Extracting two factors does not really rescue discriminant validity. The more analytic factor remains highly correlated with Cognitive Ability Composite4, and even the Correct Beliefs factor has a substantial correlation with cognitive ability. Splitting the CART into “thinking style” and “belief accuracy” makes the structure more interpretable, but it does not produce a rationality factor cleanly separable from intelligence.
Explanation of the CART Subtests
Probabilistic and Statistical Reasoning
The items in the Probablistic and Statistical Reasoning subtest assess:
- the ability to avoid probability matching tendencies and instead choose a maximizing strategy
- the ability to avoid the gambler’s fallacy
- the ability to properly assign probabilities to conjunctions
- sensitivity to base rates
- sensitivity to sample size considerations
- the ability to see regression to the mean as an explanation of performance changes
Scientific Reasoning
The items in the Scientific Reasoning subtest assess:
- falsification tendencies in the four-card selection task (two deontic and two nondeontic)
- knowledge of the logic of converging evidence
- the tendency to avoid drawing causal inferences from correlational evidence
- the tendency to accurately asses the likelyhood ratio by processing P(D/~H)
- the tendency to use control-group reasoning
- covariation detection ability
Reflection vs Intuition
Sample Items
- If it takes one minute to make each cut, how long will it take to cut a 25-foot wooden plank into 25 equal pieces?
- The number of bacteria in a container doubles each hour. If it takes 32 hours to completely fill the container, how many hours would it take for the bacteria to fill half of the container?
Belief Bias in Syllogistic Reasoning
Sample Item
Premise 1: All flowers are carbitops.
Premise 2: All tulips are carbitops.
Conclusion: All tulips are carbitops.
Does the conclusion necessarily follow form the premises?
Ratio Bias
Sample Item
Assume that you are presented with two trays of black and white marbles. The small ray contains 5 marbles (1 black and 4 white). The large tray contains 100 marbles (19 black and 81 white). The marbles inside each tray will be randomly mixed up, and you must draw out a single marble from each of the trays without looking. If you draw a black marble you win $5.
Which tray would you prefer to select a marble from?
Disjunctive Reasoning
Sample Item
A food warehouse ships boxes of fresh and frozen strawberries. Assume that your job is to make sure these boxes are stacked properly. A box of fresh strawberries should not touch a box of frozen strawberries, because direct contact with the colder box will cause the fresh strawberries to spoil. You find a stack of three boxes of strawberries, where the top box contains fresh strawberries and the bottom box contains frozen strawberries. However, the middle box of strawberries has no label, and, thus contains either fresh or frozen strawberries. Is a box of fresh strawberries touching a box of frozen strawberries?
Probabilistic Numeracy
Sample Items
- For a person over age 60, the chances of getting shingles at some time in their life is 0.06. Out of 30,000 people, over age 60, about how many of them can be expected to get shingles?
- Imagine that an unvaccinated person has a 10% chance of getting the flu and that the flu vaccine is 80% effective in preventing the flu. What are the chances that a person who has had the vaccine will still get the flu?
-
The name is a riff on IQ. ↩
-
For example, if we look at the paper, Scholastic Assessment or g? The Relationship Between the Scholastic Assessment Test and General Cognitive Ability, we see that in Study 1, the (corrected for nonlinearity) correlation between ASVAB and SAT scores was 0.85; in study 2, the (corrected for range restriction) correlation between SAT and Raven’s Matrices scores was 0.72. ↩
-
I estimated this from the published CART subtest correlation matrix and the published correlations between each subtest and Cognitive Ability Composite4. I fit a one-factor model to the CART subtests, treated Cognitive Ability Composite4 as an observed external variable, and estimated its correlation with the latent CART factor. The fit was acceptable (TLI = 0.89, CFI = 0.92, RMSEA = 0.07). The estimate was 0.85. This should be interpreted as an approximate, possibly underestimated, correlation between rationality and cognitive ability, since the cognitive ability measure itself was not modeled latently. ↩
-
To find the correlation between the two variables, we take the square root of the explained variance. The square root of 0.70 is approximately 0.84. As discussed by others, the correlation is a much better summary of the relationship between two variables than the explained variance. ↩
-
We can measure rationality-adjacent skills, but we do not yet seem to have a clean, validated measure of broad rationality that is both distinct from intelligence and useful for evaluating rationality interventions. ↩
-
What about narrow skills? It seems possible to measure and improve them, such as probability calibration. But, as with g, I doubt there is much far transfer. For example, becoming more calibrated in your probability estimates probably would not make you better at understanding trade-offs. That is, assuming rationality is even a single unified trait. ↩