Revisiting the 2012 LessWrong Personality Results
If you ask an LLM what the personality profile of rationalists is, they’ll probably direct you to the 2012 LW Survey results, which state:
mean+standard_deviation (25% level, 50% level/median, 75% level) [n = number of data points]
[…]
Big 5 (O): 60.6 + 25.7 (41, 65, 84) [n = 453]
Big 5 (C): 35.2 + 27.5 (10, 30, 58) [n = 453]
Big 5 (E): 30.3 + 26.7 (7, 22, 48) [n = 454]
Big 5 (A): 41 + 28.3 (17, 38, 63) [n = 453]
Big 5 (N): 36.6 + 29 (11, 27, 60) [n = 449]
So, it looks like rats are more Open than average, and less Conscientious, Extraverted, Agreeable, and Neurotic than average, but even then, the differences aren’t that large. If we convert the median percentiles to z-scores, we get:
| Trait | Median percentile | Corresponding z-score |
|---|---|---|
| Openness | 65th | +0.39 |
| Conscientiousness | 30th | −0.52 |
| Extraversion | 22nd | −0.77 |
| Agreeableness | 38th | −0.31 |
| Neuroticism | 27th | −0.61 |
So, it doesn’t seem like rats are that different from the general population in personality. Except, I don’t buy that. Rats are weird. They talk about weird things, do weird things, and take weird ideas seriously. So, for a trait like Openness, I’d expect rats to be much higher than just 0.39 SD above the population mean. There must be something going on.
The problem is the online personality test’s norms. The 2012 survey instructed respondents to take the OutOfService BFI-44 test1 and enter the percentiles it gave them. If the test’s norms come from people who take personality tests online rather than the general population, those percentiles could make rats look more ordinary than they are. To check, we’d want to compare LessWrong’s raw scores with those of a more representative sample. Unfortunately, the survey only collected percentiles. Foretunately, VincentYu found the means and SDs the test used which allows me to recover most of the trait scores in the public survey data.2
For my representative sample, I’ll use Bogg & Vo (2014). They administered the BFI-44 to a weighted, probability-based U.S. sample (N = 1,015). So, how do LessWrong’s raw scores compare with the test’s assumed means and the U.S. sample’s means? Here they are:
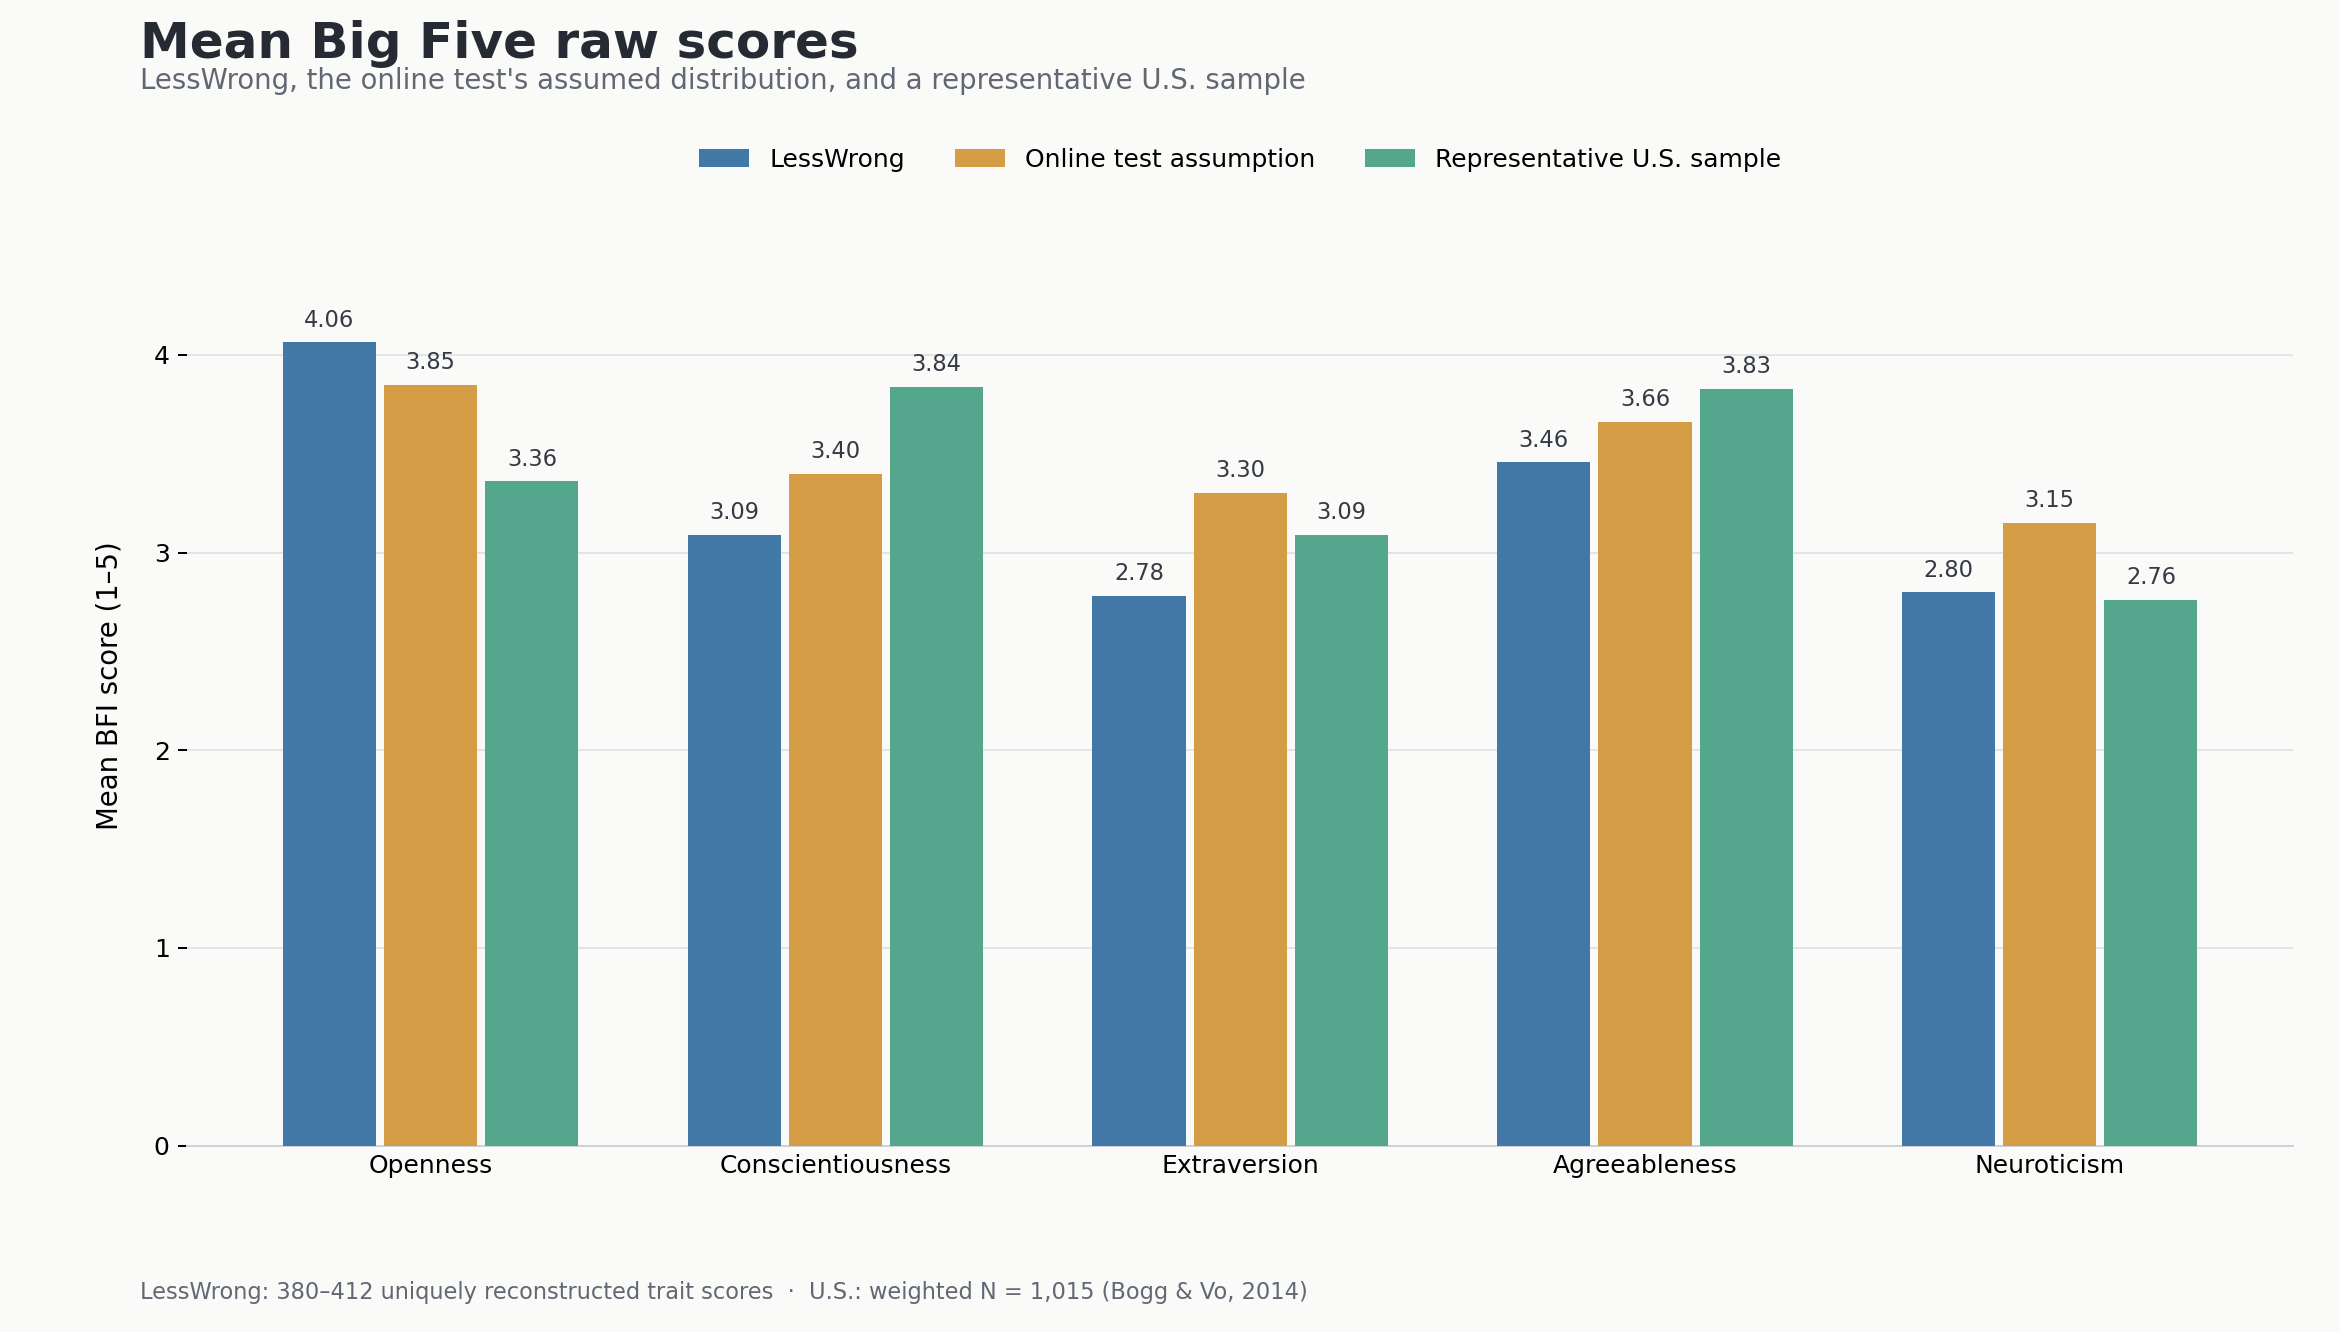
As you can see, the online test assumed higher average Openness and lower average Conscientiousness and Agreeableness than the U.S. sample, so it made LessWrong’s differences on those traits look smaller. And while the online test made rats look less Neurotic than average, their mean is almost exactly the U.S. mean.
So, using the U.S. means and SDs, the median LessWrong score on each trait comes out to roughly:3
- 88th percentile (+1.2 SD) on Openness
- 10th percentile (−1.3 SD) on Conscientiousness
- 27th percentile (−0.6 SD) on Extraversion
- 28th percentile (−0.6 SD) on Agreeableness
- 50th percentile (0 SD) on Neuroticism
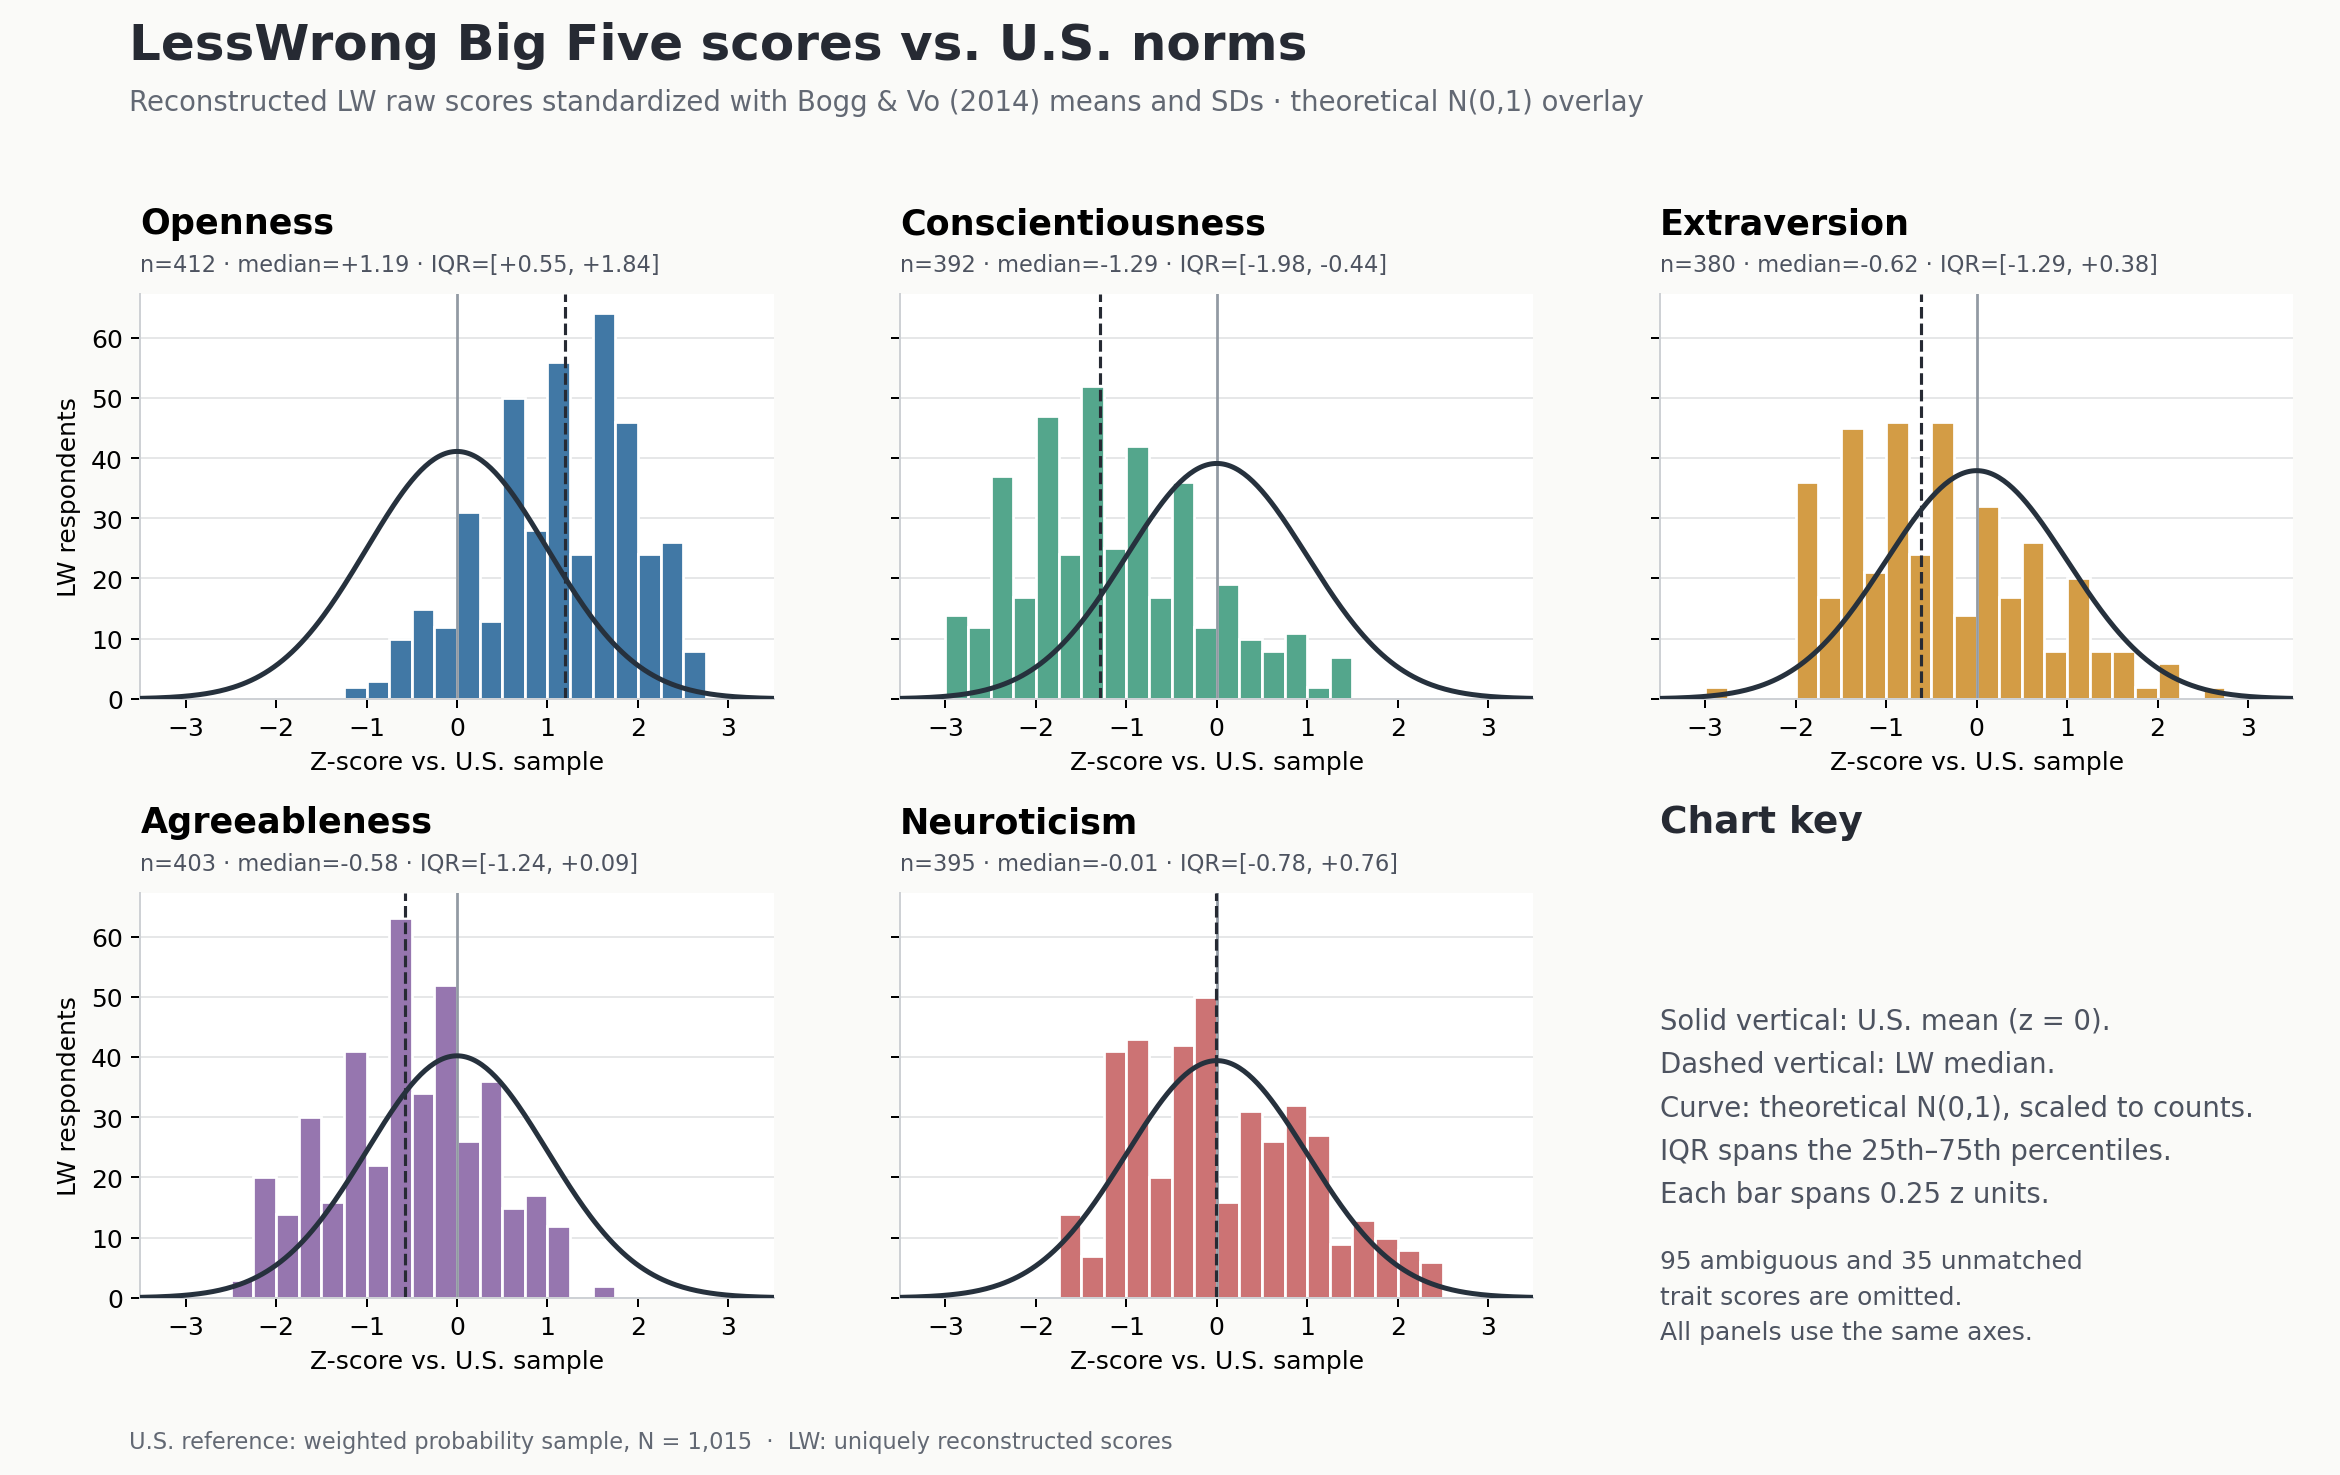
The revised scores now match my intuitive sense of LessWrong users. LessWrong covers ideas outside the norm, and the Openness score now reflects that. Additionally, many users reported suffering from akrasia, which is also now reflected in the revised Conscientiousness score.
What lesson should we draw from this? Perhaps, when an online test gives you a percentile, ask: compared with whom? If the comparison group is unusual (which it usually is), that number will give you a misleading picture of where you stand in relation to the the general population.
-
Yes, that’s the name of the website. Interestingly enough, it’s still in service years later. ↩
-
VincentYu reported the test’s assumed means (SDs) on the 1–5 scale: O 3.85 (0.65), C 3.40 (0.76), E 3.30 (0.88), A 3.66 (0.70), and N 3.15 (0.85). I inverted the Gaussian percentile mapping over the BFI’s possible scores, allowing for rounding in the published parameters. Of 2,112 nonmissing trait responses, 1,982 (94%) had a unique match; 95 were ambiguous and 35 unmatched. The charts omit the latter two groups. ↩
-
Each z-score is the median reconstructed LessWrong raw score minus the U.S. mean, divided by the U.S. SD. The percentiles assume a normal U.S. score distribution; they are not empirical percentiles from Bogg & Vo’s sample. The opening table uses the survey’s reported median percentiles, while these medians use only scores that could be uniquely reconstructed from the public data. ↩