Rationalist(-Adjacent) Demographics
Table of Contents
Gender
LessWrong1
Slate Star Codex / Astral Codex Ten2
Effective Altruism3
Summary
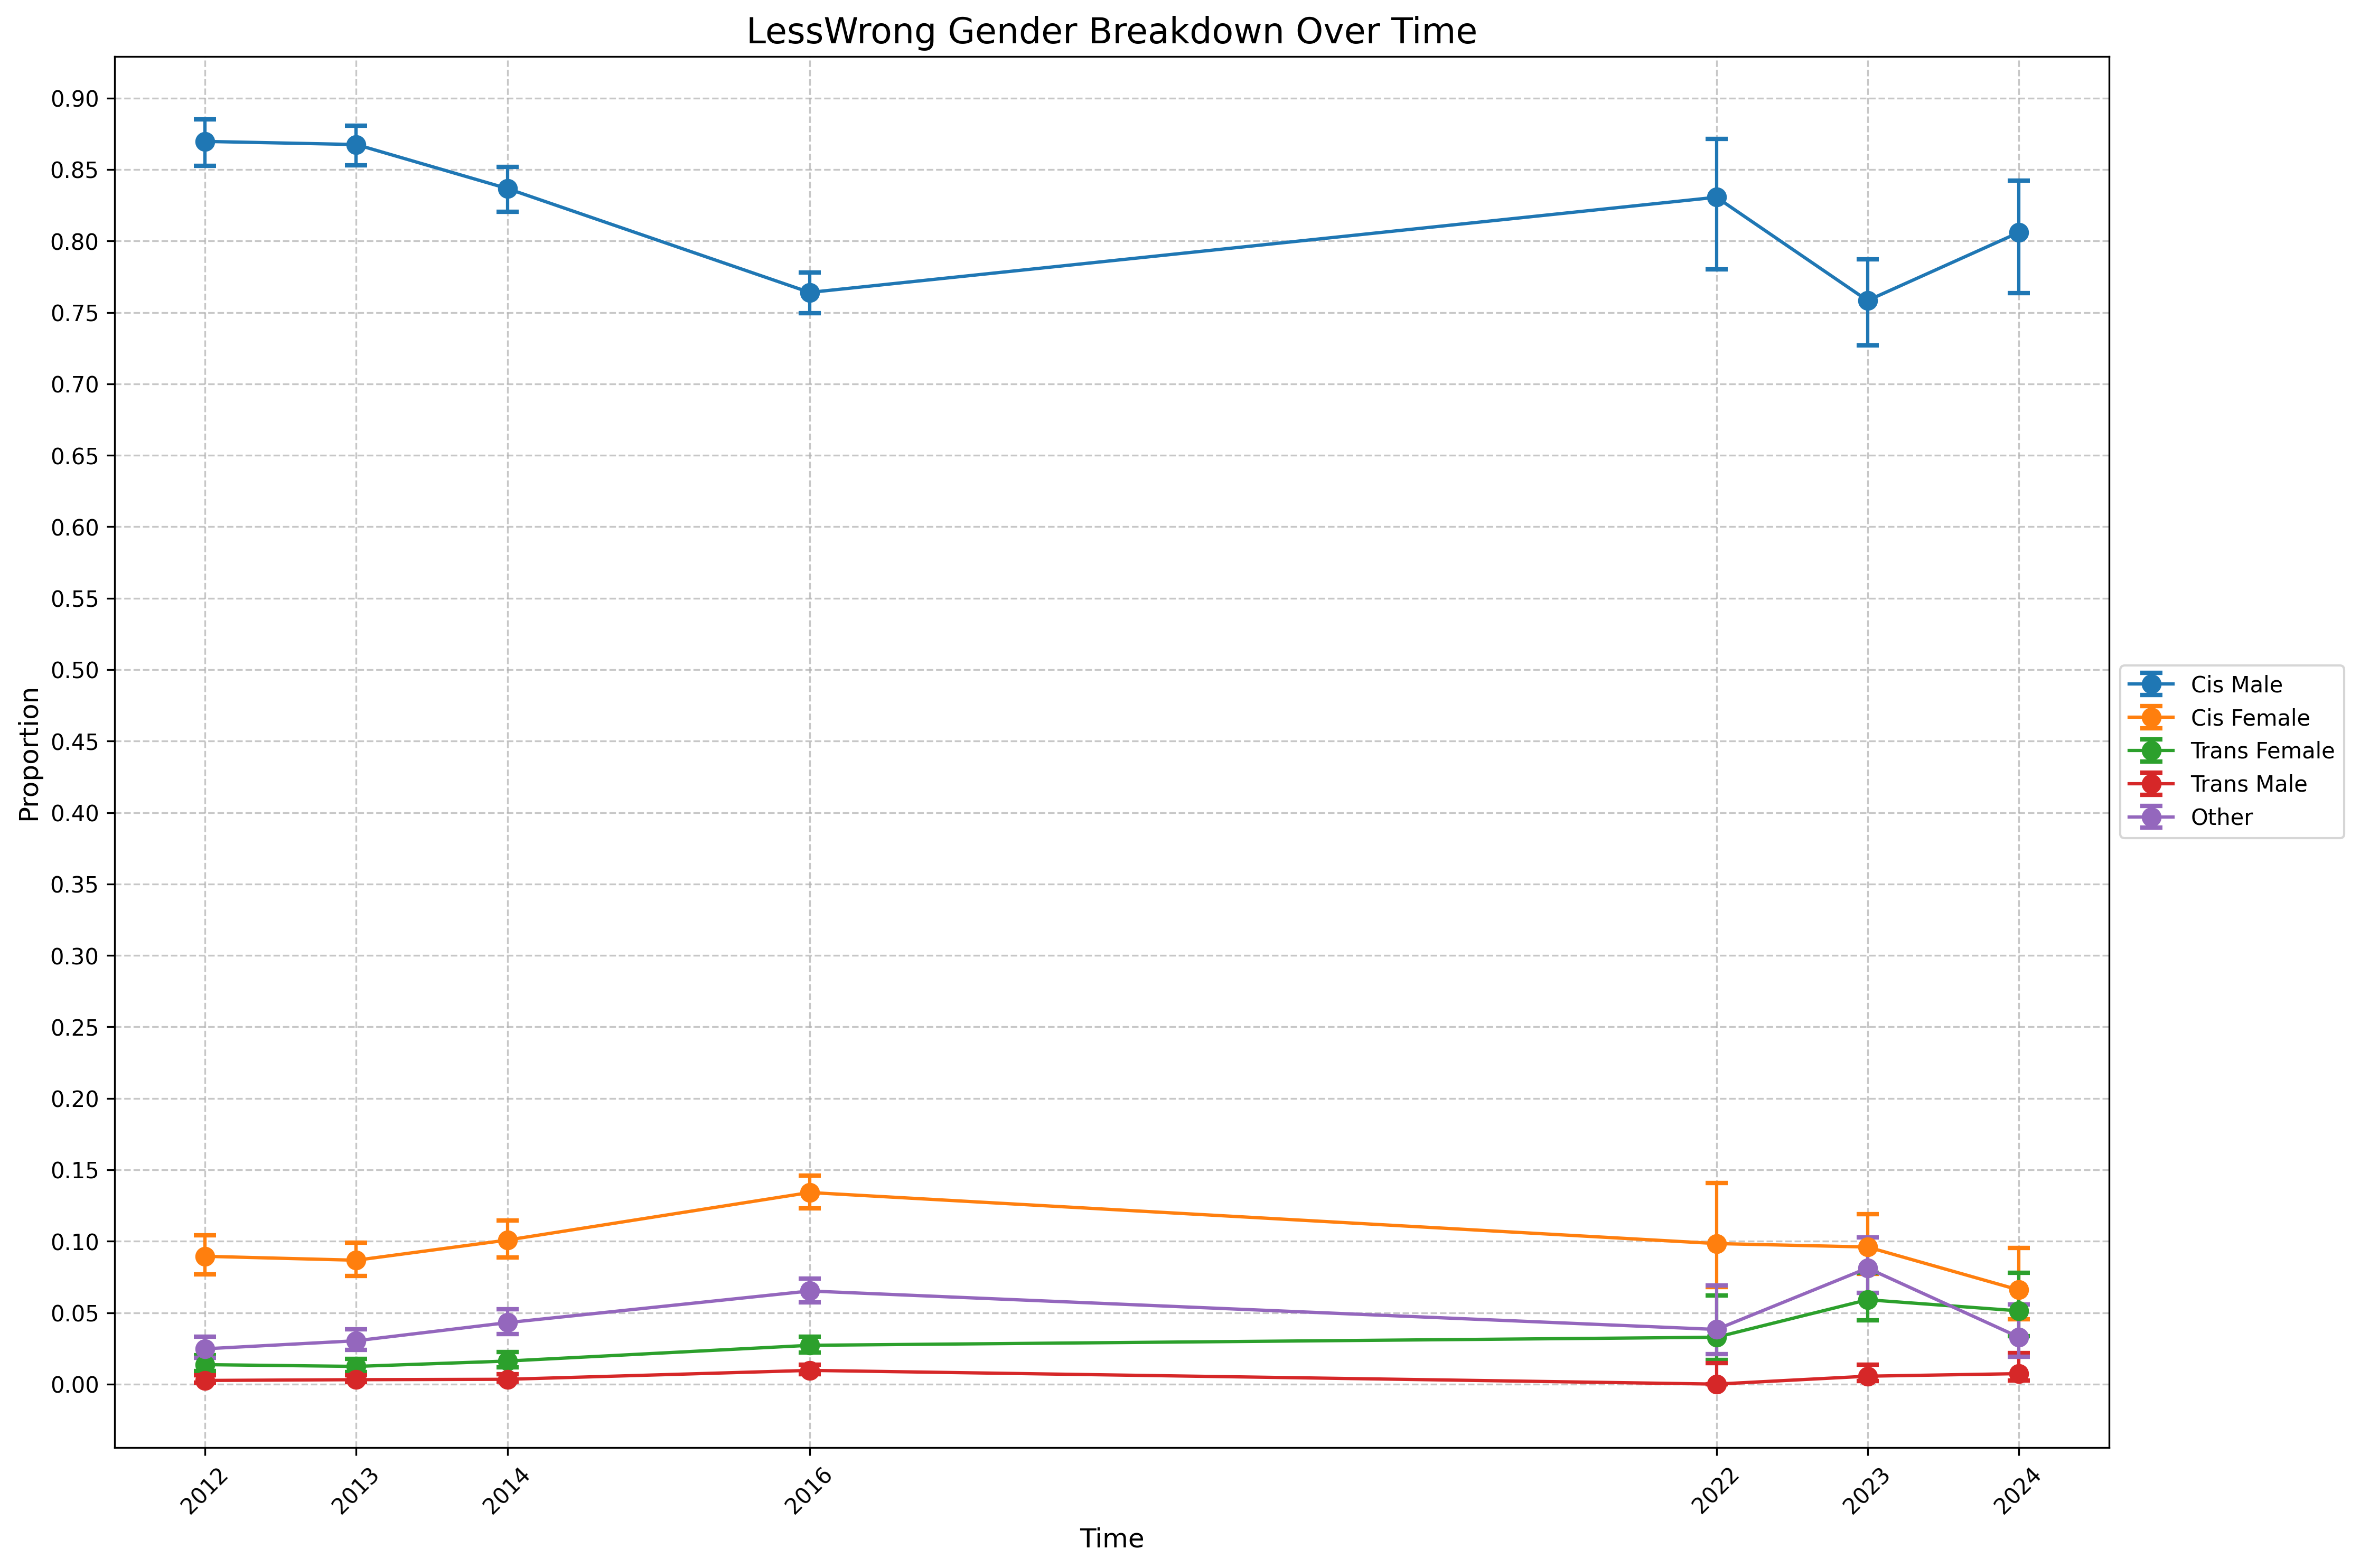
The LessWrong gender proportions are somewhat erratic. There’s a dip in the proportion of cis males in 2016, likely caused by the survey being sent to the broader LessWrong diaspora rather than the LessWrong site specifically. Another dip in cis men occurs in 2023, corresponding to a spike in “Other” responses, though the cause is unknown. Ignoring those anomalies, from 2012 to 2024, there’s been a steady, slight decrease in cis males (~6 percentage points, from 87% to 81%) and an increase in trans females (~4 percentage points, from 1.4% to 5.1%—an approximately fourfold increase).
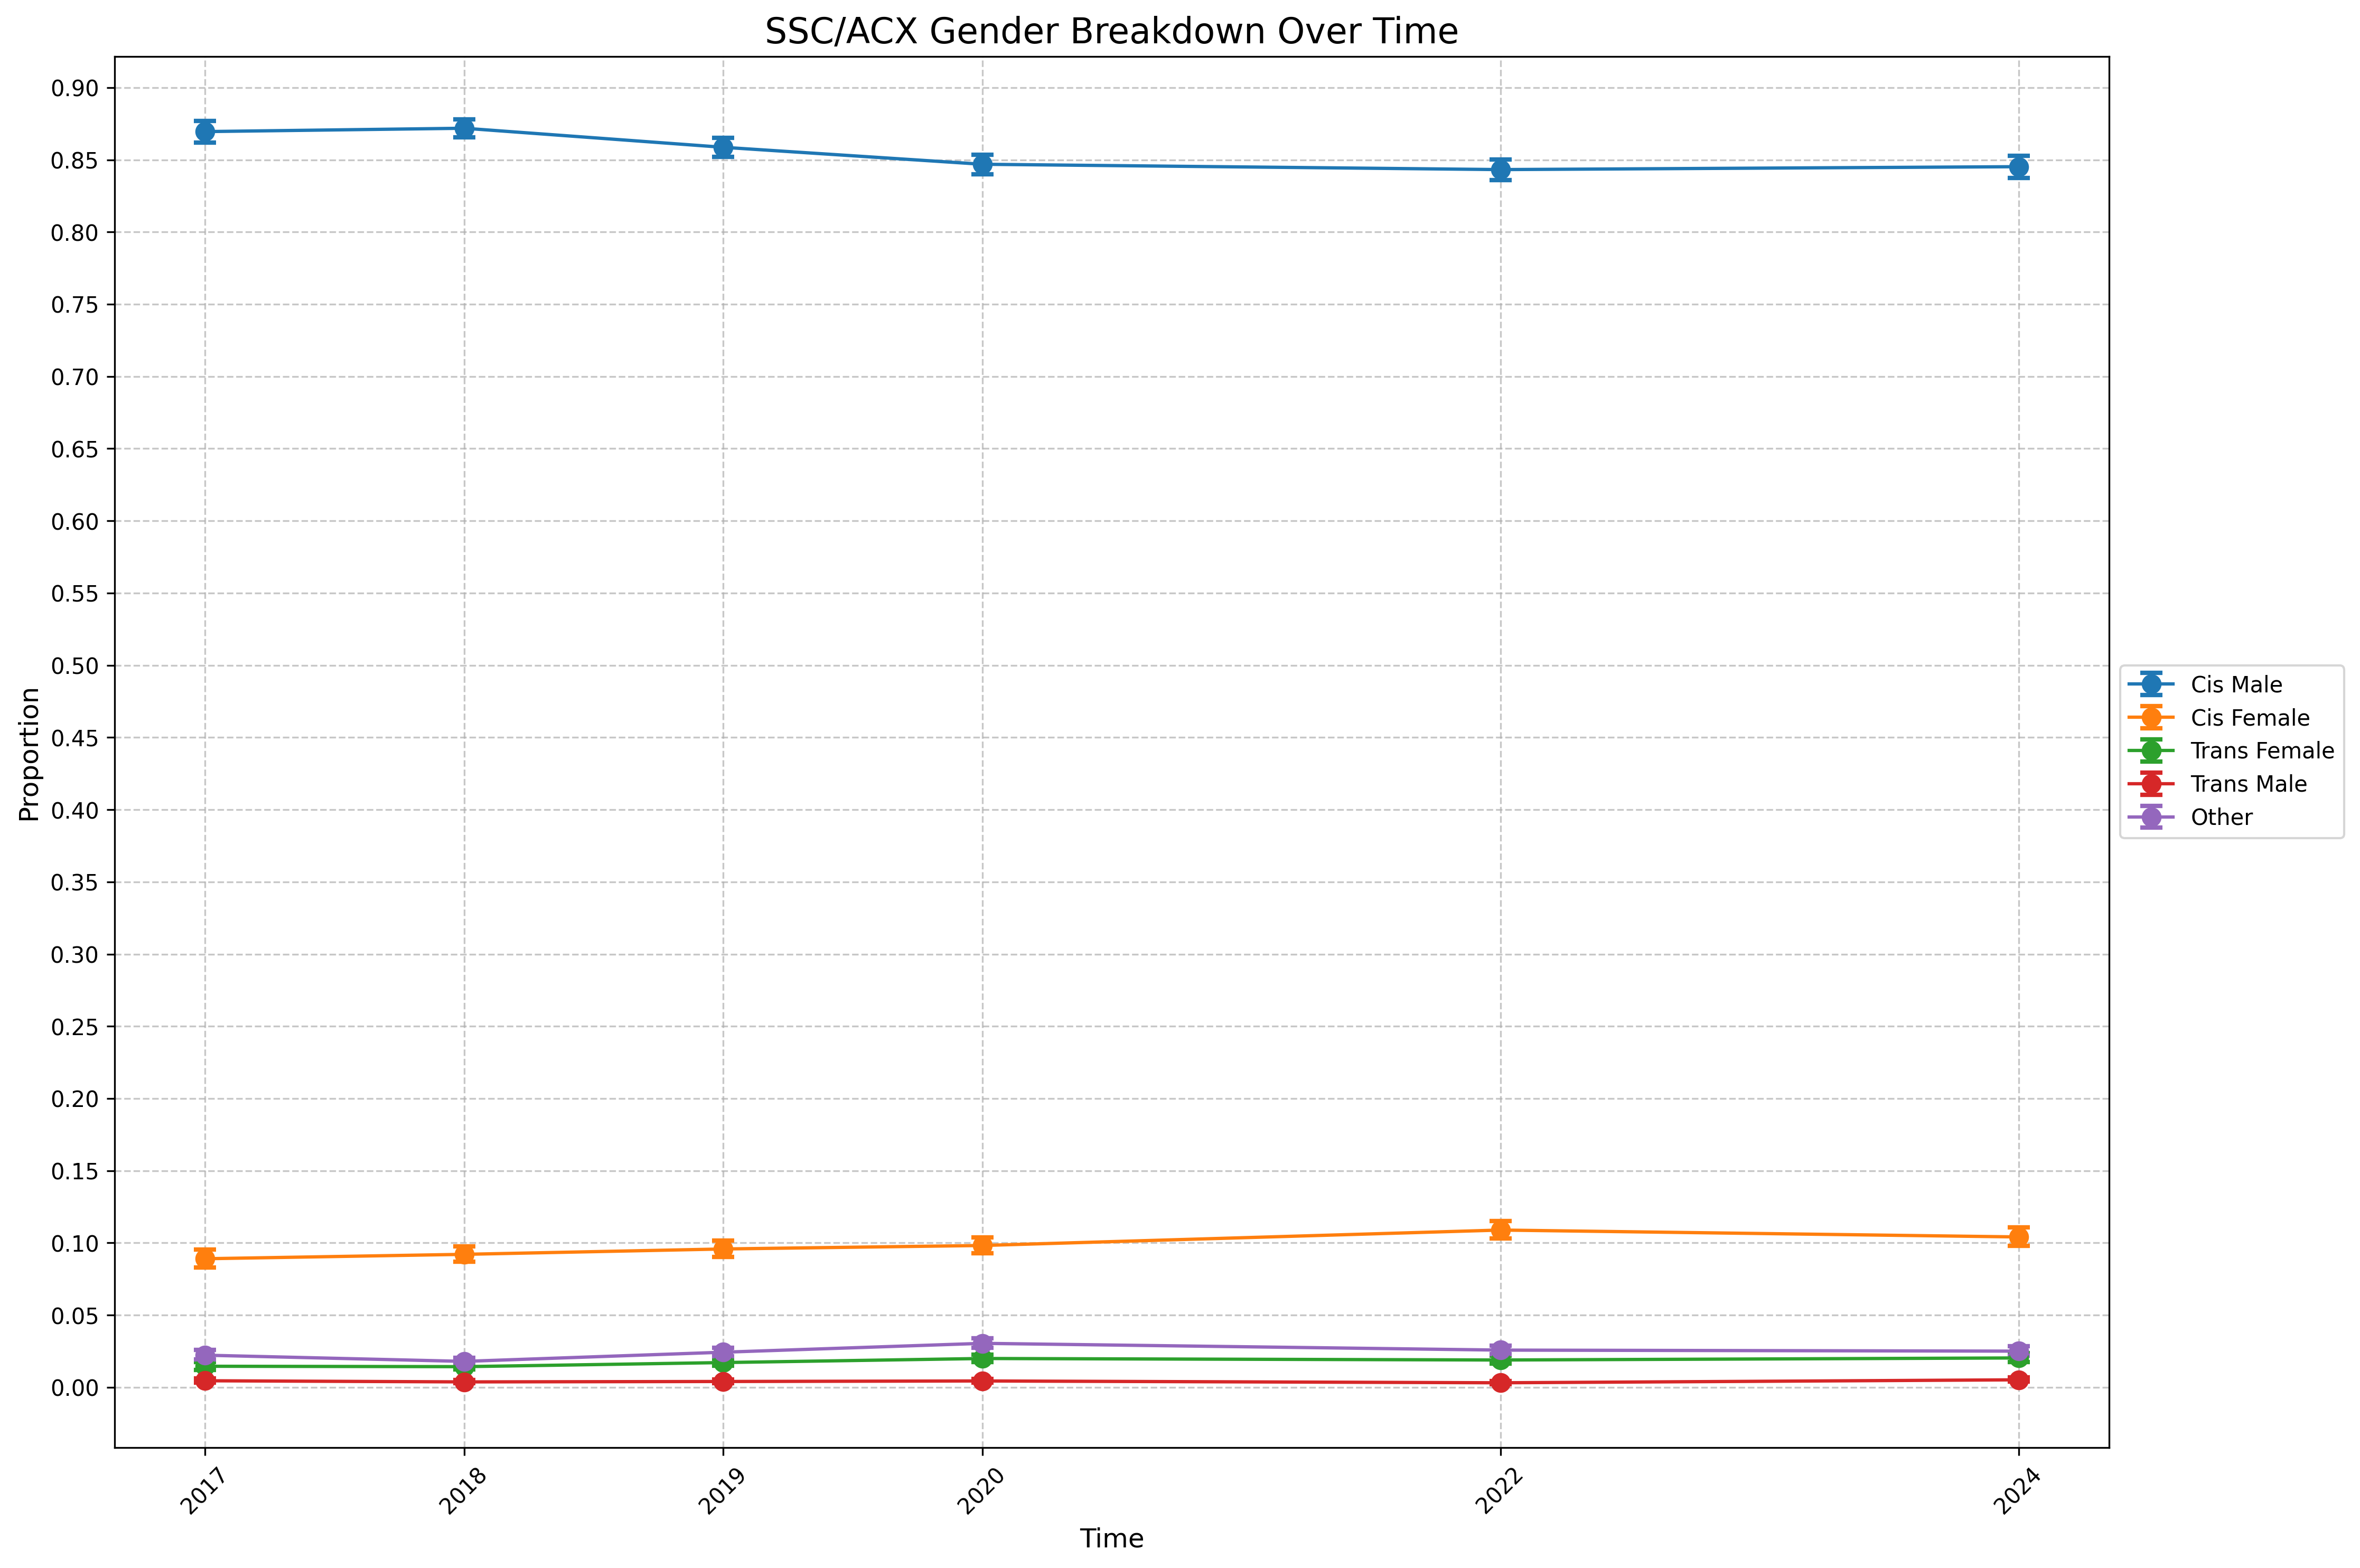
SSC/ACX gender proportions have remained remarkably stable from 2017 to 2024, with ~85% cis males, ~10% cis females, ~2% trans females, ~0.5% trans males, and ~2.5% selecting “Other.”
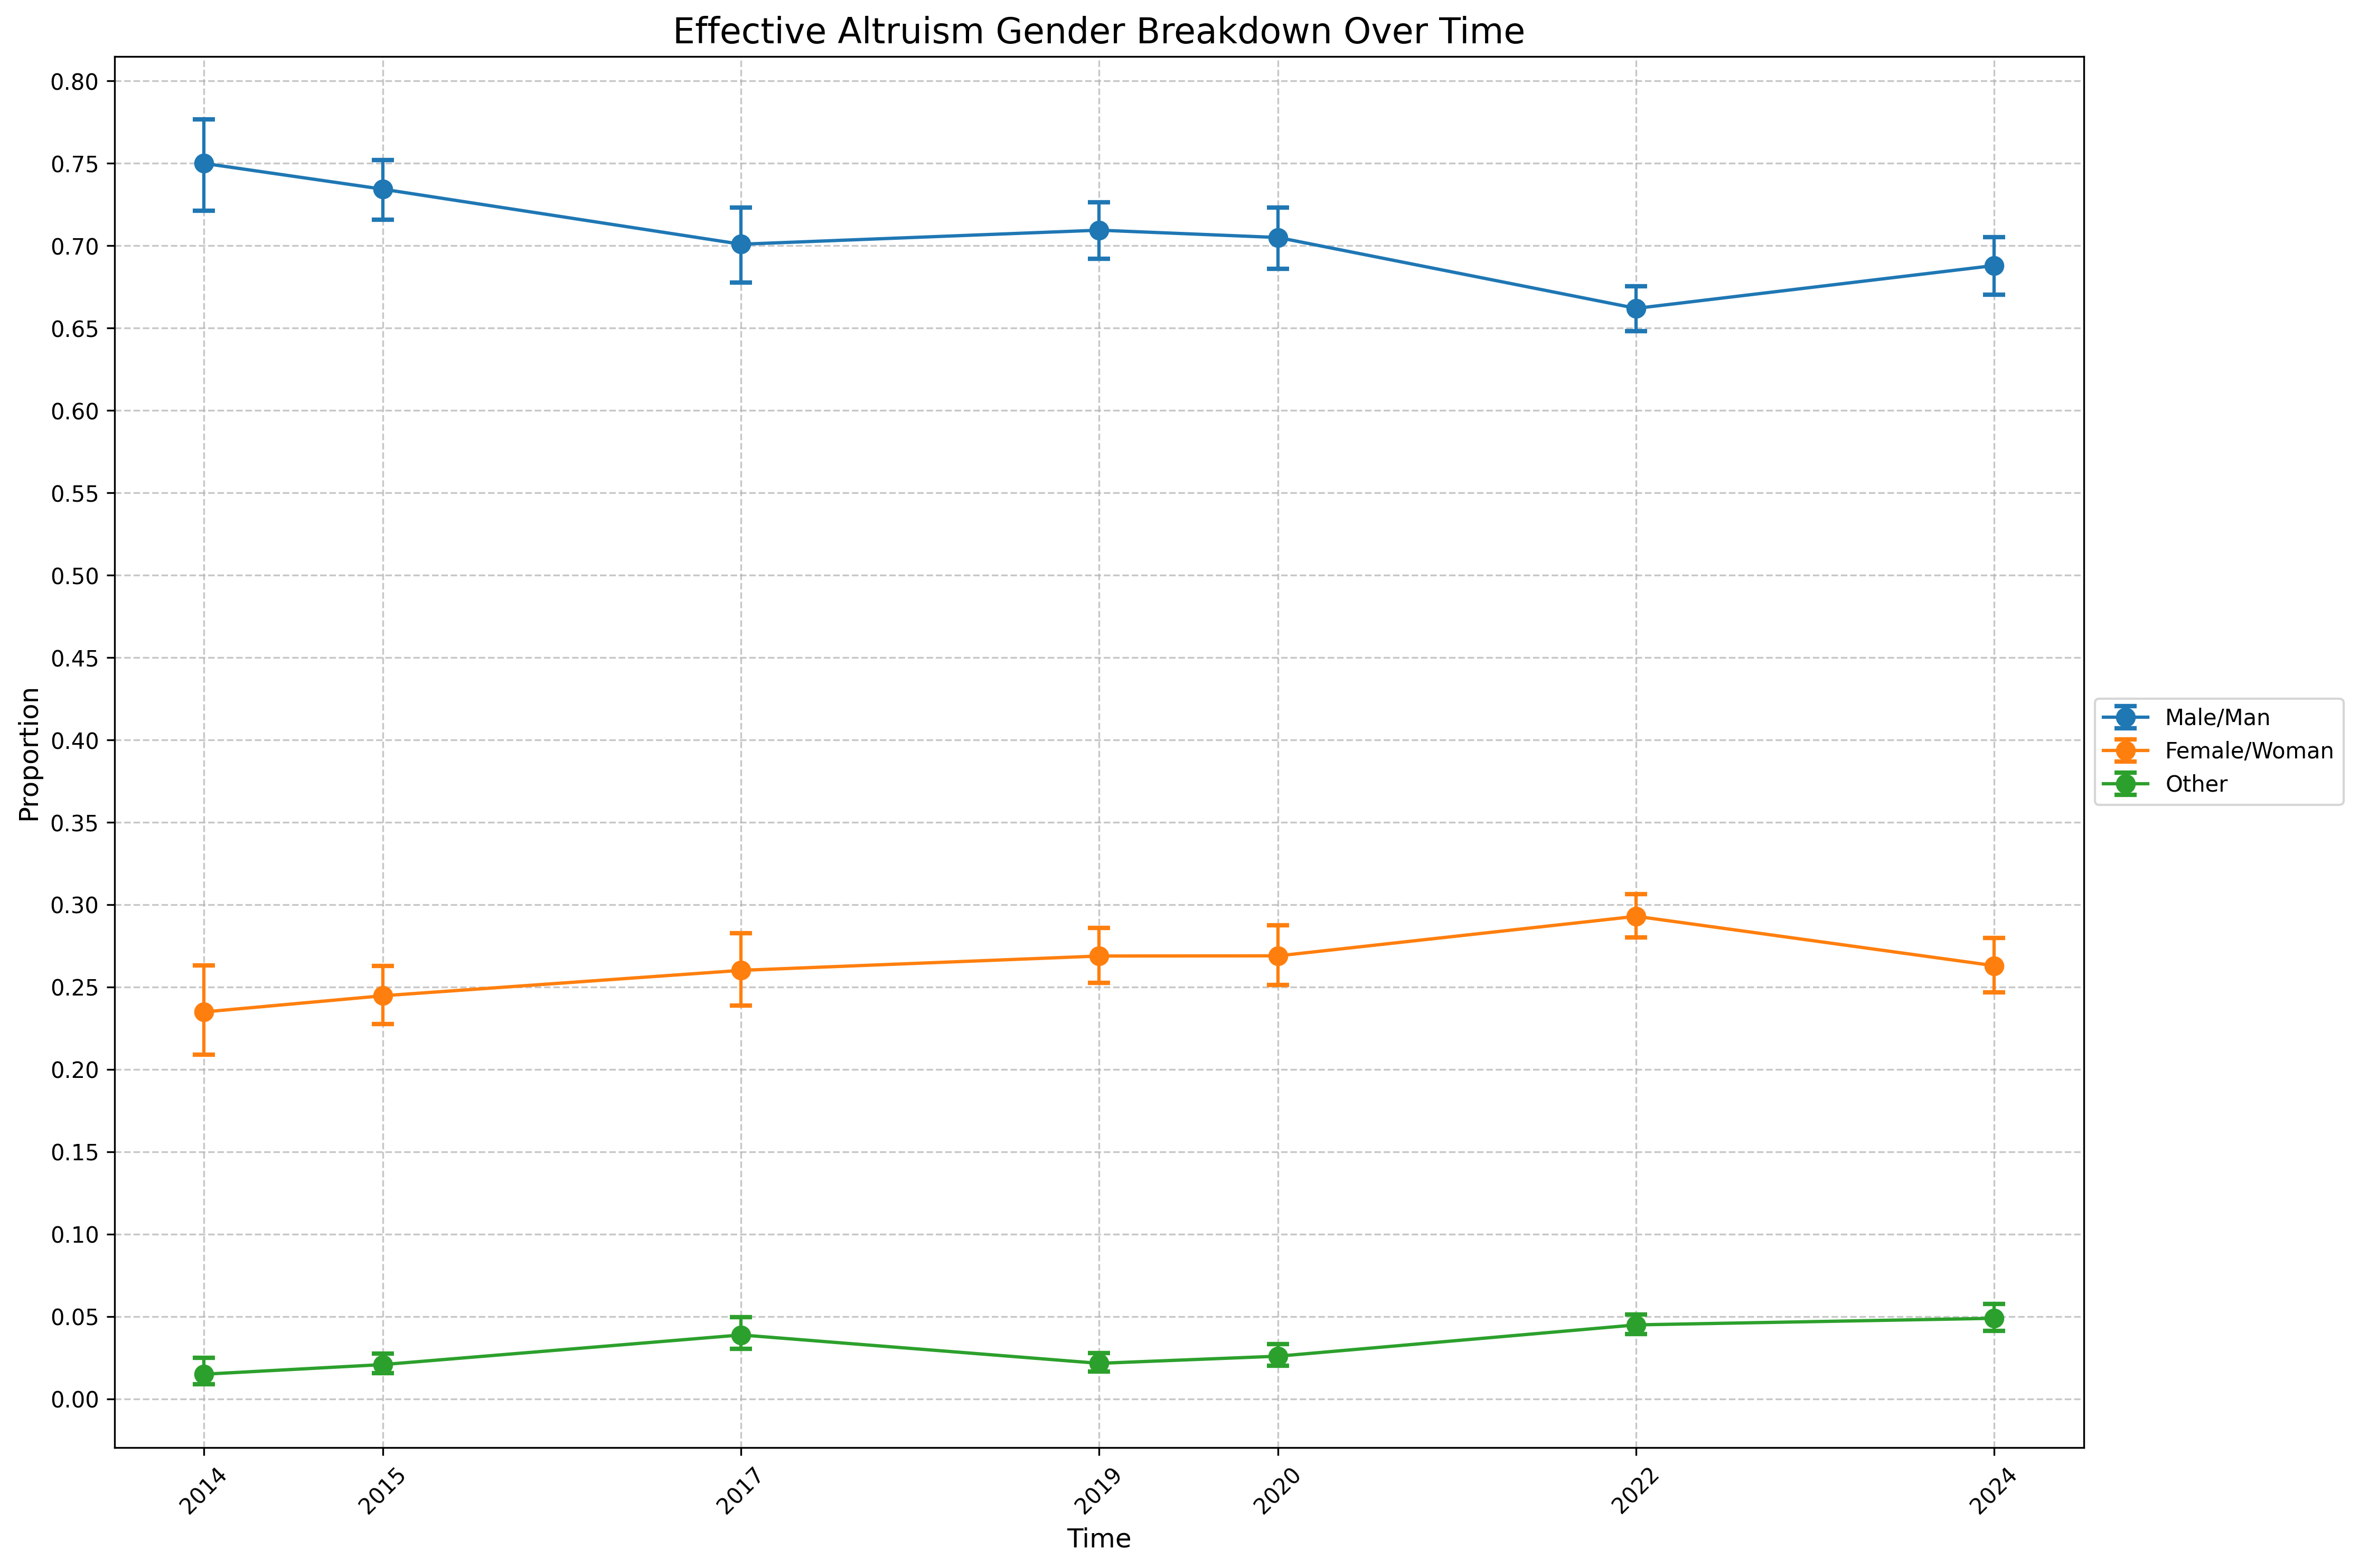
EA gender proportions have also been mostly stable over the past decade, though with a slight decline in men (75% → 69%), a slight increase in women (23.5% → 26%), and a slight rise in “Other” responses (1.5% → 5%).
Overall, SSC/ACX is the most cis-male-dominated community, followed closely by LessWrong, while EA is somewhat closer (yet still far) from equality.
Race
LessWrong4
Slate Star Codex / Astral Codex Ten5
Effective Altruism6
Summary
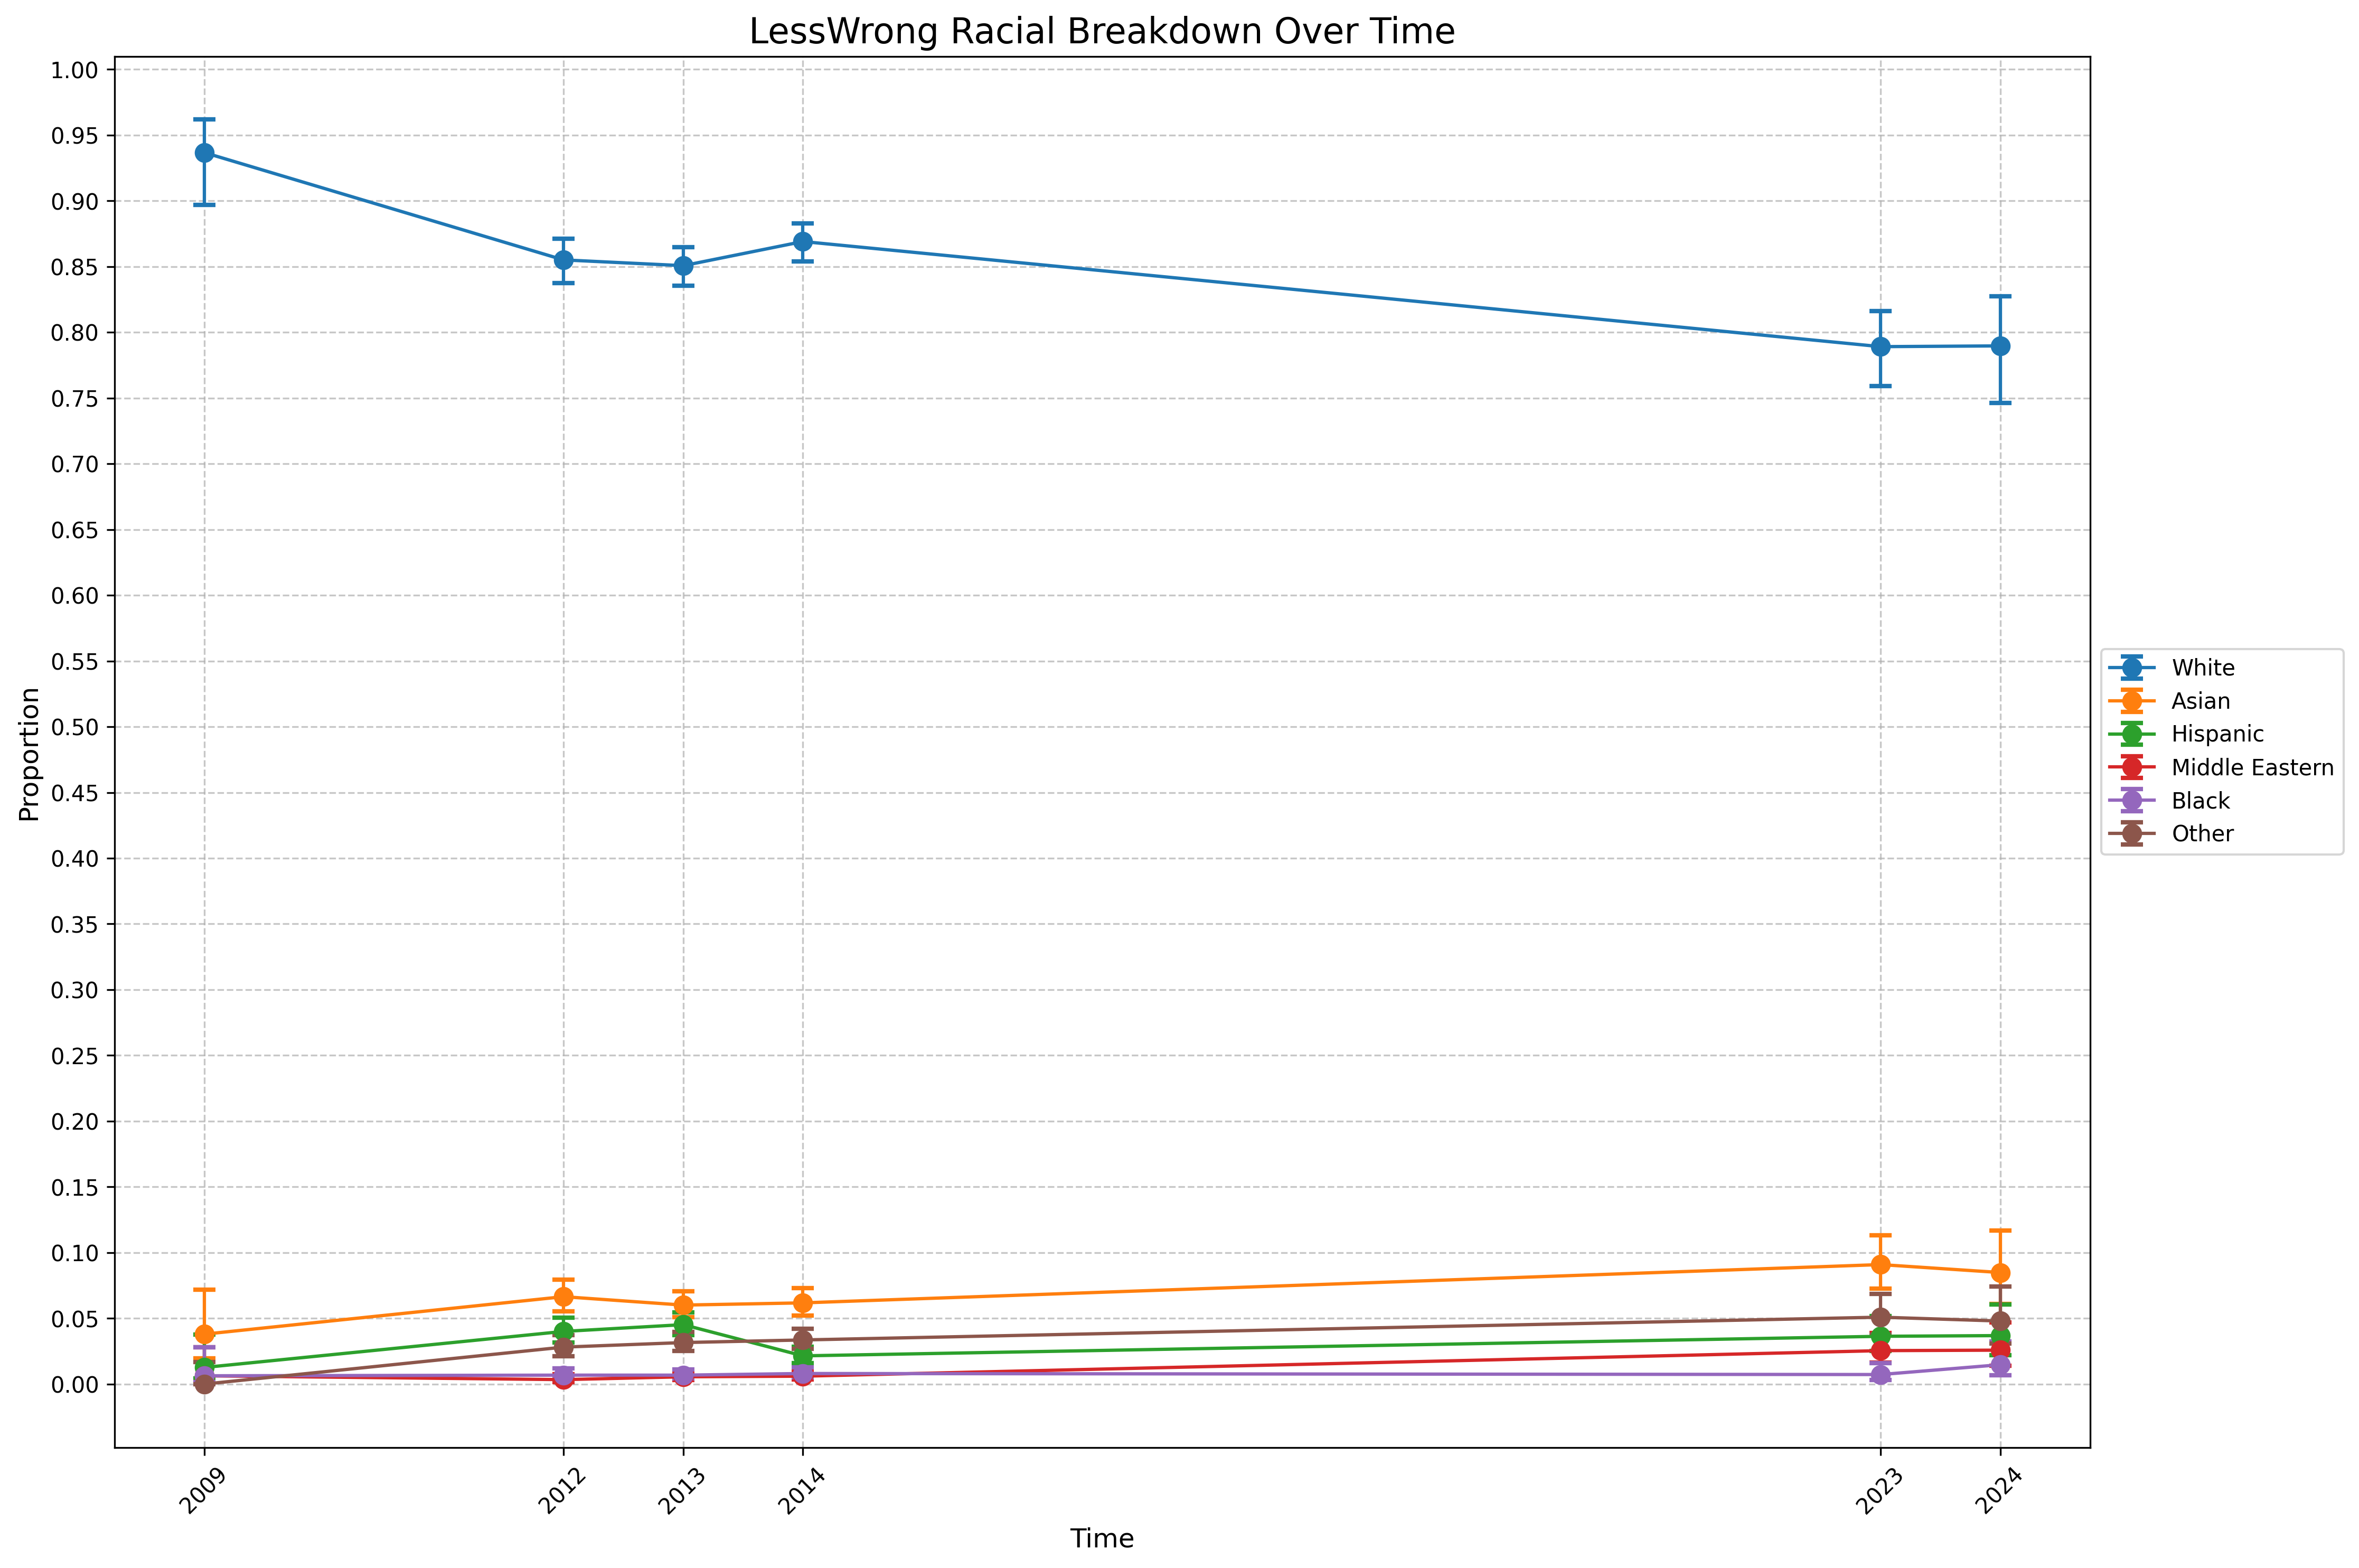
The 2009 LessWrong racial proportions were atypical, with 94% of survey respondents identifying as White—significantly higher than any other year. By 2012, that proportion had declined to 86%. From 2012 to 2024, LessWrong saw a steady decrease in the proportion of White respondents (~8 percentage points, from 86% to 78%), alongside increases in Asians (~2 percentage points, from 6.6% to 8.5%), Middle Easterners (~2 percentage points, from 0.3% to 2.6%), and those selecting “Other” (~2 percentage points, from 2.8% to 4.8%).
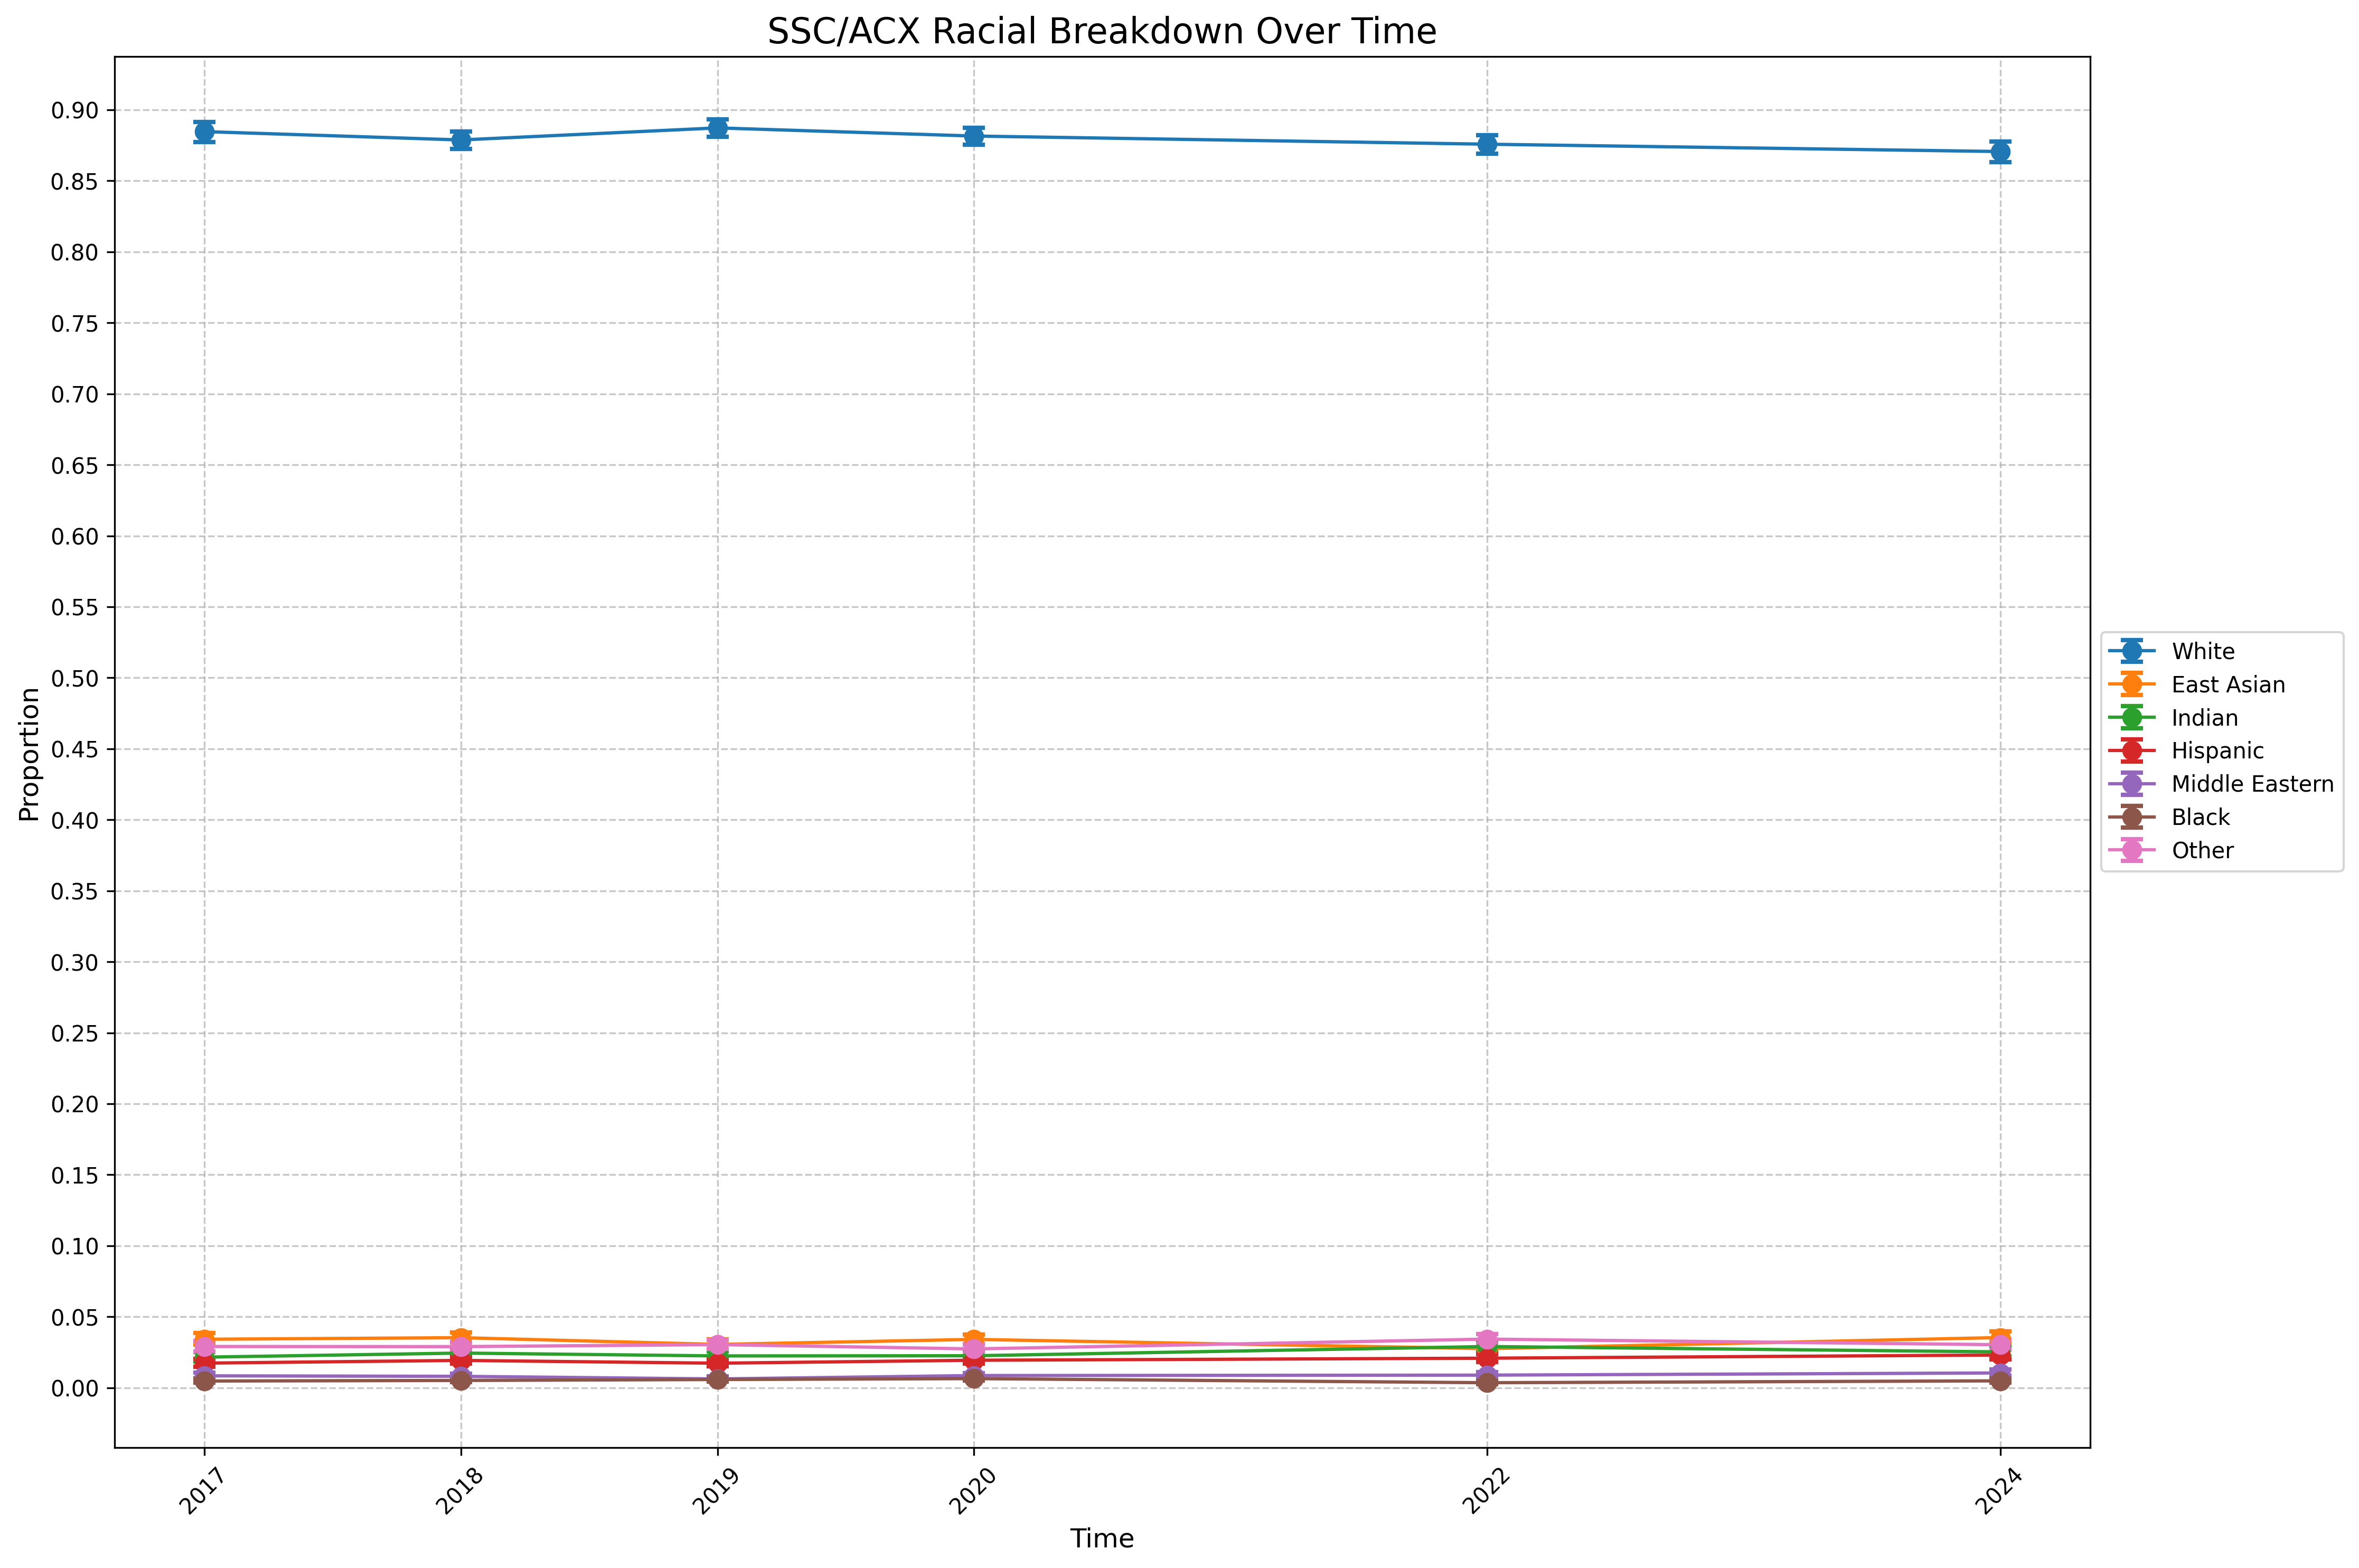
In contrast, SSC/ACX racial proportions have remained stable from 2017 to 2024: ~87% White, ~6% Asian (3.5% East Asian + 2.5% Indian), 2.3% Hispanic, 1.0% Middle Eastern, 0.5% Black, and 3.0% selecting “Other”.
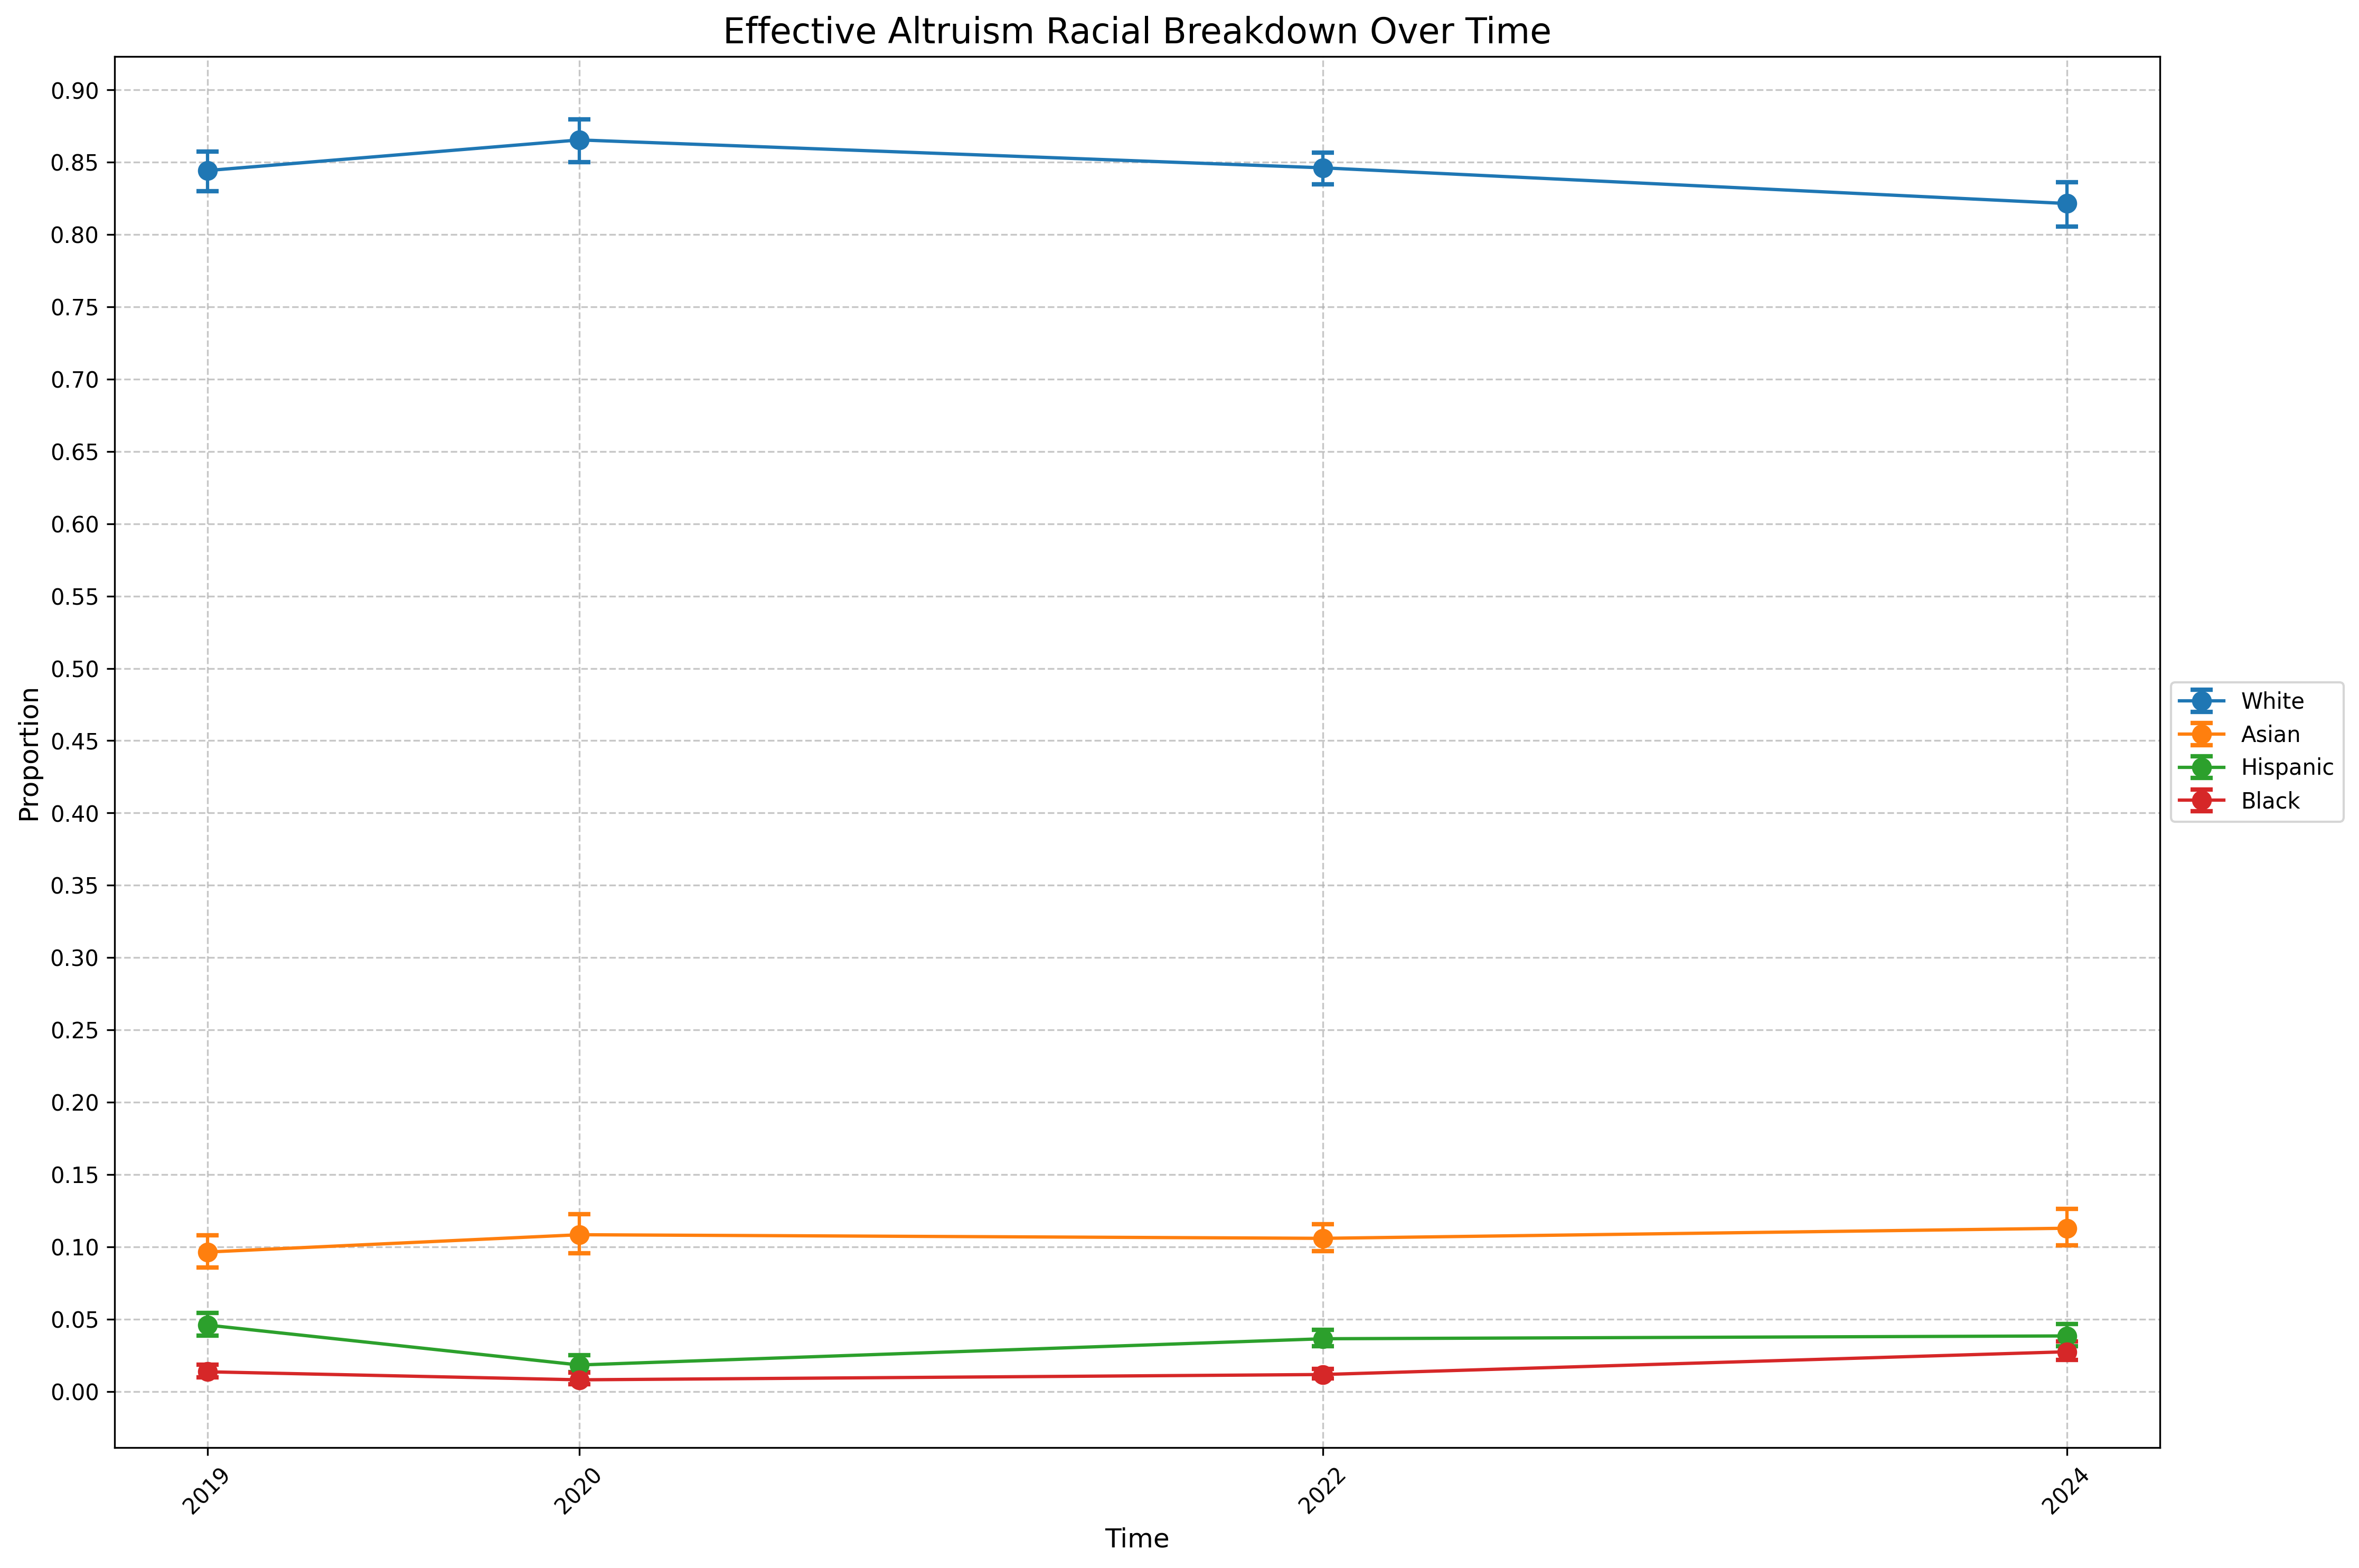
Similarly, EA racial demographics (tracking White, Black, Hispanic, and Asian respondents) have been stable from 2019 to 2024: ~82% White, ~11% Asian, ~4% Hispanic, and ~3% Black.
Overall, both LessWrong and SSC/ACX remain heavily White-dominated, while EA is slightly more diverse—though still predominantly White.
Religion
LessWrong7
Slate Star Codex / Astral Codex Ten8
Effective Altruism9
Summary
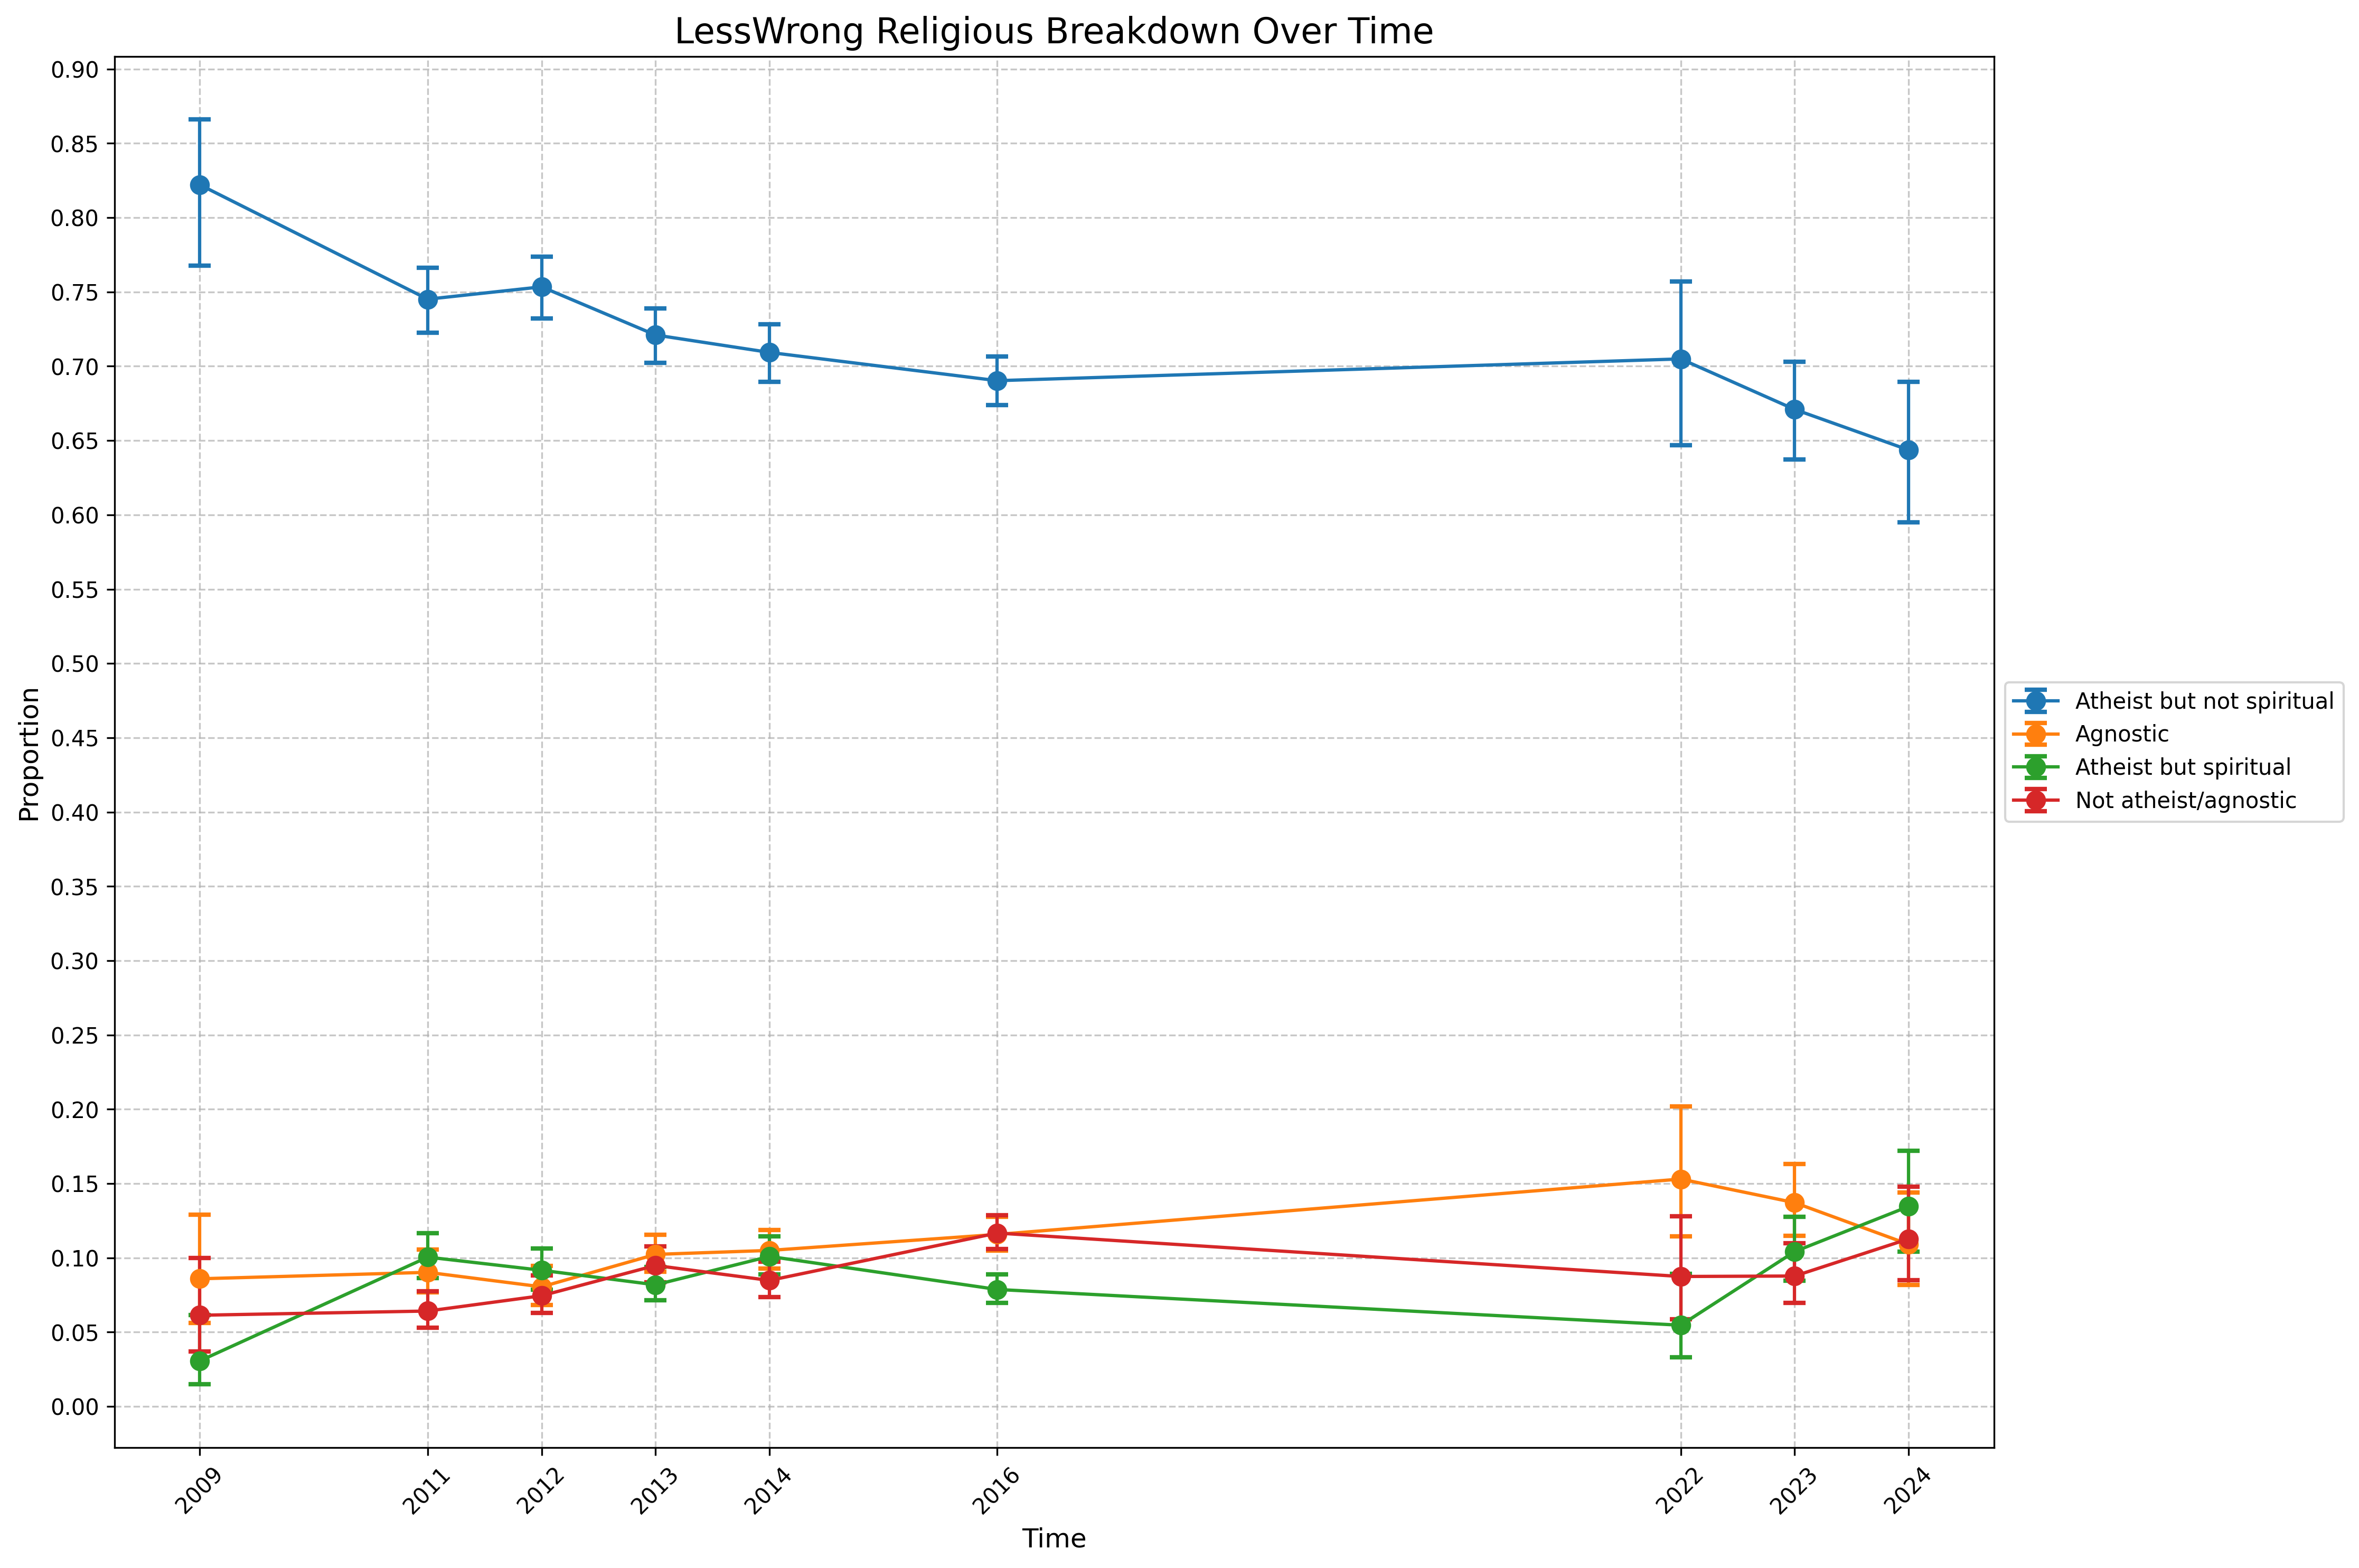
From 2009 to 2024, the LessWrong community experienced a steady decline in non-spiritual atheists (~18 percentage points, from 82% to 64%). This trend occurred in distinct phases:
- From 2009 to 2011, non-spiritual atheists declined (~7 points, 82% to 75%) while spiritual atheists rose (~7 points, 3% to 10%)
- From 2012 to 2016, non-spiritual atheists declined further (~6 points, 75% to 69%) with corresponding increases in agnostics (~4 points, 8% to 12%) and theists (~5 points, 7% to 12%)
- From 2022 to 2024, non-spiritual atheists declined again (~6 points, 70% to 64%) while spiritual atheists rose (~8 points, 5% to 13%)
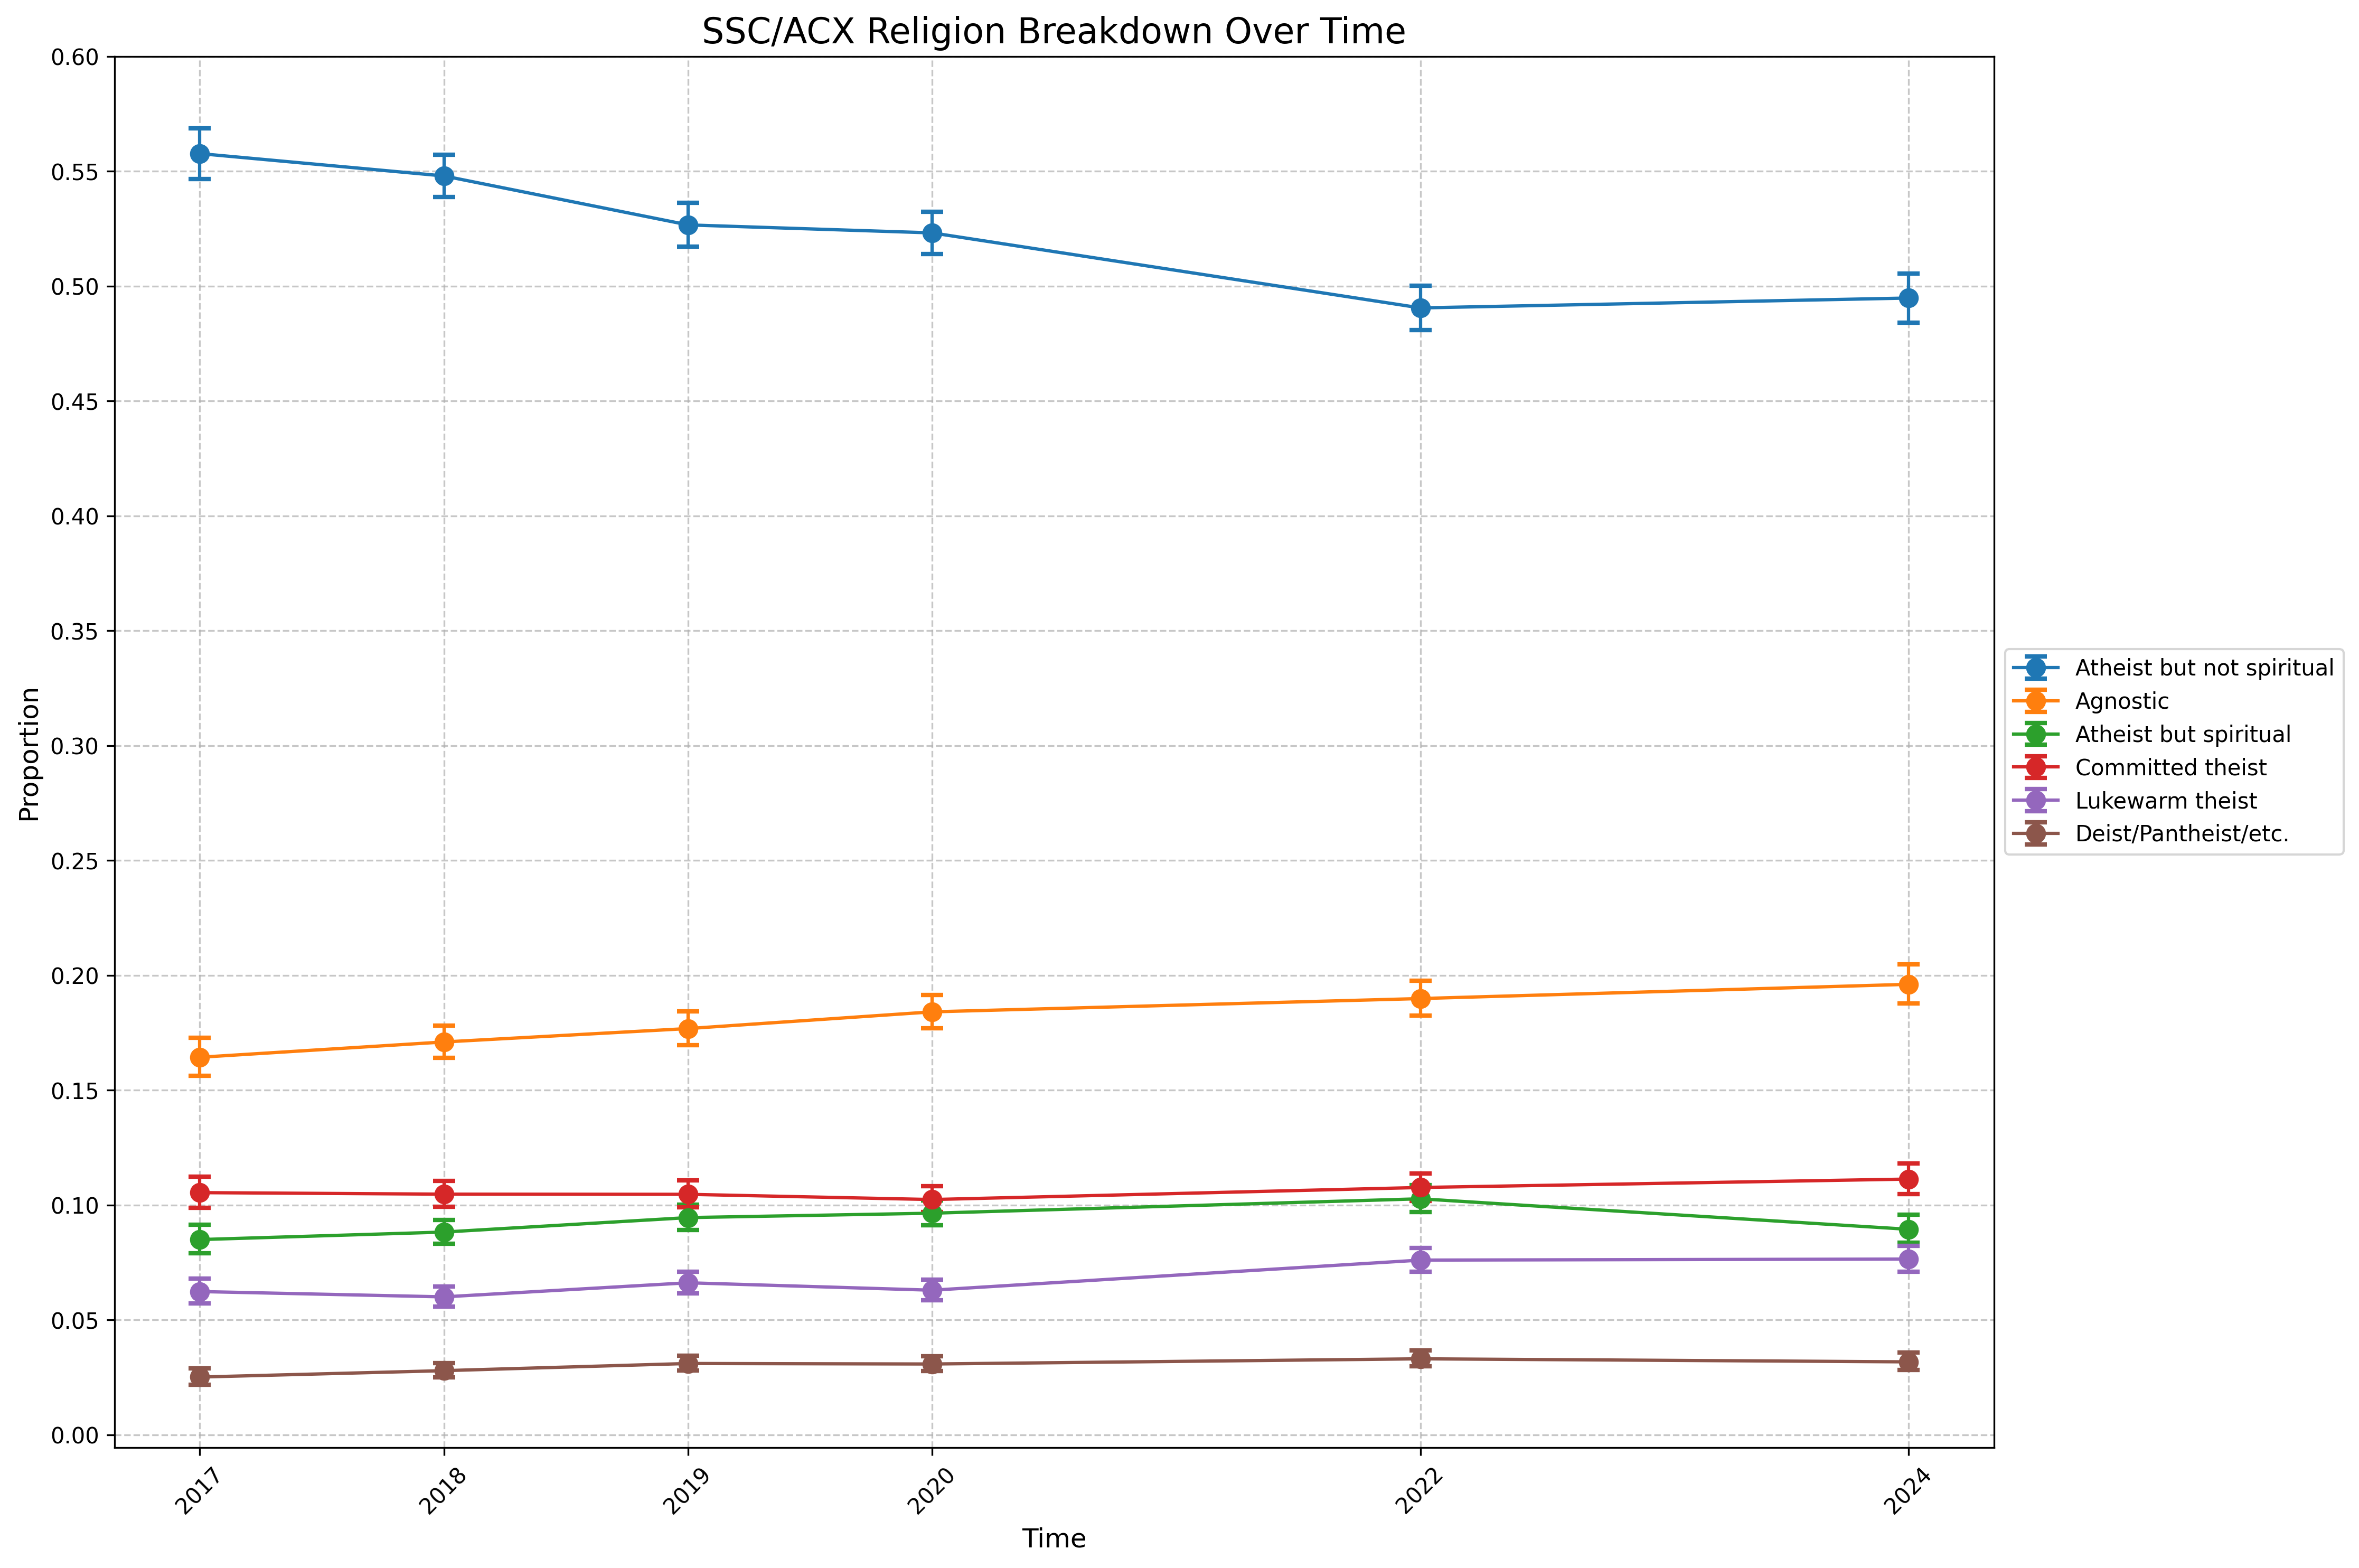
SSC/ACX showed more moderate changes from 2017 to 2024:
- Non-spiritual atheists decreased slightly (~7 points, 56% to 49%)
- Agnostics increased modestly (~4 points, 16% to 20%)
- Other groups remained largely stable
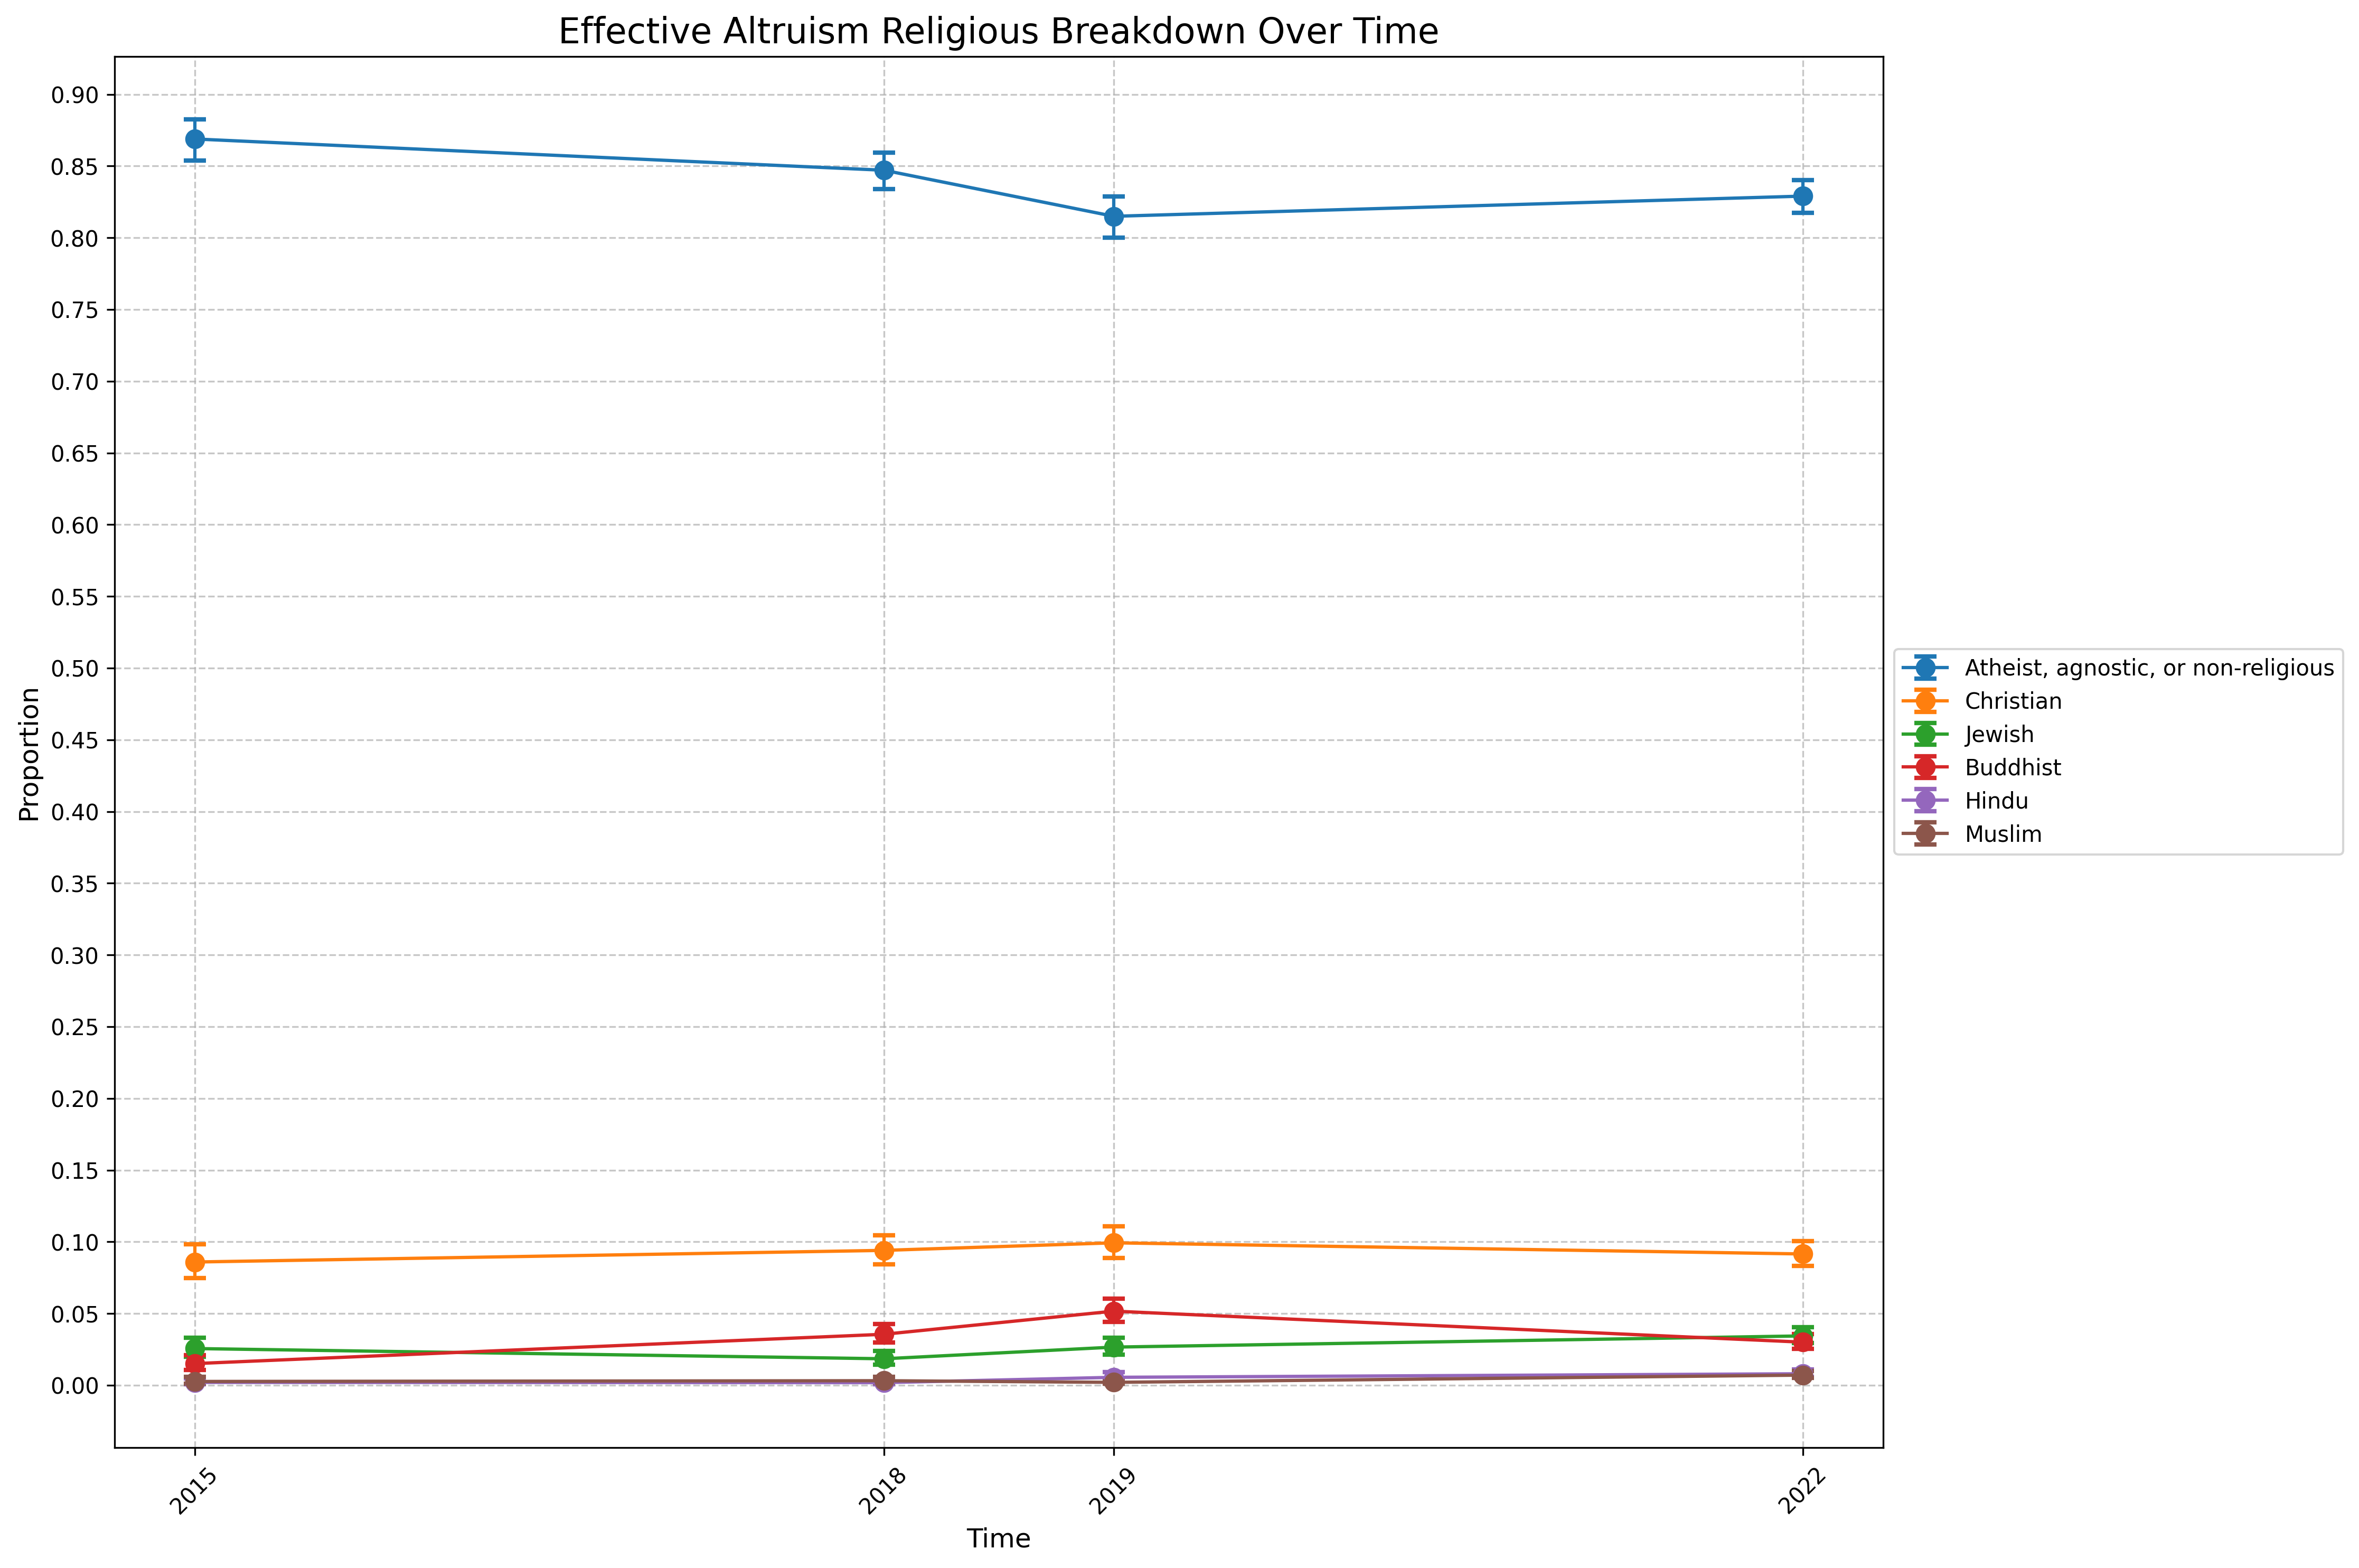
EA’s religious composition has been the most stable, though with a slight decline in non-religious members (~7 points, 87% to 80%) from 2015 to 2022.
Overall, LessWrong remains the least religious community, followed closely by EA, with SSC/ACX being somewhat more religious.
Education
LessWrong10
Slate Star Codex / Astral Codex Ten11
Summary
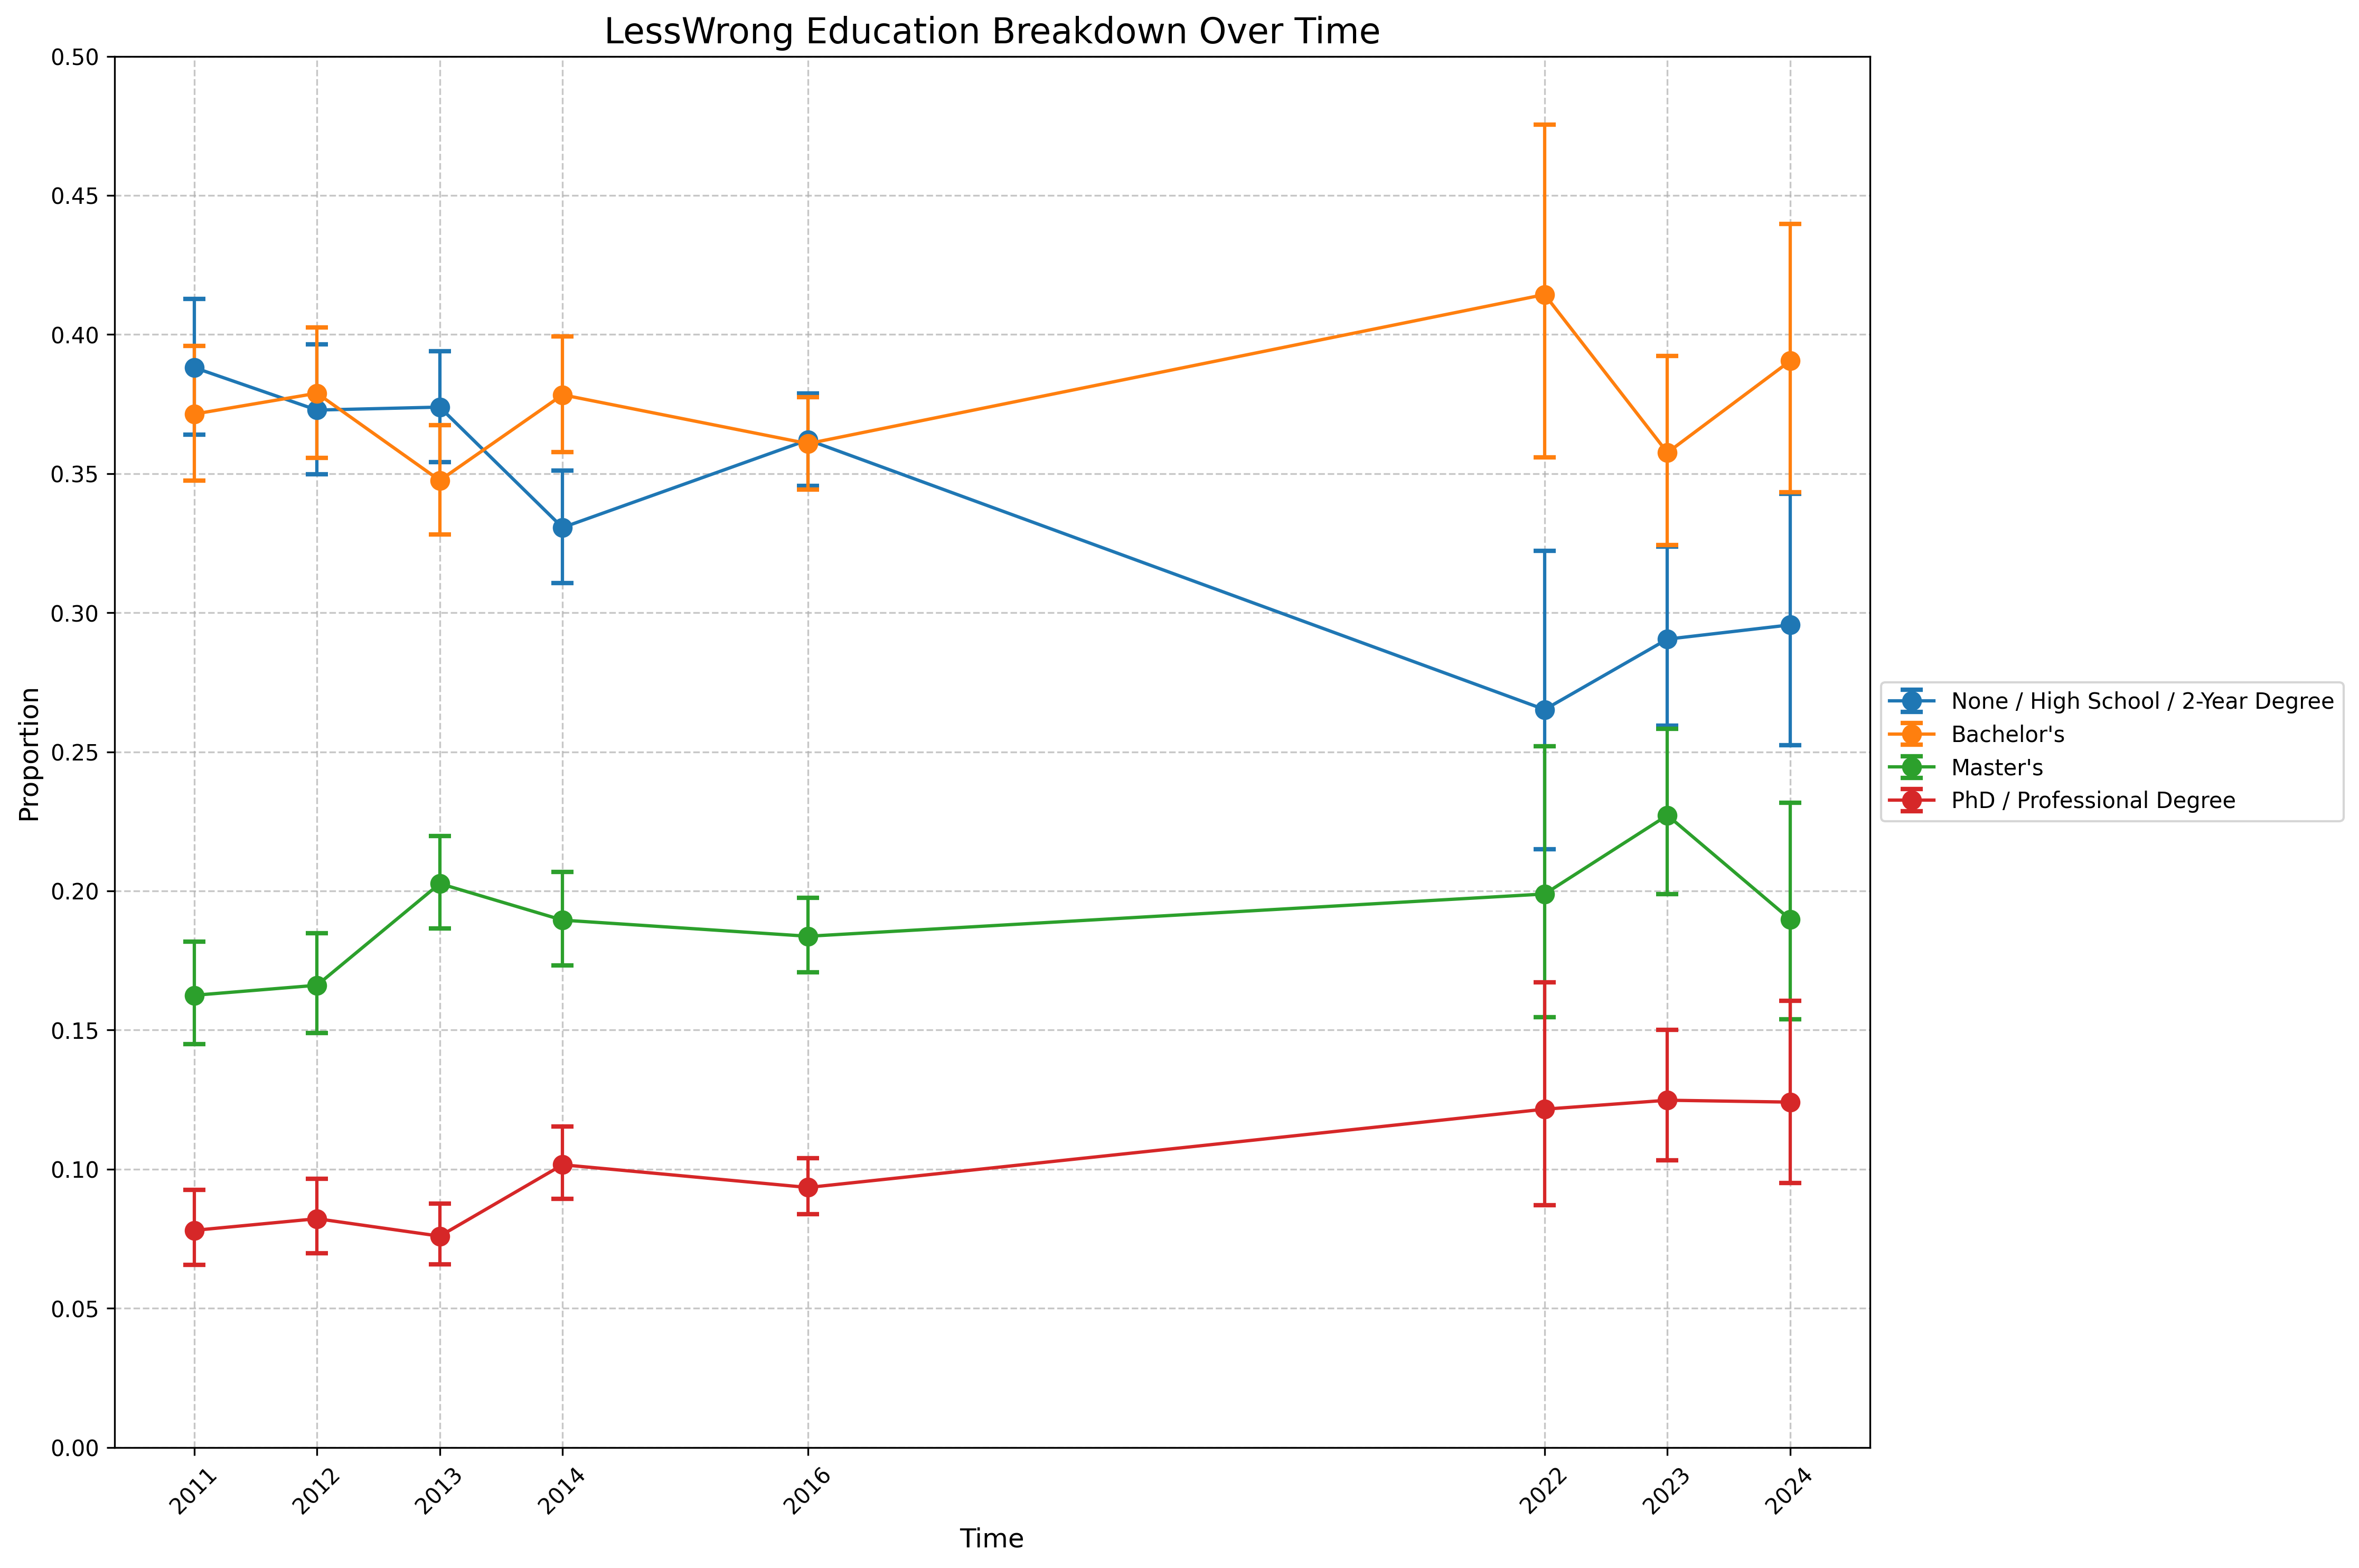
From 2011 to 2024, LessWrong’s user base became more educated:
- The share with no degree, only high school, or a two-year degree fell by 9 percentage points (from 39% to 30%)
- Bachelor’s degrees rose by 2 percentage points (from 37% to 39%)
- Master’s degrees rose by 3 percentage points (from 16% to 19%)
- PhD/Professional degrees rose by 4 percentage points (from 8% to 12%)
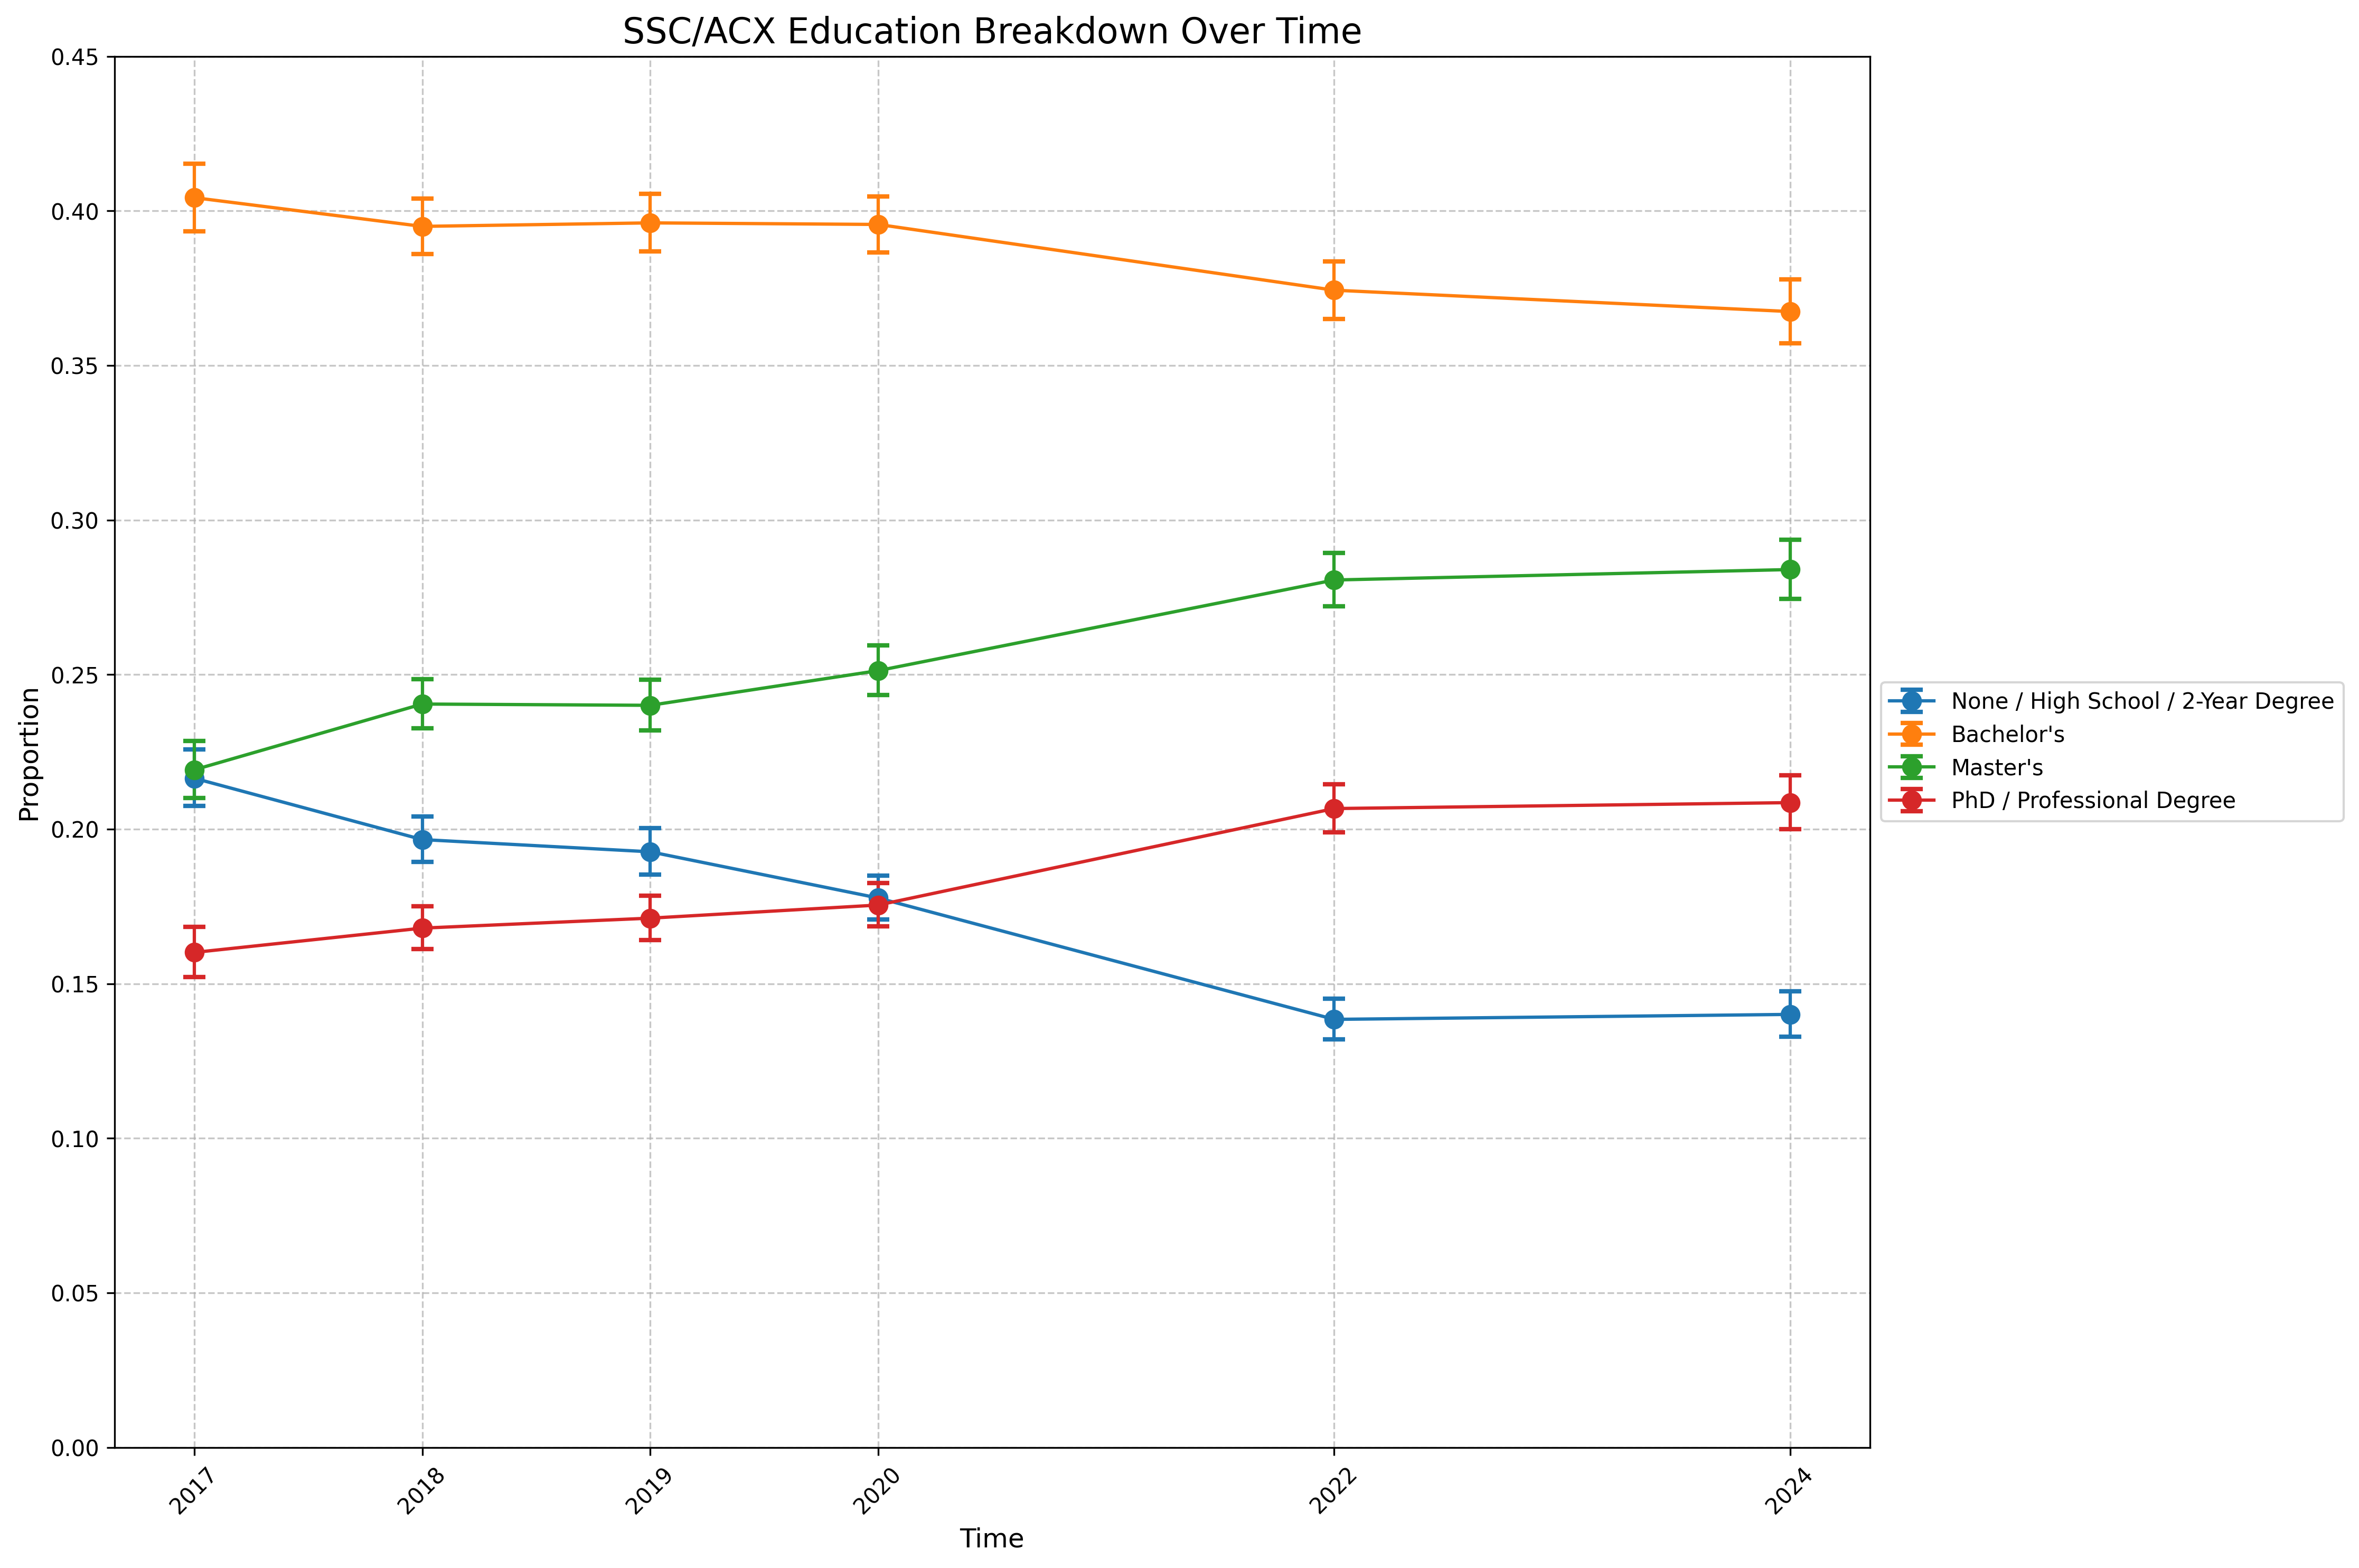
A similar trend occurred for SSC/ACX from 2017 to 2024:
- The share with no degree, only high school, or a two-year degree fell by 8 percentage points (from 22% to 14%)
- Bachelor’s degrees fell by 3 percentage points (from 40% to 37%)
- Master’s degrees rose by 6 percentage points (from 22% to 28%)
- PhD/Professional degrees rose by 5 percentage points (from 16% to 21%)
EA was excluded from this analysis due to insufficient survey data on educational attainment.
Overall, SSC/ACX users show higher educational attainment than LessWrong users.
Politics
LessWrong12
Slate Star Codex / Astral Codex Ten13
Effective Altruism14
Summary
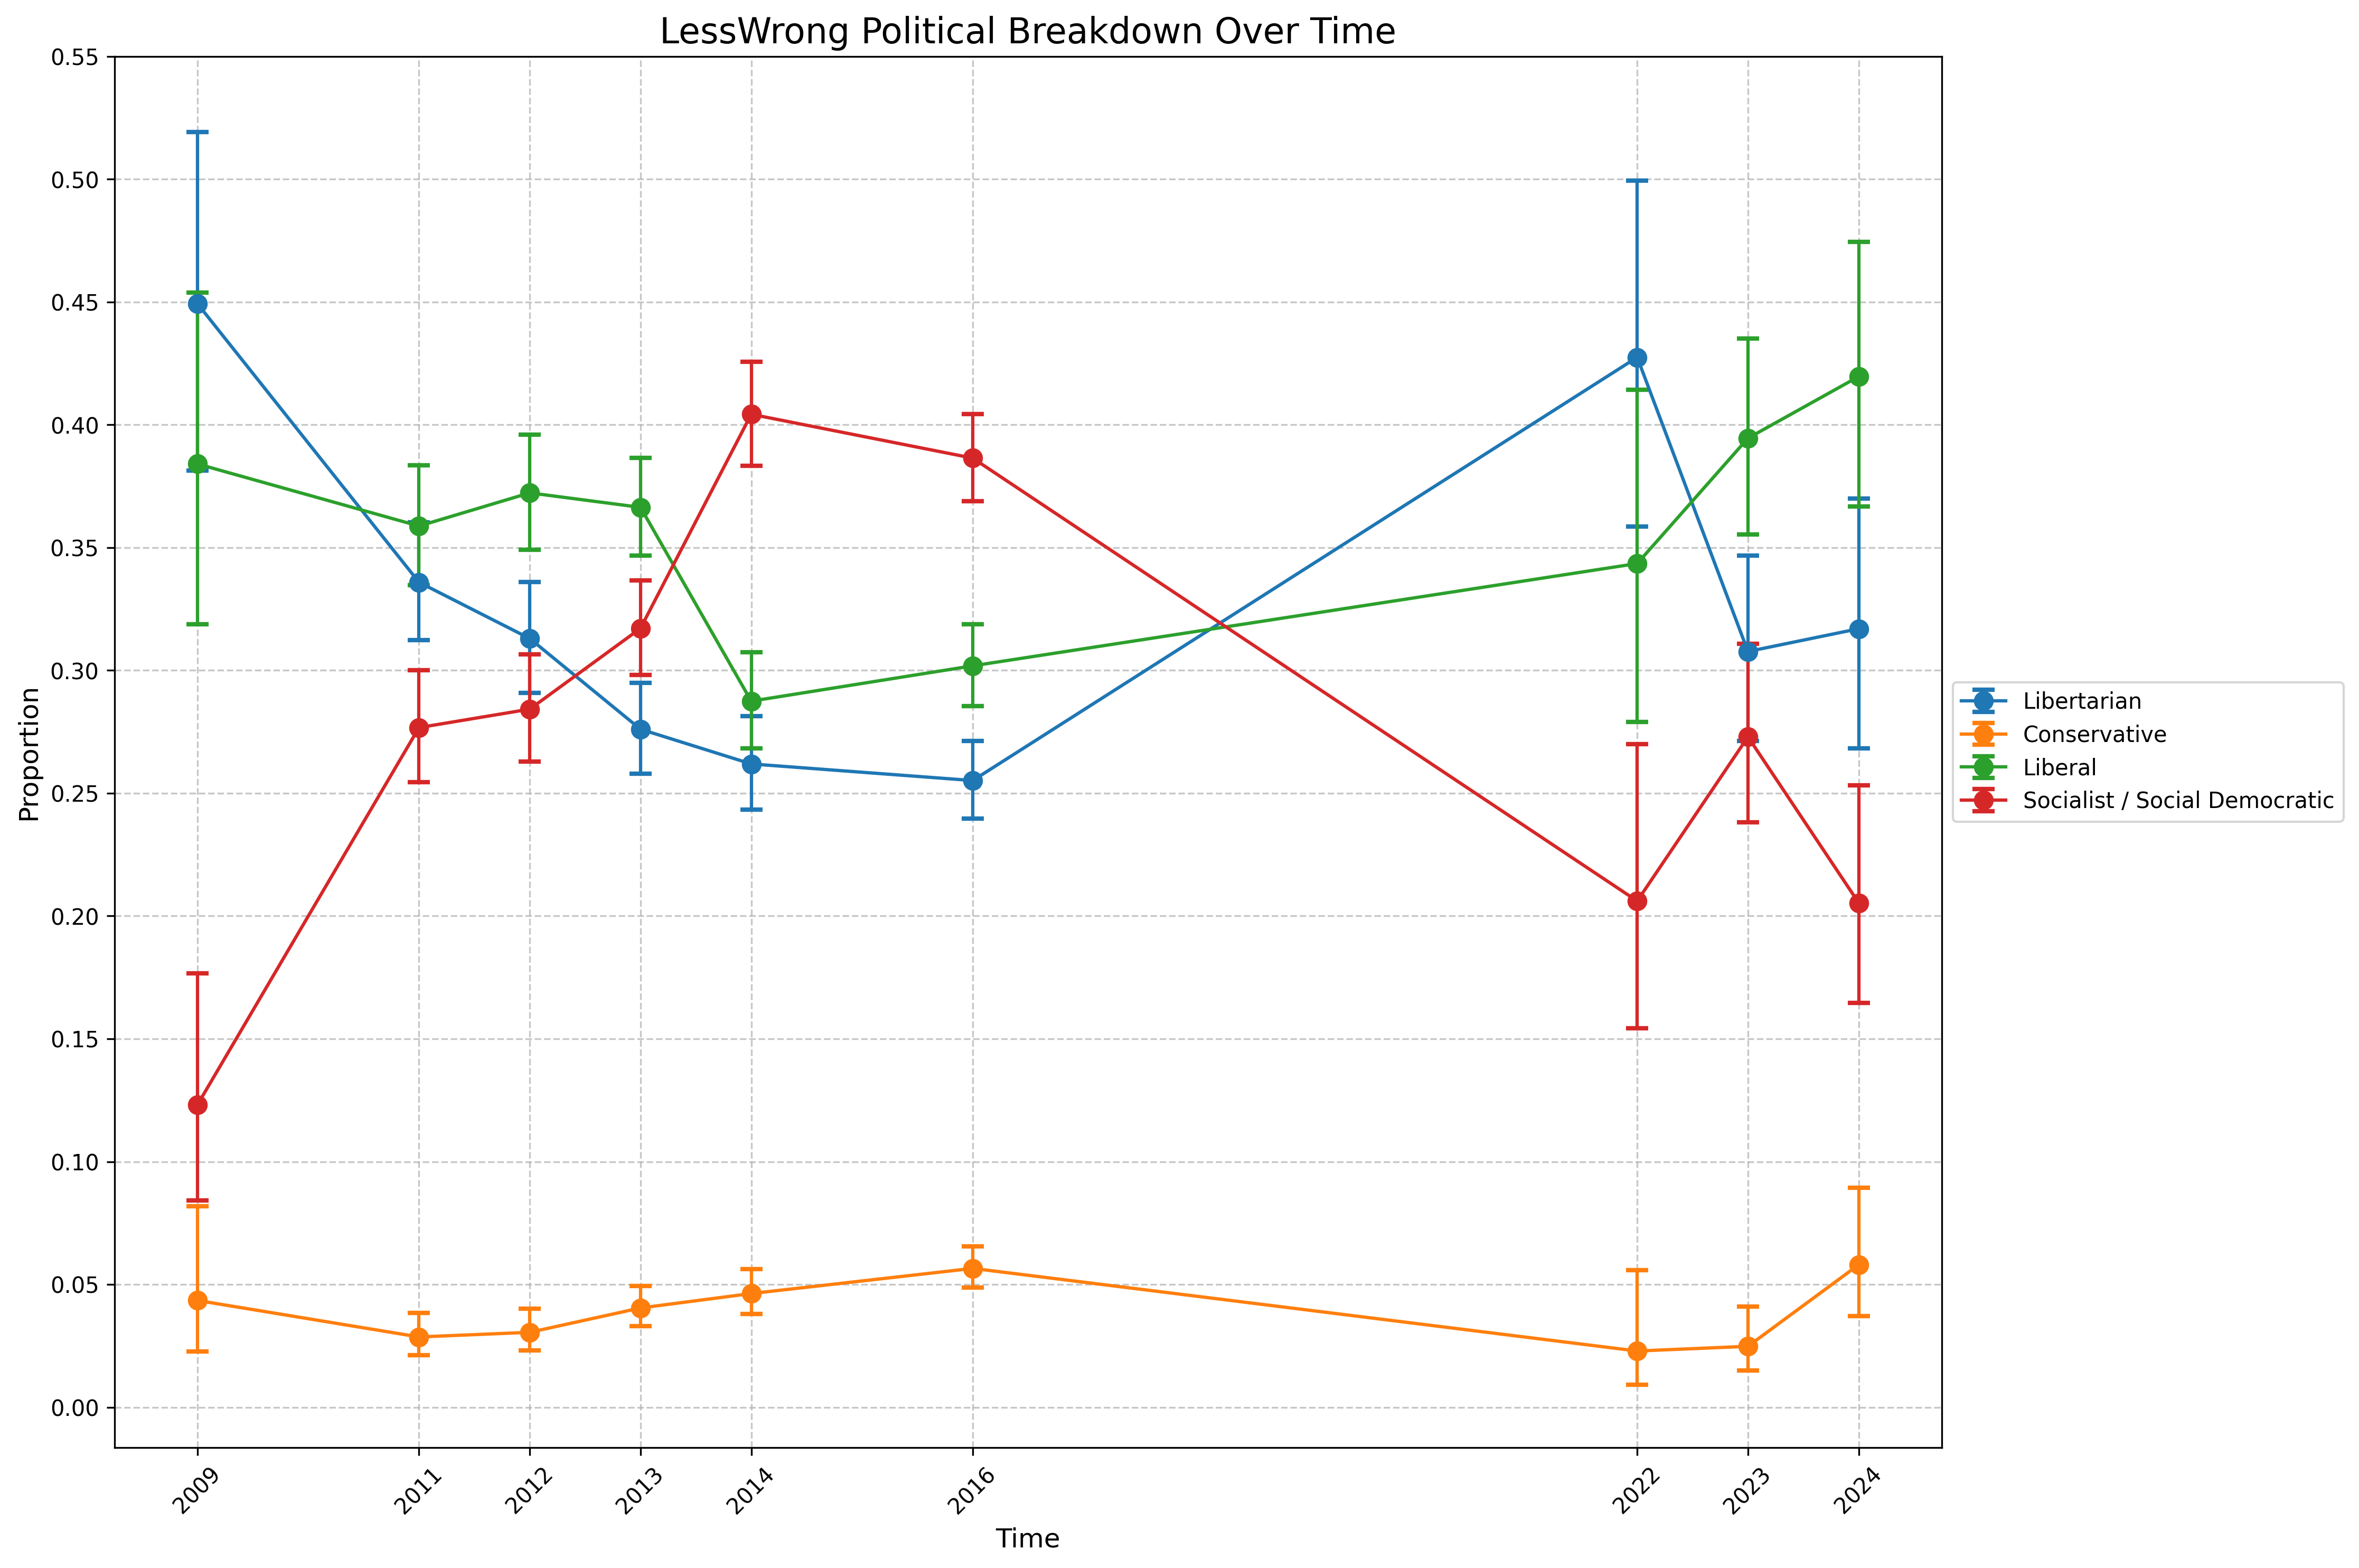
The LessWrong community has undergone an interesting political trajectory. Libertarians were the plurality in 2009 at 45% of survey respondents, dropped to a low of 26% by 2016, and rebounded to 32% by 2024. Social Democrats started at just 12% in 2009, peaked at 40% in 2014, and fell to 21% by 2024. Liberals have been more stable, starting at 38% in 2009, dipping to 29% in 2014, and rising to 42% by 2024. Conservatives have remained mostly stable, hovering between 4% and 6% throughout the years.
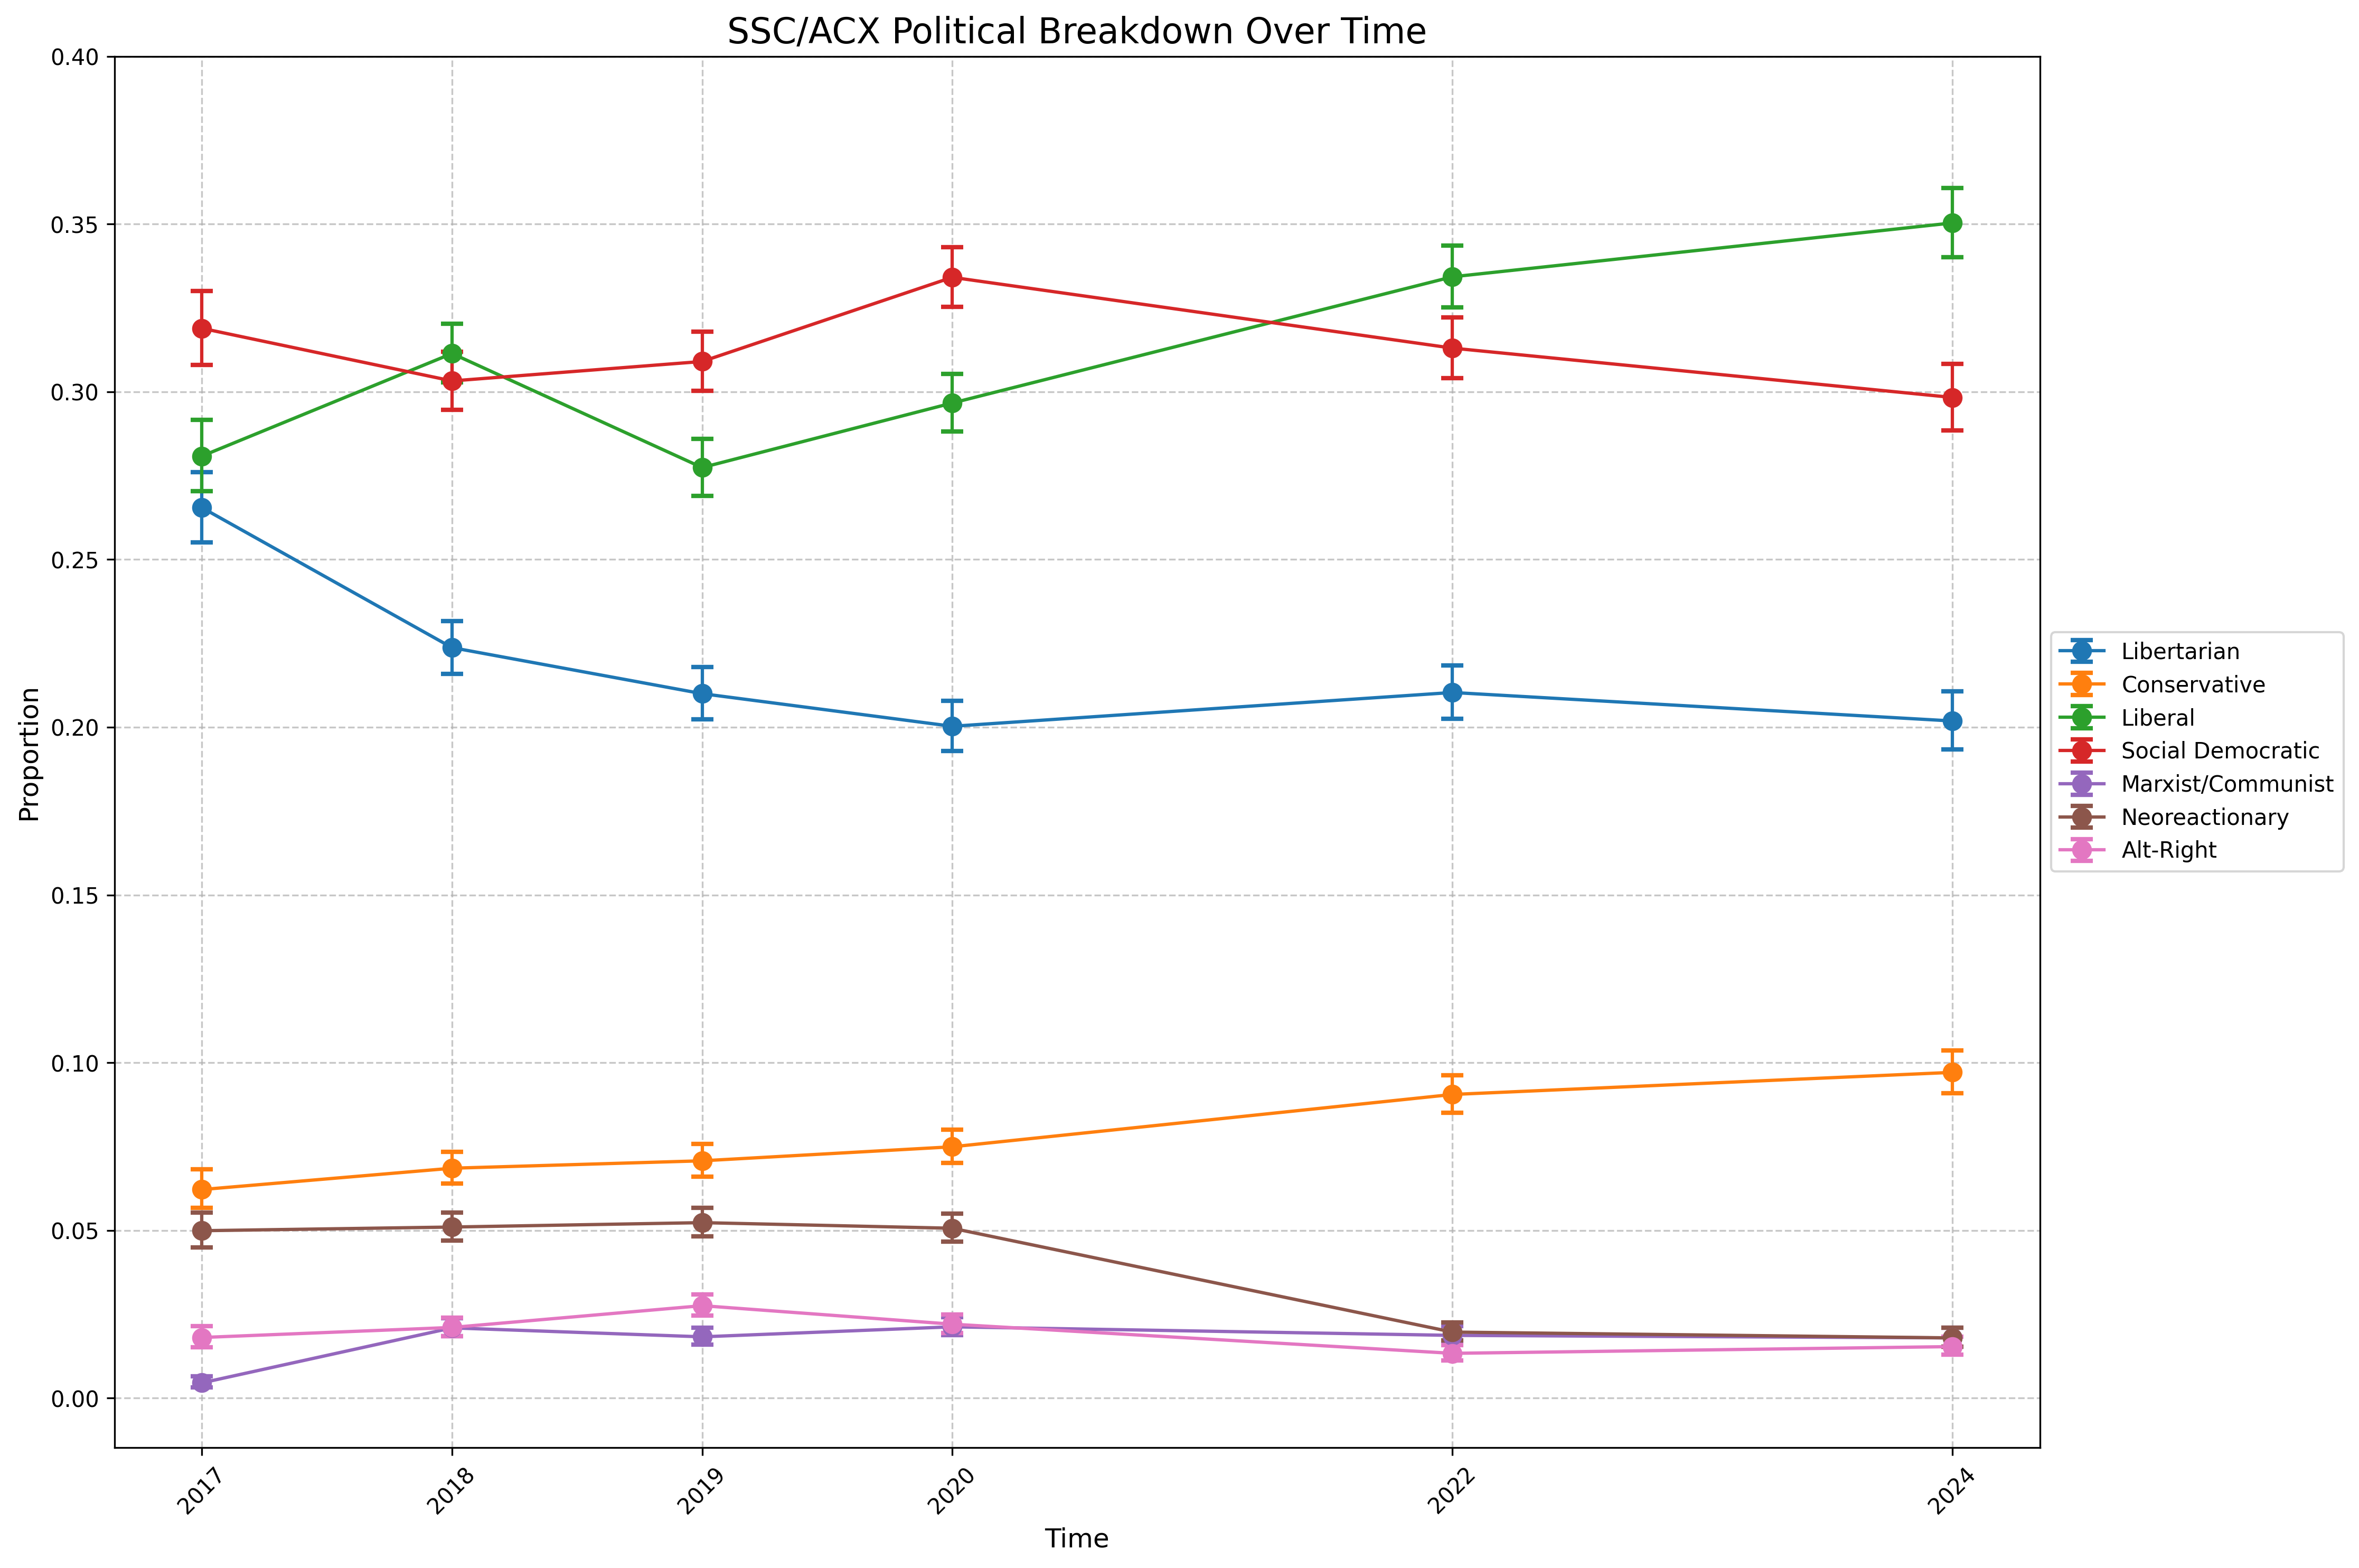
From 2017 to 2024, the SSC/ACX community saw a rise in liberals (~7 percentage points, from 28% to 35%) beginning in 2019, a fall in libertarians (~7 percentage points, from 27% to 20%) that ended by 2020, a steady increase in conservatives (~4 percentage points, from 6% to 10%), and a decline in neoreactionaries (~3 percentage points, from 5% to 2%) starting in 2020.
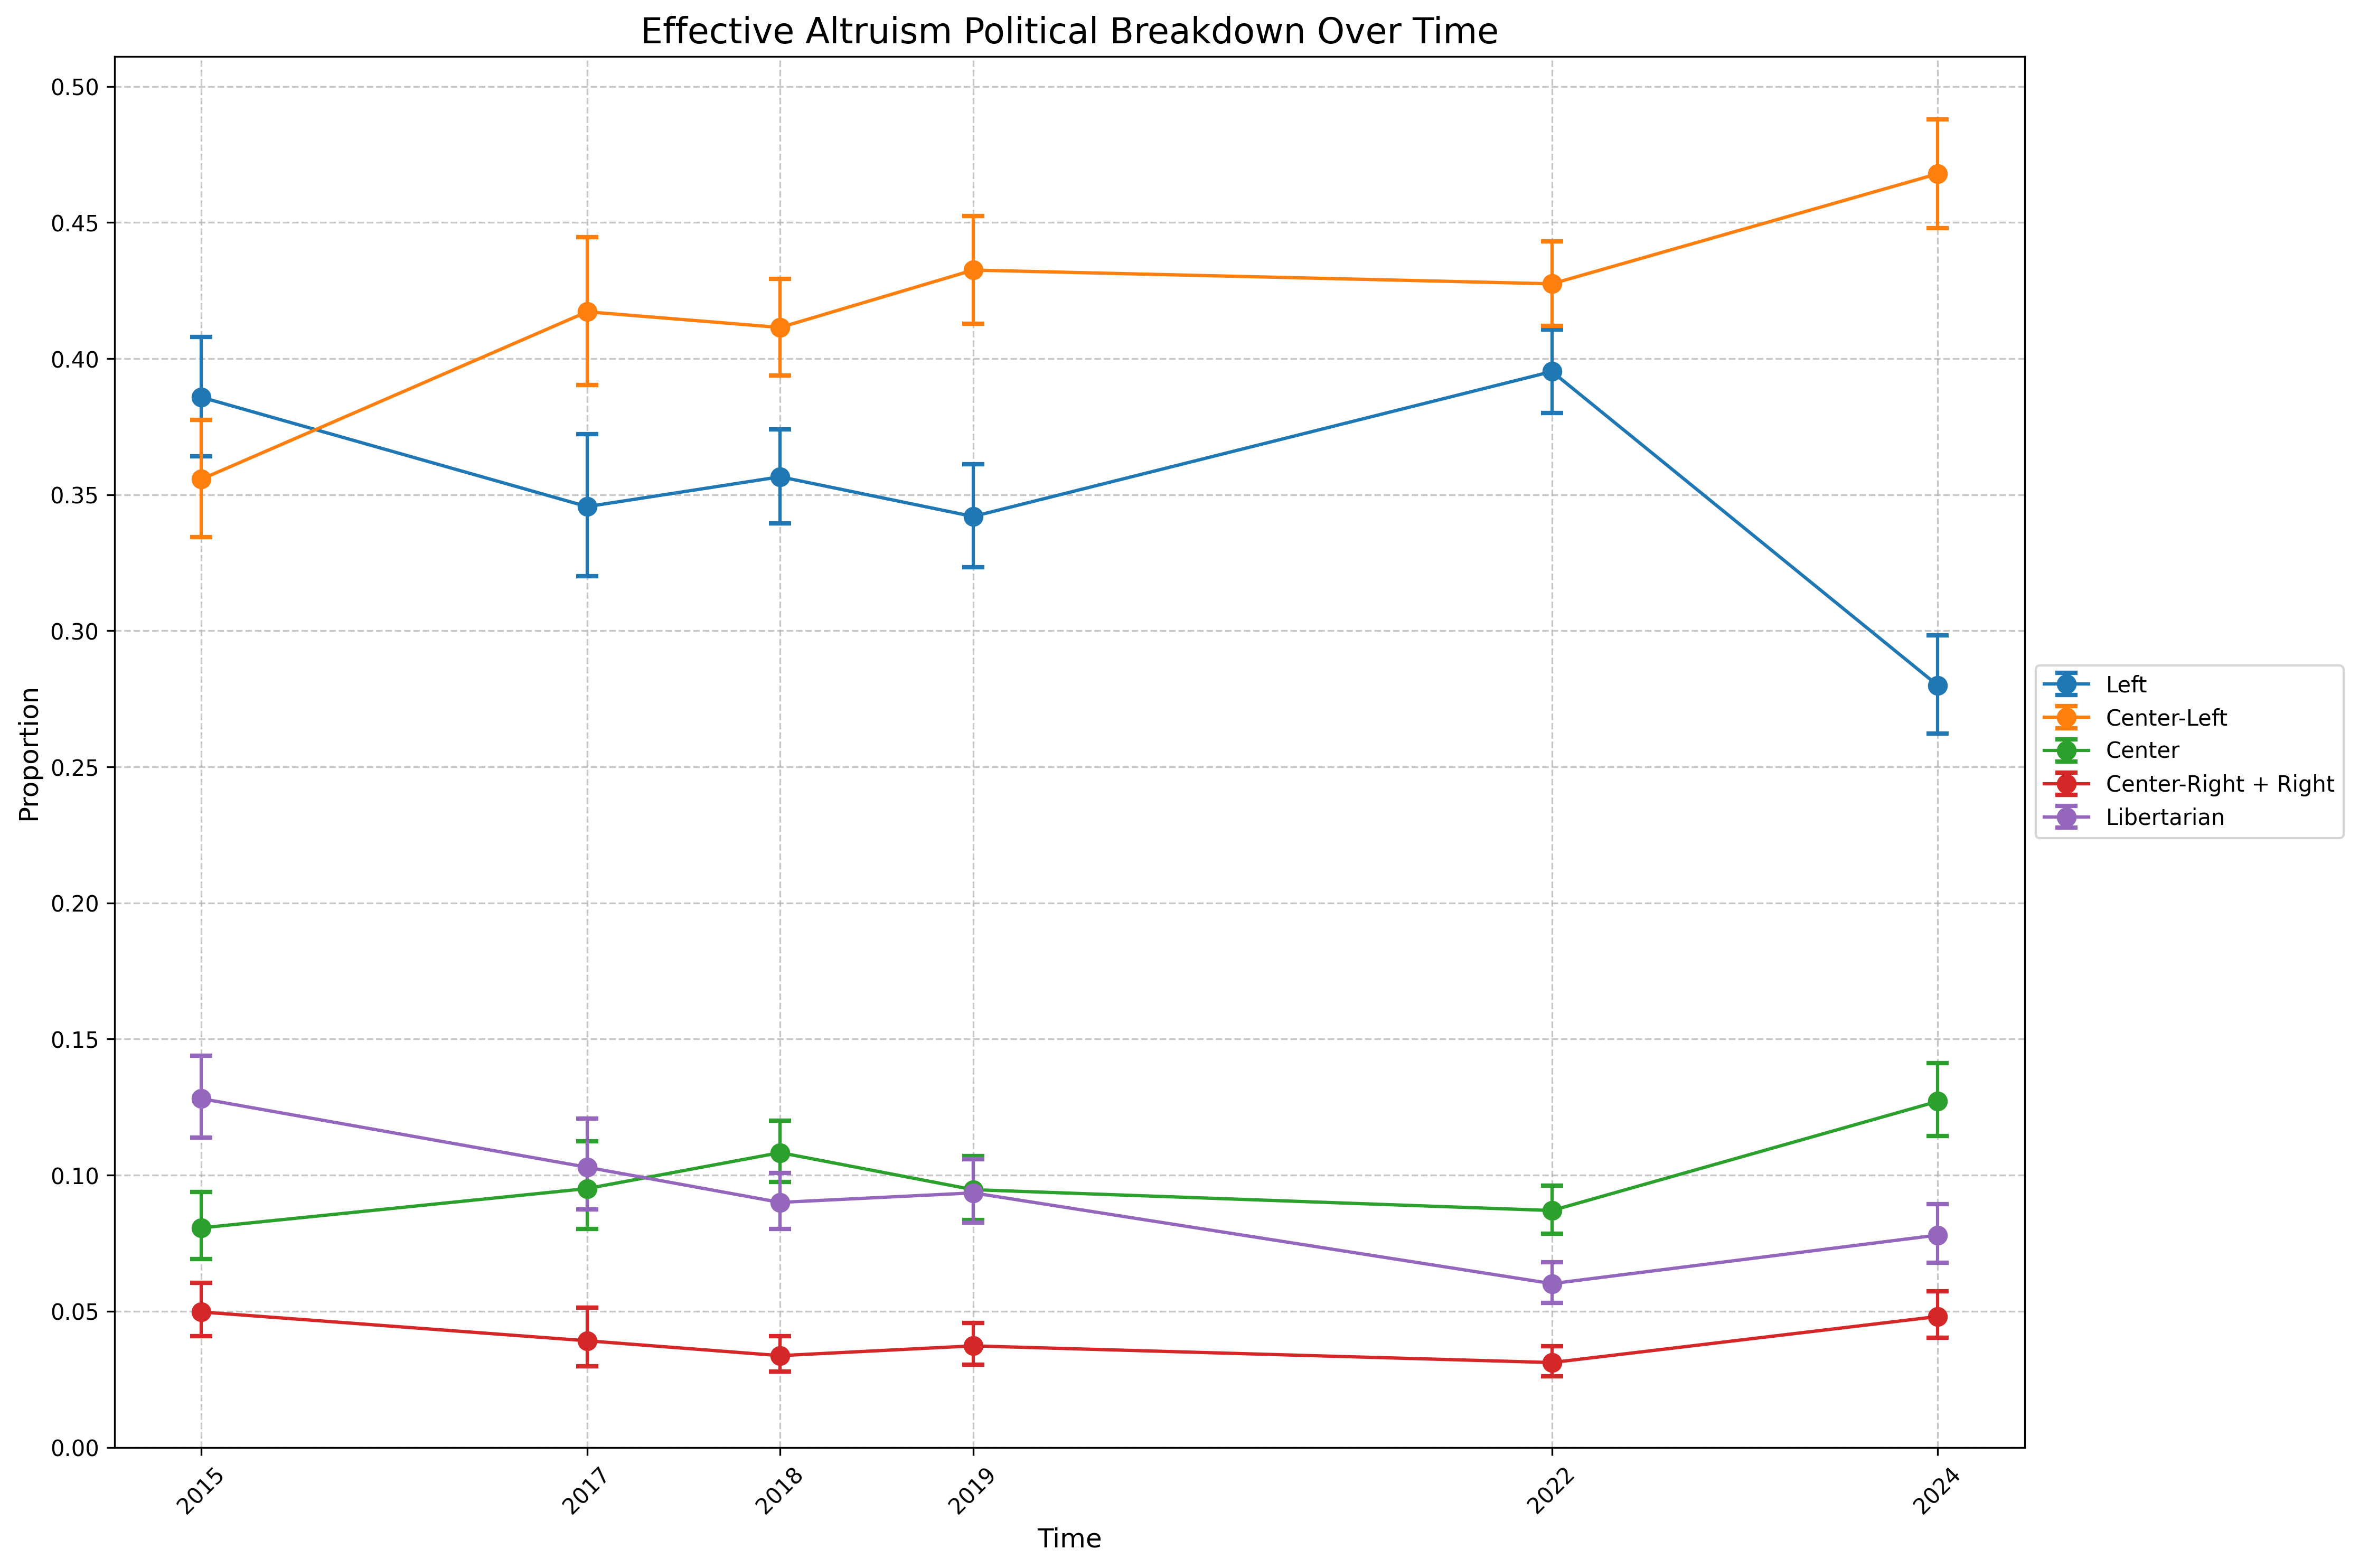
In EA from 2015 to 2024, the proportion of libertarians fell ~5 percentage points (from 13% to 8%), while centrists rose ~5 percentage points (from 8% to 13%). Among left-leaning respondents, those identifying as center-left rose steadily (~11 percentage points, from 36% to 47%), while those identifying as left remained stable (34%-40%) until 2024, when they suddenly dropped ~12 percentage points (from 40% to 28%).
Overall, LessWrong and SSC/ACX are much more libertarian than EA, with LessWrong being moderately more libertarian than SSC/ACX. SSSC/ACX is also more conservative than both LessWrong and EA.
-
LessWrong Surveys Featuring Gender
- 2024 LW Survey
- Gender Breakdown (279 people)
- Cis Male: 220 people
- Cis Female: 18 people
- Trans Female: 14 people
- Trans Male: 2 people
- Non-Binary: 10 people
- Other: 9 people
- No answer: 6 people
- Gender Breakdown (279 people)
- 2023 LW Survey
- Gender Breakdown (558 people)
- Cis Male: 411 people
- Cis Female: 52 people
- Trans Female: 32 people
- Trans Male: 3 people
- Non-Binary: 29 people
- Other: 15 people
- No answer: 16 people
- Gender Breakdown (558 people)
- 2022 LW Survey
- Gender Breakdown (186 people)
- Cis Male: 152 people
- Cis Female: 18 people
- Trans Female: 6 people
- Trans Male: 0 people
- Other: 7 people
- No answer: 3 people
- Gender Breakdown (186 people)
- 2016 LW Diaspora Survey
- Gender Breakdown (2394 people)
- Cis Male: 1829 people
- Cis Female: 321 people
- Trans Female: 65 people
- Trans Male: 23 people
- Other: 156 people
- Gender Breakdown (2394 people)
- 2014 LW Survey
- Gender Breakdown (1503 people)
- Cis Male: 1245 people
- Cis Female: 150 people
- Trans Female: 24 people
- Trans Male: 5 people
- Other: 64 people
- No answer: 15 people
- Gender Breakdown (1503 people)
- 2013 LW Survey
- Gender Breakdown (1636 people)
- Cis Male: 1401 people
- Cis Female: 140 people
- Trans Female: 20 people
- Trans Male: 5 people
- Other: 49 people
- No answer: 21 people
- Gender Breakdown (1636 people)
- 2012 LW Survey
- Gender Breakdown (1185 people)
- Cis Male: 1021 people
- Cis Female: 105 people
- Trans Female: 16 people
- Trans Male: 3 people
- Other: 29 people
- No answer: 11 people
- Gender Breakdown (1185 people)
- 2024 LW Survey
-
Slate Star Codex / Astral Codex Ten Surveys Featuring Gender
- 2024 ACX Survey
- Gender Breakdown (5944 people)
- Cis Male: 5024 people
- Cis Female: 619 people
- Trans Female: 121 people
- Trans Male: 31 people
- Other: 149 people
- Gender Breakdown (5944 people)
- 2022 ACX Survey
- Gender Breakdown (7290 people)
- Cis Male: 6147 people
- Cis Female: 794 people
- Trans Female: 138 people
- Trans Male: 23 people
- Other: 188 people
- Gender Breakdown (7290 people)
- 2020 SSC Survey
- Gender Breakdown (7910 people)
- Cis Male: 6699 people
- Cis Female: 777 people
- Trans Female: 158 people
- Trans Male: 35 people
- Other: 241 people
- Gender Breakdown (7910 people)
- 2019 SSC Survey
- Gender Breakdown (7400 people)
- Cis Male: 6354 people
- Cis Female: 709 people
- Trans Female: 127 people
- Trans Male: 30 people
- Other: 180 people
- Gender Breakdown (7400 people)
- 2018 SSC Survey
- Gender Breakdown (7959 people)
- Cis Male: 6939 people
- Cis Female: 733 people
- Trans Female: 114 people
- Trans Male: 30 people
- Other: 143 people
- Gender Breakdown (7959 people)
- 2017 SSC Survey
- Gender Breakdown (5480 people)
- Cis Male: 4765 people
- Cis Female: 488 people
- Trans Female: 80 people
- Trans Male: 25 people
- Other: 122 people
- Gender Breakdown (5480 people)
- 2024 ACX Survey
-
Effective Altruism Surveys Featuring Gender
- EA Survey 2024: Demographics
- Gender Breakdown (1916 people)
- Man: 68.8% (1318 people)
- Woman: 26.3% (504 people)
- Non-Binary: 4.0%
- Prefer to self-describe: 0.9%
- Gender Breakdown (1916 people)
- EA Survey 2022: Demographics
- Gender Breakdown (3245 people)
- Man: 66.2% (2149 people)
- Woman: 29.3% (950 people)
- Non-Binary: 3.1%
- Prefer to self-describe: 1.4%
- Gender Breakdown (3245 people)
- EA Survey 2020: Demographics
- Gender Breakdown (1629 people)
- Male: 70.5%
- Female: 26.9%
- Other: 2.6%
- Gender Breakdown (1629 people)
- EA Survey 2019 Series: Community Demographics & Characteristics
- Gender Breakdown (1893 people)
- Male: 1343 people
- Female: 509 people
- Other: 41 people
- Gender Breakdown (1893 people)
- EA Survey 2018 Series: Community Demographics & Characteristics
- Gender Breakdown (???)
- Male: 67%
- Female: 29%
- Other: 4%
- Gender Breakdown (???)
- EA Survey 2017 Series: Community Demographics & Beliefs
- Gender Breakdown (1080 people)
- Male: 757 people
- Female: 281 people
- Other: 21 people
- Prefer not to answer: 21 people
- Gender Breakdown (1080 people)
- The 2015 Survey of Effective Altruists: Results and Analysis
- Gender Breakdown (1626 people)
- Male: 1194 people
- Female: 398 people
- Other: 34 people
- Gender Breakdown (1626 people)
- The 2014 Survey of Effective Altruists: Results and Analysis
- Gender Breakdown (664 people)
- Male: 498 people
- Female: 156 people
- Other: 10 people
- Gender Breakdown (664 people)
- EA Survey 2024: Demographics
-
LessWrong Surveys Featuring Race
- 2024 LW Survey
- Race Breakdown (279 people)
- White (non-Hispanic): 211 people
- Asian (East Asian): 13 people
- Asian (Indian): 10 people
- White (Hispanic): 10 people
- Middle Eastern: 7 people
- Black: 4 people
- Jewish: 3 people
- Other: 13 people
- No Answer: 8 people
- Race Breakdown (279 people)
- 2023 LW Survey
- Race Breakdown (558 people)
- White (non-Hispanic): 434 people
- Asian (East Asian): 27 people
- Asian (Indian): 23 people
- White (Hispanic): 20 people
- Middle Eastern: 14 people
- Black: 4 people
- Jewish: NA
- Other: 28 people
- No Answer: 8 people
- Race Breakdown (558 people)
- 2022 LW Survey
- Race Breakdown (186 people)
- White (non-Hispanic): 148 people
- Asian (East Asian): 6 people
- Asian (Indian): 6 people
- White (Hispanic): 5 people
- Middle Eastern: 3 people
- Black: NA
- Jewish: NA
- Other: 14 people
- No Answer: 4 people
- Race Breakdown (186 people)
- 2014 LW Survey
- Race Breakdown (1503 people)
- White (non-Hispanic): 1294 people
- Asian (East Asian): 59 people
- Asian (Indian): 33 people
- White (Hispanic): 32 people
- Middle Eastern: 9 people
- Black: 12 people
- Jewish: NA
- Other: 50 people
- No Answer: 14 people
- Race Breakdown (1503 people)
- 2013 LW Survey
- Race Breakdown (1636 people)
- White (non-Hispanic): 1373 people
- Asian (East Asian): 60 people
- Asian (Indian): 37 people
- White (Hispanic): 73 people
- Middle Eastern: 9 people
- Black: 11 people
- Jewish: NA
- Other: 51 people
- No Answer: 22 people
- Race Breakdown (1636 people)
- 2012 LW Survey (csv)
- Race Breakdown (1185 people)
- White (non-Hispanic): 1003 people
- Asian (East Asian): 50 people
- Asian (Indian): 28 people
- White (Hispanic): 47 people
- Middle Eastern: 4 people
- Black: 8 people
- Jewish: NA
- Other: 33 people
- No Answer: 12 people
- Race Breakdown (1185 people)
- 2011 LW Survey
- Race Breakdown (1090 people)
- White (non-Hispanic): 944 people
- Asian (East Asian): 31 people
- Asian (Indian): 26 people
- White (Hispanic): 38 people
- Middle Eastern: NA
- Black: 4 people
- Jewish: NA
- Other: NA
- No Answer: 47 people
- Race Breakdown (1090 people)
- 2009 LW Survey
- Race Breakdown (166 people)
- White (non-Hispanic): 148 people
- Asian: 6 people
- White (Hispanic): 2 people
- Middle Eastern: 1 person)
- Black: 1 person)
- Jewish: NA
- Other: NA
- No Answer: 8 people
- Race Breakdown (166 people)
- 2024 LW Survey
-
Slate Star Codex / Astral Codex Ten Surveys Featuring Race
- 2024 ACX Survey
- Race Breakdown (5937 people)
- White (non-Hispanic): 5169 people
- Asian (East Asian): 210 people
- Asian (Indian): 150 people
- Hispanic: 137 people
- Middle Eastern: 62 people
- Black: 29 people
- Other: 180 people
- Race Breakdown (5937 people)
- 2022 ACX Survey
- Race Breakdown (7295 people)
- White (non-Hispanic): 6389 people
- Asian (East Asian): 201 people
- Asian (Indian): 212 people
- Hispanic: 152 people
- Middle Eastern: 65 people
- Black: 26 people
- Other: 250 people
- Race Breakdown (7295 people)
- 2020 SSC Survey
- Race Breakdown (7894 people)
- White (non-Hispanic): 6959 people
- Asian (East Asian): 269 people
- Asian (Indian): 178 people
- Hispanic: 153 people
- Middle Eastern: 68 people
- Black: 51 people
- Other: 216 people
- Race Breakdown (7894 people)
- 2019 SSC Survey
- Race Breakdown (7399 people)
- White (non-Hispanic): 6565 people
- Asian (East Asian): 226 people
- Asian (Indian): 166 people
- Hispanic: 128 people
- Middle Eastern: 46 people
- Black: 43 people
- Other: 225 people
- Race Breakdown (7399 people)
- 2018 SSC Survey
- Race Breakdown (7937 people)
- White (non-Hispanic): 6975 people
- Asian (East Asian): 280 people
- Asian (Indian): 194 people
- Hispanic: 153 people
- Middle Eastern: 64 people
- Black: 41 people
- Other: 230 people
- Race Breakdown (7937 people)
- 2017 SSC Survey
- Race Breakdown (5472 people)
- White (non-Hispanic): 4841 people
- Asian (East Asian): 187 people
- Asian (Indian): 118 people
- Hispanic: 95 people
- Middle Eastern: 46 people
- Black: 26 people
- Other: 159 people
- Race Breakdown (5472 people)
- 2014 SSC Survey
- Race Breakdown
- White (non-Hispanic): 88%
- Asian (East Asian): 2%
- Asian (Indian): 3%
- Hispanic: 2%
- Middle Eastern: 0.5%
- Black: 1%
- Other: 3.5%
- Race Breakdown
- 2024 ACX Survey
-
Effective Altruism Surveys Featuring Race
- EA Survey 2024: Demographics
- Race Breakdown (1866 people)
- White: 75.0%
- Asian: 10.3%
- Hispanic, Latino, or Spanish Origin: 3.5%
- Black or African American: 2.5%
- Middle Eastern, North African, or Arab origin: 1.1%
- Native Hawaiian or Other Pacific Islander: 0.1%
- American Indian or Alaskan Native: 0.1%
- Prefer to self-describe: 2.7%
- Two or more racial/ethnic identities: 4.9%
- Race Breakdown (1866 people)
- EA Survey 2022: Demographics
- Race Breakdown (3230 people)
- White: 76.28%
- Asian: 9.54%
- Hispanic, Latino, or Spanish origin: 3.28%
- Black or African American: 1.05%
- Middle Eastern, North African, or Arab origin: 0.96%
- Native Hawaiian or Other Pacific Islander: 0.06%
- American Indian or Alaskan Native: 0.03%
- Prefer not to answer: 2.23%
- Other: 0.68%
- Mixed: 5.88%
- Race Breakdown (3230 people)
- EA Survey 2020: Demographics
- Race Breakdown (1659 people)
- White: 75.9%
- Asian: 9.5%
- Hispanic, Latino, or Spanish origin: 1.6%
- Black or African American: 0.7%
- Middle Eastern, North African, or Arab origin: NA
- Native Hawaiian or Other Pacific Islander: 0.0%
- American Indian or Alaskan Native: 0.0%
- Prefer not to answer: 2.6%
- Other: 2.3%
- Mixed: 7.4%
- Race Breakdown (1659 people)
- EA Survey 2019 Series: Community Demographics & Characteristics
- Race Breakdown (1866 people)
- White: 1621 people
- Asian: 185 people
- Hispanic, Latino, or Spanish origin: 88 people
- Black or African American: 26 people
- Middle Eastern, North African, or Arab origin: NA
- Native Hawaiian or Other Pacific Islander: 5 people
- American Indian or Alaskan Native: 4 people
- Prefer not to answer: NA
- Other: 75 people
- Mixed: NA
- Race Breakdown (1866 people)
- EA Survey 2018 Series: Community Demographics & Characteristics
- Race Breakdown (???)
- White: 78.29%
- Asian: 7.33%
- Hispanic: 2.84%
- Black: 0.84%
- Native American: 0.35%
- Pacific Islander: 0.31%
- Race Breakdown (???)
- EA Survey 2017 Series: Demographics II
- Race Breakdown (1098 people; Can select multiple)
- White: 951 people
- Black: 8 people
- Hispanic: 35 people
- Asian: 75 people
- Race Breakdown (1098 people; Can select multiple)
- EA Survey 2024: Demographics
-
LessWrong Surveys Featuring Religion
- 2024 LW Survey
- Broad Religious Views (279 people)
- Atheist but not spiritual: 177 people
- Agnostic: 30 people
- Atheist but spiritual: 37 people
- Committed Theist: 11 people
- Deist/Pantheist/etc: 6 people
- Lukewarm Theist: 14 people
- No answer: 4 people
- Broad Religious Views (279 people)
- 2023 LW Survey
- Broad Religious Views (558 people)
- Atheist but not spiritual: 367 people
- Agnostic: 75 people
- Atheist but spiritual: 57 people
- Committed Theist: 20 people
- Deist/Pantheist/etc: 15 people
- Lukewarm Theist: 13 people
- No answer: 11 people
- Broad Religious Views (558 people)
- 2022 LW Survey
- Broad Religious Views (186 people)
- Atheist and not spiritual: 129 people
- Agnostic: 28 people
- Atheist and spiritual: 10 people
- Committed theist: 9 people
- Lukewarm theist: 4 people
- Deist/pantheist/etc.: 3 people
- No answer: 3 people
- Broad Religious Views (186 people)
- 2016 LW Diaspora Survey
- Broad Religious Views (2160 people)
- Atheist but not spiritual: 1491 people
- Agnostic: 250 people
- Atheist and spiritual: 170 people
- Committed theist: 115 people
- Lukewarm theist: 80 people
- Deist/Pantheist/Etc.: 57 people
- Broad Religious Views (2160 people)
- 2014 LW Survey
- Broad Religious Views (1503 people)
- Atheist and not spiritual: 1054 people
- Agnostic: 156 people
- Atheist and spiritual: 150 people
- Committed theist: 60 people
- Lukewarm theist: 44 people
- Deist/pantheist/etc.: 22 people
- No answer: 17 people
- Broad Religious Views (1503 people)
- 2013 LW Survey
- Broad Religious Views (1636 people)
- Atheist but not spiritual: 1163 people
- Agnostic: 165 people
- Atheist but spiritual: 132 people
- Committed theist: 64 people
- Lukewarm theist: 53 people
- Deist/pantheist/etc.: 36 people
- No answer: 23 people
- Broad Religious Views (1636 people)
- 2012 LW Survey
- Broad Religious Views (1185 people)
- Atheist, not spiritual: 880 people
- Atheist, spiritual: 107 people
- Agnostic: 94 people
- Committed theist: 37 people
- Lukewarm theist: 27 people
- Deist/Pantheist/etc: 23 people
- No answer: 17 people
- Broad Religious Views (1185 people)
- 2011 LW Survey
- Broad Religious Views (1090 people)
- Atheist but not spiritual: 801 people
- Atheist and spiritual: 108 people
- Agnostic: 97 people
- Committed theist: 20 people
- Lukewarm theist: 19 people
- Deist/Pantheist/etc.: 30 people
- No answer: 15 people
- Broad Religious Views (1090 people)
- 2009 LW Survey
- Broad Religious Views (166 people)
- Atheist and not spiritual: 134 people
- Agnostic: 14 people
- Atheist and spiritual: 5 people
- Deist/Pantheist: 2 people
- Committed theist: 6 people
- Lukewarm theist: 2 people
- No answer: 3 people
- Broad Religious Views (166 people)
- 2024 LW Survey
-
Slate Star Codex / Astral Codex Ten Surveys Featuring Religion
- 2024 ACX Survey
- Broad Religious Views (5946 people)
- Atheist but not spiritual: 2942 people
- Agnostic: 1166 people
- Atheist but spiritual: 532 people
- Committed theist: 662 people
- Lukewarm theist: 455 people
- Deist/Pantheist/etc.: 189 people
- Broad Religious Views (5946 people)
- 2022 ACX Survey
- Broad Religious Views (7309 people)
- Atheist but not spiritual: 3585 people
- Agnostic: 1388 people
- Atheist but spiritual: 751 people
- Committed theist: 787 people
- Lukewarm theist: 556 people
- Deist/Pantheist/etc.: 242 people
- Broad Religious Views (7309 people)
- 2020 SSC Survey
- Broad Religious Views (7908 people)
- Atheist but not spiritual: 4137 people
- Agnostic: 1456 people
- Atheist but spiritual: 763 people
- Committed theist: 810 people
- Lukewarm theist: 498 people
- Deist/Pantheist/etc.: 244 people
- Broad Religious Views (7908 people)
- 2019 SSC Survey
- Broad Religious Views (7402 people)
- Atheist but not spiritual: 3898 people
- Agnostic: 1309 people
- Atheist but spiritual: 700 people
- Committed theist: 775 people
- Lukewarm theist: 490 people
- Deist/Pantheist/etc.: 230 people
- Broad Religious Views (7402 people)
- 2018 SSC Survey
- Broad Religious Views (7941 people)
- Atheist but not spiritual: 4351 people
- Agnostic: 1358 people
- Atheist but spiritual: 701 people
- Committed theist: 832 people
- Lukewarm theist: 477 people
- Deist/Pantheist/etc.: 222 people
- Broad Religious Views (7941 people)
- 2017 SSC Survey
- Broad Religious Views (5482 people)
- Atheist but not spiritual: 3057 people
- Agnostic: 901 people
- Atheist but spiritual: 466 people
- Committed theist: 578 people
- Lukewarm theist: 342 people
- Deist/Pantheist/etc.: 138 people
- Broad Religious Views (5482 people)
- 2014 SSC Survey
- Broad Religious Views
- Atheist: 68%
- Agnostic: 16%
- Religious: 12%
- Broad Religious Views
- 2024 ACX Survey
-
Effective Altruism Surveys Featuring Religion
- EA Survey 2022: Demographics
- Religious Breakdown (3110 people)
- Atheist, agnostic, or non-religious: 79.81%
- Christian: 8.81%
- Other: 3.63%
- Jewish: 3.31%
- Buddhist: 2.89%
- Hindu: 0.77%
- Muslim: 0.68%
- Sikh: 0.10%
- Religious Breakdown (3110 people)
- EA Survey 2019 Series: Community Demographics & Characteristics
- Religious Breakdown (2052 people)
- Atheist, agnostic, or non-religious: 1625 people
- Christian: 198 people
- Other: 56 people
- Jewish: 53 people
- Buddhist: 103 people
- Hindu: 11 people
- Muslim: 4 people
- Sikh: 2 people
- Religious Breakdown (2052 people)
- EA Survey 2018 Series: Community Demographics & Characteristics
- Religious Breakdown (2311 people)
- Atheist, agnostic, or non-religious: 1883 people
- Christian: 209 people
- Other: 88 people
- Jewish: 41 people
- Buddhist: 79 people
- Hindu: 4 people
- Muslim: 7 people
- Sikh: NA
- Religious Breakdown (2311 people)
- EA Survey 2017 Series: Community Demographics & Beliefs
- Religious Breakdown (1038 people)
- Atheist, agnostic, or non-religious: 856 people
- Christian: 97 people
- Other: 42 people
- Jewish: 20 people
- Buddhist: 21 people
- Hindu: 2 people
- Religious Breakdown (1038 people)
- The 2015 Survey of Effective Altruists: Results and Analysis
- Religious Breakdown (1527 people)
- Atheist, agnostic, or non-religious: 1325 people
- Christian: 131 people
- Jewish: 39 people
- Buddhist: 23 people
- Hindu: 3 people
- Muslim: 4 people
- Sikh: 2 people
- Religious Breakdown (1527 people)
- The 2014 Survey of Effective Altruists: Results and Analysis
- Religious Breakdown (642 people)
- Agnostic / Atheist: 566 people
- Christian: 32 people
- Other: 26 people
- Jewish: 6 people
- Buddhist: 12 people
- Religious Breakdown (642 people)
- EA Survey 2022: Demographics
-
LessWrong Surveys Featuring Education
- 2024 LW Survey
- Degree Breakdown (279 people)
- None: 13 people
- High School: 63 people
- 2-Year Degree: 5 people
- Bachelor’s: 107 people
- Master’s: 52 people
- PhD: 24 people
- MD/JD/Other Professional Degree: 10 people
- No Answer: 5 people
- Degree Breakdown (279 people)
- 2023 LW Survey
- Degree Breakdown (588 people)
- None: 23 people
- High School: 116 people
- 2-Year Degree: 17 people
- Bachelor’s: 192 people
- Master’s: 122 people
- PhD: 55 people
- MD/JD/Other Professional Degree: 12 people
- Other: 11 people
- No Answer: 40 people
- Degree Breakdown (588 people)
- 2022 LW Survey
- Degree Breakdown (186 people)
- None: 6 people
- High School: 35 people
- 2-Year Degree: 7 people
- Bachelor’s: 75 people
- Master’s: 36 people
- PhD: 17 people
- MD/JD/Other Professional Degree: 5 people
- Other: 3 people
- No Answer: 2 people
- Degree Breakdown (186 people)
- 2016 LW Diaspora Survey
- Degree Breakdown (2259 people)
- None: 96 people
- High School: 617 people
- 2-Year Degree: 105 people
- Bachelor’s: 815 people
- Master’s: 415 people
- PhD: 145 people
- JD/MD/Other Professional Degree: 66 people
- Degree Breakdown (2259 people)
- 2014 LW Survey
- Degree Breakdown (1503 people)
- None: 74 people
- High School: 347 people
- 2-Year Degree: 64 people
- Bachelor’s: 555 people
- Master’s: 278 people
- PhD: 105 people
- MD/JD/Other Professional Degree: 44 people
- Other: 24 people
- No Answer: 12 people
- Degree Breakdown (1503 people)
- 2013 LW Survey
- Degree Breakdown (1635 people)
- None: 84 people
- High School: 444 people
- 2-Year Degree: 68 people
- Bachelor’s: 554 people
- Master’s: 323 people
- PhD: 90 people
- MD/JD/Other Professional Degree: 31 people
- Other: 22 people
- No Answer: 19 people
- Degree Breakdown (1635 people)
- 2012 LW Survey
- Degree Breakdown (1185 people)
- None: 55 people
- High School: 333 people
- 2-Year Degree: 43 people
- Bachelor’s: 438 people
- Master’s: 192 people
- PhD: 71 people
- MD/JD/Other Professional Degree: 24 people
- Other: 15 people
- No Answer: 14 people
- Degree Breakdown (1185 people)
- 2011 LW Survey
- Degree Breakdown (1090 people)
- None / High School / 2-Year Degree: 418 people
- Bachelor’s: 400 people
- Master’s: 175 people
- PhD: 65 people
- MD/JD/Other Professional Degree: 19 people
- No Answer: 13 people
- Degree Breakdown (1090 people)
- 2024 LW Survey
-
Slate Star Codex / Astral Codex Ten Surveys Featuring Education
- 2024 ACX Survey
- Education Breakdown (5955 people)
- None: 106 people
- High School: 607 people
- 2-Year Degree: 121 people
- Bachelor’s: 2188 people
- Master’s: 1691 people
- PhD: 858 people
- MD: 107 people
- JD: 201 people
- Other Professional Degree: 76 people
- Education Breakdown (5955 people)
- 2022 ACX Survey
- Education Breakdown (7317 people)
- None: 114 people
- High School: 768 people
- 2-Year Degree: 131 people
- Bachelor’s: 2739 people
- Master’s: 2053 people
- PhD: 1061 people
- MD: 140 people
- JD: 229 people
- Other Professional Degree: 82 people
- Education Breakdown (7317 people)
- 2020 SSC Survey
- Education Breakdown (7912 people)
- None: 145 people
- High School: 1068 people
- 2-Year Degree: 193 people
- Bachelor’s: 3130 people
- Master’s: 1988 people
- PhD: 951 people
- MD: 108 people
- JD: 223 people
- Other Professional Degree: 106 people
- Education Breakdown (7912 people)
- 2019 SSC Survey
- Education Breakdown (7407 people)
- None: 164 people
- High School: 1047 people
- 2-Year Degree: 216 people
- Bachelor’s: 2934 people
- Master’s: 1778 people
- PhD: 829 people
- MD: 98 people
- JD: 249 people
- Other Professional Degree: 92 people
- Education Breakdown (7407 people)
- 2018 SSC Survey
- Education Breakdown (7960 people)
- None: 173 people
- High School: 1192 people
- 2-Year Degree: 200 people
- Bachelor’s: 3144 people
- Master’s: 1914 people
- PhD: 880 people
- MD: 86 people
- JD: 277 people
- Other Professional Degree: 94 people
- Education Breakdown (7960 people)
- 2017 SSC Survey
- Education Breakdown (5484 people)
- None: 143 people
- High School: 908 people
- 2-Year Degree: 136 people
- Bachelor’s: 2217 people
- Master’s: 1202 people
- PhD: 551 people
- MD: 65 people
- JD: 199 people
- Other Professional Degree: 63 people
- Education Breakdown (5484 people)
- 2024 ACX Survey
-
LessWrong Surveys Featuring Politics
- 2024 LW Survey
- Political Breakdown (224 people)
- Libertarian: 71 people
- Conservative: 13 people
- Liberal: 94 people
- Social Democratic: 46 people
- Political Breakdown (224 people)
- 2023 LW Survey
- Political Breakdown (403 people)
- Libertarian: 124 people
- Conservative: 10 people
- Liberal: 159 people
- Social Democratic: 110 people
- Political Breakdown (403 people)
- 2022 LW Survey
- Political Breakdown (131 people)
- Libertarian: 56 people
- Conservative: 3 people
- Liberal: 45 people
- Social Democratic: 27 people
- Political Breakdown (131 people)
- 2016 LW Diaspora Survey
- Political Breakdown (2034 people)
- Libertarian: 519 people
- Conservative: 115 people
- Liberal: 614 people
- Social Democratic: 786 people
- Political Breakdown (2034 people)
- 2014 LW Survey
- Political Breakdown (1447 people)
- Libertarian: 379 people
- Conservative: 67 people
- Liberal: 416 people
- Social Democratic: 585 people
- Political Breakdown (1447 people)
- 2013 LW Survey
- Political Breakdown (1583 people)
- Libertarian: 437 people
- Conservative: 64 people
- Liberal: 580 people
- Socialist: 502 people
- Political Breakdown (1583 people)
- 2012 LW Survey
- Political Breakdown (1147 people)
- Libertarian: 359 people
- Conservative: 35 people
- Liberal: 427 people
- Socialist: 326 people
- Political Breakdown (1147 people)
- 2011 LW Survey
- Political Breakdown (1048 people)
- Libertarian: 352 people
- Conservative: 30 people
- Liberal: 376 people
- Socialist: 290 people
- Political Breakdown (1048 people)
- 2009 LW Survey
- Political Breakdown (138 people)
- Libertarian: 62 people
- Conservative: 6 people
- Liberal: 53 people
- Socialist: 17 people
- Political Breakdown (138 people)
- 2024 LW Survey
-
Slate Star Codex / Astral Codex Ten Surveys Featuring Politics
- 2024 ACX Survey
- Political Breakdown (5786 people)
- Libertarian: 1168 people
- Conservative: 562 people
- Liberal: 2027 people
- Social Democratic: 1726 people
- Marxist: 110 people
- Neoreactionary: 104 people
- Alt-Right: 89 people
- Political Breakdown (5786 people)
- 2022 ACX Survey
- Political Breakdown (7102 people)
- Libertarian: 1494 people
- Conservative: 643 people
- Liberal: 2374 people
- Social Democratic: 2223 people
- Marxist: 133 people
- Neoreactionary: 140 people
- Alt-Right: 95 people
- Political Breakdown (7102 people)
- 2020 SSC Survey
- Political Breakdown (7659 people)
- Libertarian: 1534 people
- Conservative: 574 people
- Liberal: 2272 people
- Social Democratic: 2559 people
- Marxist: 163 people
- Neoreactionary: 388 people
- Alt-Right: 169 people
- Political Breakdown (7659 people)
- 2019 SSC Survey
- Political Breakdown (7433 people)
- Libertarian: 1561 people
- Conservative: 526 people
- Liberal: 2062 people
- Social Democratic: 2297 people
- Marxist: 136 people
- Neoreactionary: 389 people
- Alt-Right: 205 people
- Political Breakdown (7433 people)
- 2018 SSC Survey
- Political Breakdown (7585 people)
- Libertarian: 1697 people
- Conservative: 520 people
- Liberal: 2362 people
- Social Democratic: 2300 people
- Marxist: 159 people
- Neoreactionary: 387 people
- Alt-Right: 160 people
- Political Breakdown (7585 people)
- 2017 SSC Survey
- Political Breakdown (4807 people)
- Libertarian: 1276 people
- Conservative: 299 people
- Liberal: 1350 people
- Social Democratic: 1533 people
- Communist: 22 people
- Neoreactionary: 240 people
- Alt-Right: 87 people
- Political Breakdown (4807 people)
- 2014 SSC Survey
- Political Breakdown
- Libertarian: 22%
- Conservative: 9%
- Liberal: 23%
- Social Democratic: 29%
- Marxist: ???
- Neoreactionary: ???
- Alt-Right: ???
- Political Breakdown
- 2024 ACX Survey
-
Effective Altruism Surveys Featuring Politics
- EA Survey 2024: Demographics
- Political Breakdown (1797 people)
- Left: 26.2%
- Center Left: 43.8%
- Center: 11.9%
- Center Right: 3.3%
- Right: 1.2%
- Libertarian: 7.3%
- Other: 6.4%
- Political Breakdown (1797 people)
- EA Survey 2022: Demographics
- Political Breakdown (2963 people)
- Left: 36.8%
- Center Left: 39.8%
- Center: 8.1%
- Center Right: 2.2%
- Right: 0.7%
- Libertarian: 5.6%
- Other: 6.9%
- Political Breakdown (2963 people)
- EA Survey 2019 Series: Community Demographics & Characteristics
- Political Breakdown (1816 people)
- Left: 578 people
- Center Left: 731 people
- Center: 160 people
- Center Right: 46 people
- Right: 17 people
- Libertarian: 158 people
- Other: 126 people
- Political Breakdown (1816 people)
- EA Survey 2018 Series: Community Demographics & Characteristics
- Political Breakdown (2244 people)
- Left: 741 people
- Center Left: 855 people
- Center: 225 people
- Center Right: 57 people
- Right: 13 people
- Libertarian: 187 people
- Other: 166 people
- Political Breakdown (2244 people)
- EA Survey 2017 Series: Demographics II
- Political Breakdown (989 people)
- Left: 309 people
- Center Left: 373 people
- Center: 85 people
- Center Right: 31 people
- Right: 4 people
- Libertarian: 92 people
- Other: 95 people
- Political Breakdown (989 people)
- The 2015 Survey of Effective Altruists: Results and Analysis
- Political Breakdown (1327 people)
- Left: 512 people
- Center Left: 472 people
- Center: 107 people
- Center Right: 51 people
- Right: 15 people
- Libertarian: 170 people
- Other: NA
- Political Breakdown (1327 people)
- EA Survey 2024: Demographics