Factor Analyses I Find Interesting
Rethinking the Human Development Index
The Human Development Index is intended to measure, well… human development (whatever that means). It’s a composite of life expectancy at birth, education (mean years of schooling completed and expected years of schooling upon entering the system), and gross national income per capita.
The main problem with the HDI is that its weighting of variables is essentially arbitrary, and the index provides no representation of uncertainty in its rankings.
Fortunately, some economists have taken an interest. The authors of Using Spatial Factor Analysis to Measure Human Development proposed a Bayesian factor analysis model as an alternative. The model estimates the weights for each indicator, incorporates spatial correlation (the assumption that neighboring countries resemble one another), and applies population weighting (the assumption that estimates for more populous countries should be more precise).
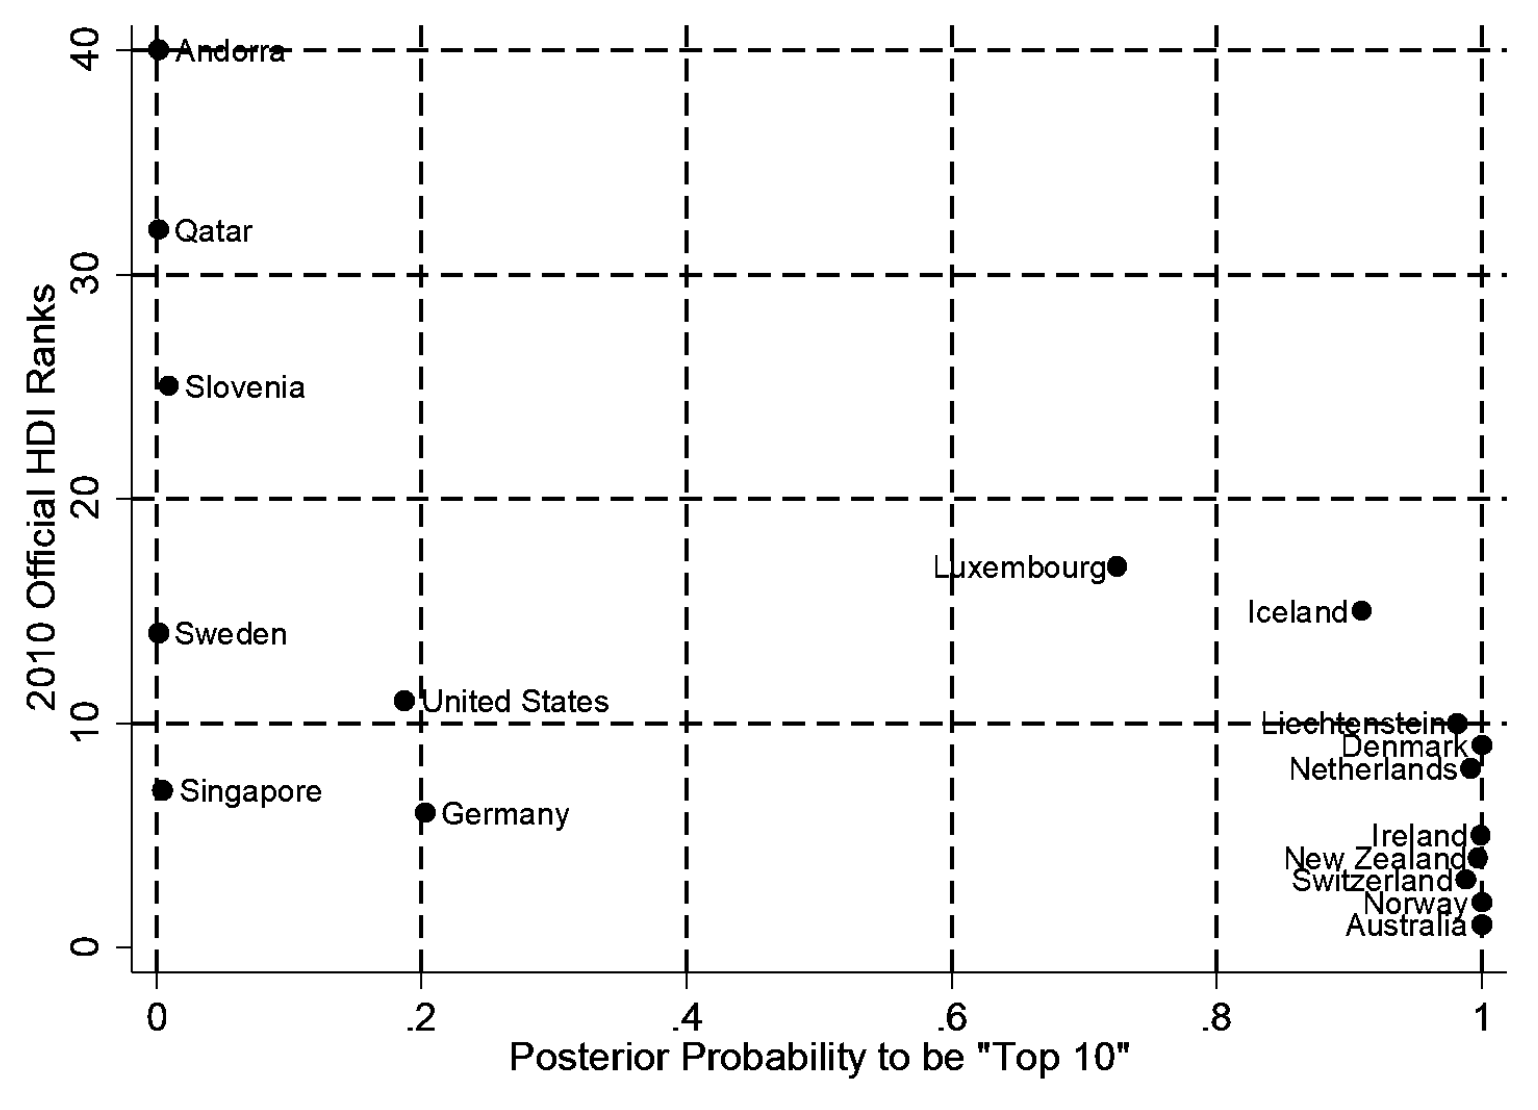
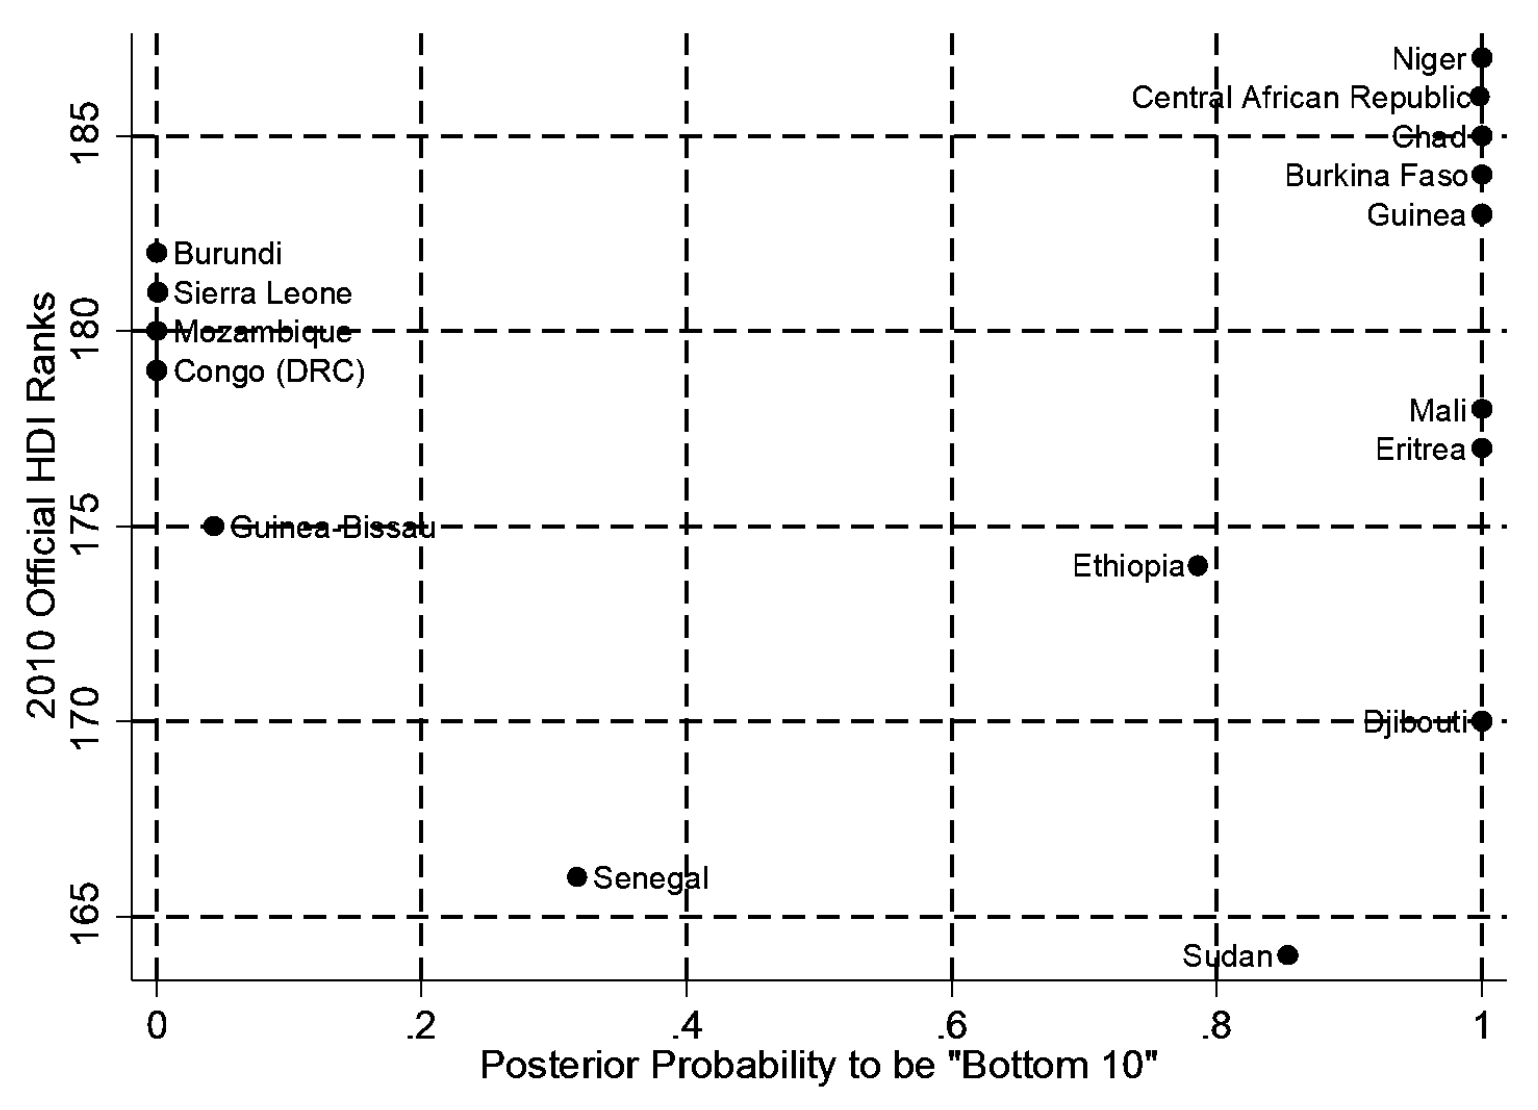
Although their rankings agree with the UN’s for many countries, they diverge in notable ways. For example, the HDI ranks of Kiribati, the DRC, and Mongolia appear much too low, while those of Japan, Mexico, and Pakistan appear much too high.
It’s nice (and rare) to see one of these measures that is actually statistically grounded.
Estimating City-Level Policy Conservatism
To measure the conservatism of each city’s public policy preferences the authors of Representation in Municipal Government first estimated the ideal policy positions of hundreds of thousands of Americans. They combined several large-scale surveys, each with 14–32 policy questions and very large samples (30,000–80,000 respondents). They assumed quadratic utility with normal errors and a single left–right policy dimension. Using a Bayesian Item Response Theory model, they estimated ideal points for more than 275,000 individuals.
Next, they used Bayesian multilevel regression and poststratification (MRP) to estimate each city’s overall policy conservatism. This model incorporates respondents’ demographics and geographic information to infer public opinion for each city.
They validated these city-level estimates by comparing them to presidential voting patterns. The city conservatism measure correlated .77 with Obama’s 2008 vote share, suggesting that their estimates capture cities’ left–right preferences well.
Their work led to the following plot:
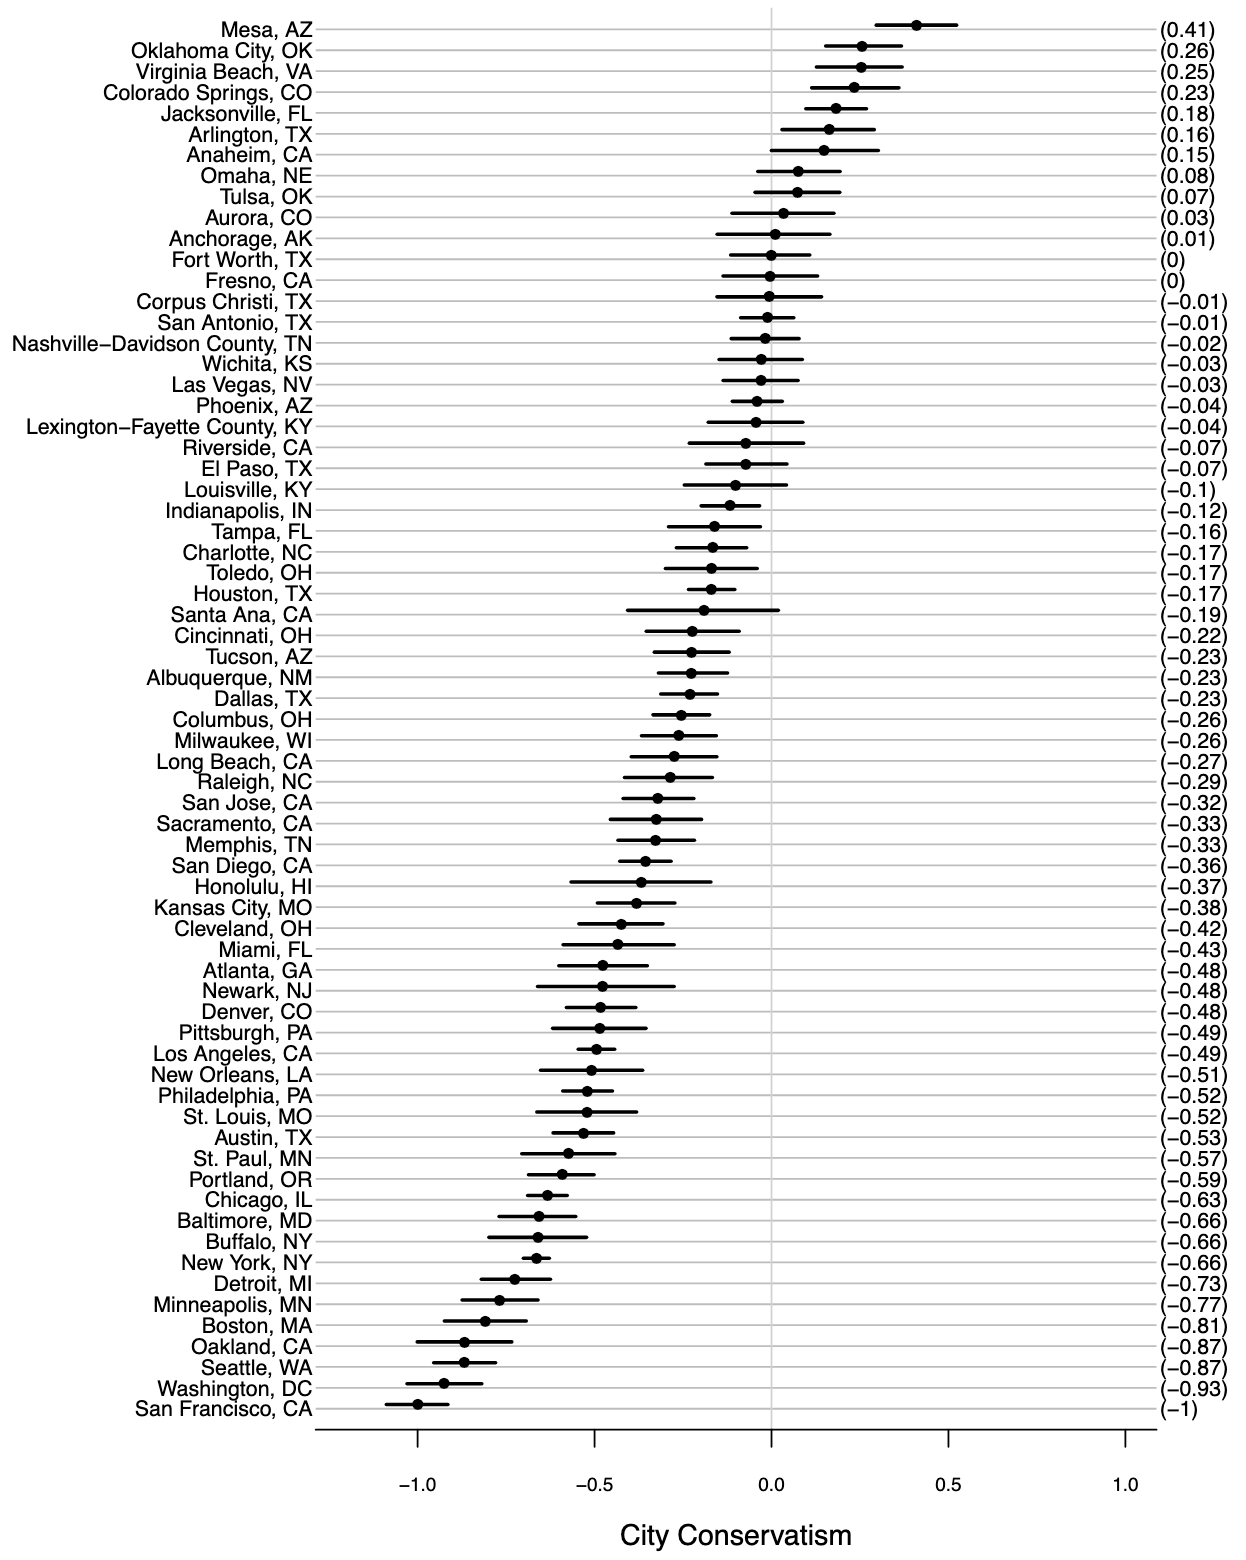
Common stereotypes such as San Francisco and Seattle being super liberal are confirmed, but really, it’s just nice to see city political levels with credibility intervals.
The Structure of Modern Conspiracist Thought
This survey on belief in conspiracy theories included an unusually large set of specific and wide-ranging items—far more detailed than most studies in the field. It contained 85 statements, covering claims such as: black holes don’t exist, serial killers are a myth, global warming is fake, dinosaurs never existed, JFK faked his death, vaccines cause autism, and many others. A factor analysis of these items yielded six factors:
- Generic Conspiracy: 22 items on a variety of nonspecific conspiracies
- Aliens & Satanism: 17 items concerning topics like the existence of aliens and alleged Satanic practices of the elite
- Flat Earth and Terrain Theory: 10 items concerning astronomy relevant to the shape of the Earth, as well as questions about viruses and bacteria and their role in disease
- Jewish Conspiracy: 8 items concerning the representation of Jews in positions of power
- Fakery: 16 items related to hoaxes, faked historical events, and faked deaths
- Climate Change: 10 questions pertaining to the theory of anthropogenic global warming and other miscellaneous topics.
What makes this study interesting is that the author is a self-professed conspiracy theorist who is deeply embedded in that culture, allowing him to interpret the factors in ways outsiders are unlikely to. He considers the Generic Conspiracy factor uninteresting, noting that it mostly reflects the most widely endorsed beliefs.
The Aliens & Satanism factor is, in his view, not really about aliens or Satanism at all. Instead, he frames it as the “mainstream conspiracy/QAnon/controlled opposition” narrative: a set of beliefs he sees as deliberate misdirection (some items obviously so, such as the claim that elites are reptilians). The Fakery factor, by contrast, represents a third position opposed to both the mainstream narrative (Generic Conspiracy) and the controlled-opposition narrative (Aliens & Satanism). It represents radical skepticism about historical narratives (though not necessarily the general arc of history) and doubt that events unfolded as historians describe.
The Flat Earth factor extends this skepticism further, applying it to anything not directly observable. Neither the shape of the Earth, the existence of dinosaurs, nor the function of DNA are directly observable; these things must all be inferred from scientific evidence. If you can’t collect or interpret any of this evidence yourself, and you believe that the establishment is lying all the time about everything, you may end up endorsing positions that load on this factor. This stance resembles a form of scientific anti-realism, which “applies chiefly to claims about the non-reality of unobservable entities such as electrons or genes, which are not detectable with human senses.”
The Jewish Conspiracy factor encompasses claims about Jewish global influence and doubts about the scale or reality of the Holocaust. The Climate Change factor does not appear to have a coherent underlying basis; several items seem to reflect young Earth creationism, which has a coherent theoretical basis but no clear link to climate change.
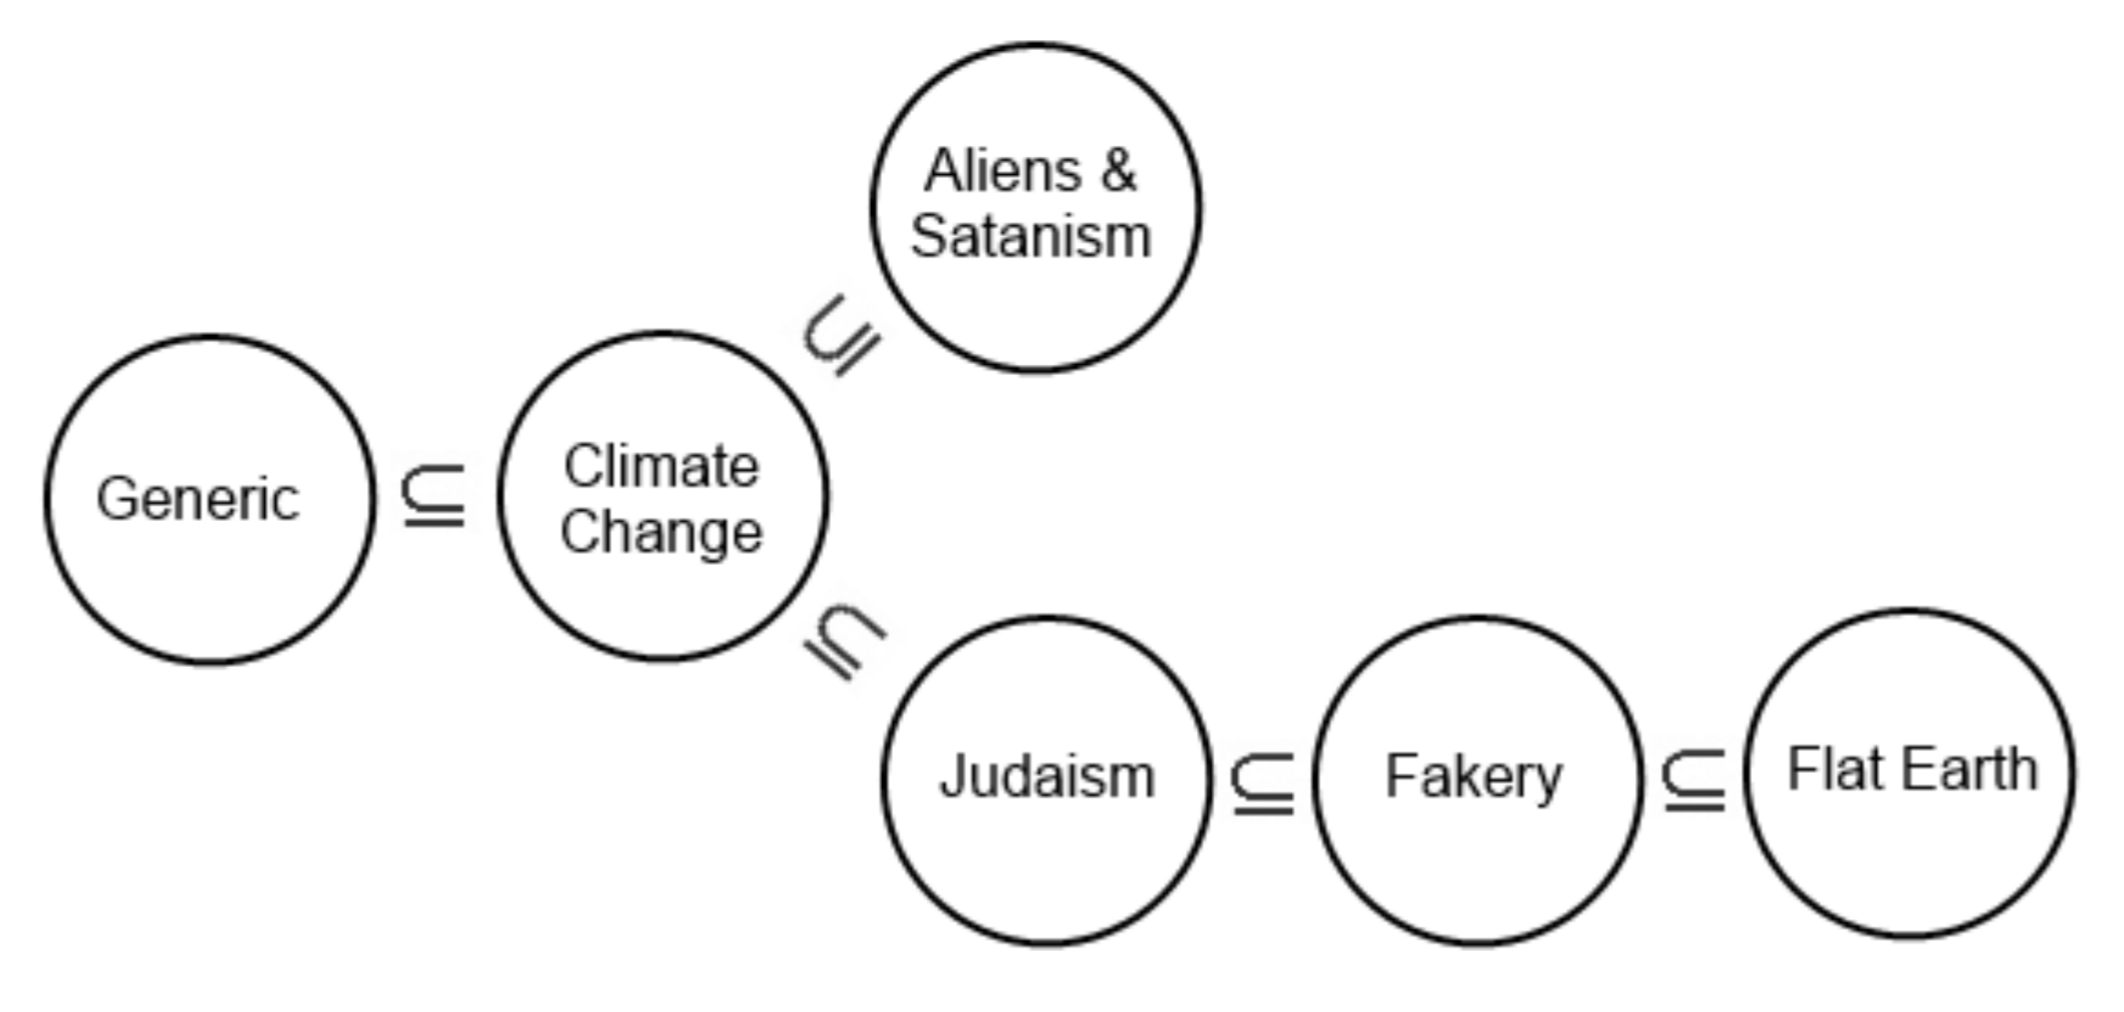
They also noticed that certain factors appeared to constrain others. For example, all respondents who scored highly on the Flat Earth factor also scored at least as high on the Generic Conspiracy factor; however, those who scored highly on the Generic Conspiracy factor could have any score on the Flat Earth factor. From this, he inferred a partial ordering that revealed two divergent streams of conspiracist ideation.
Modeling National Differences in Mental Sport Performance
In this study, Emil Kirkegaard collected lists of the top players in 12 mental sports (DOTA 2, League of Legends, CSGO, StarCraft 2, Counter-Strike, Hearthstone, Overwatch, Super Smash Bros. Melee, chess, Go, poker, and Scrabble), and fit a model to predict the number of top players in each country based on population. He saved the residuals and then factor-analyzed them to create a measure of latent national general gaming ability.
It really is impressive that this just works. I’d never thought of factor-analyzing residuals, but it appears to be a valid method.
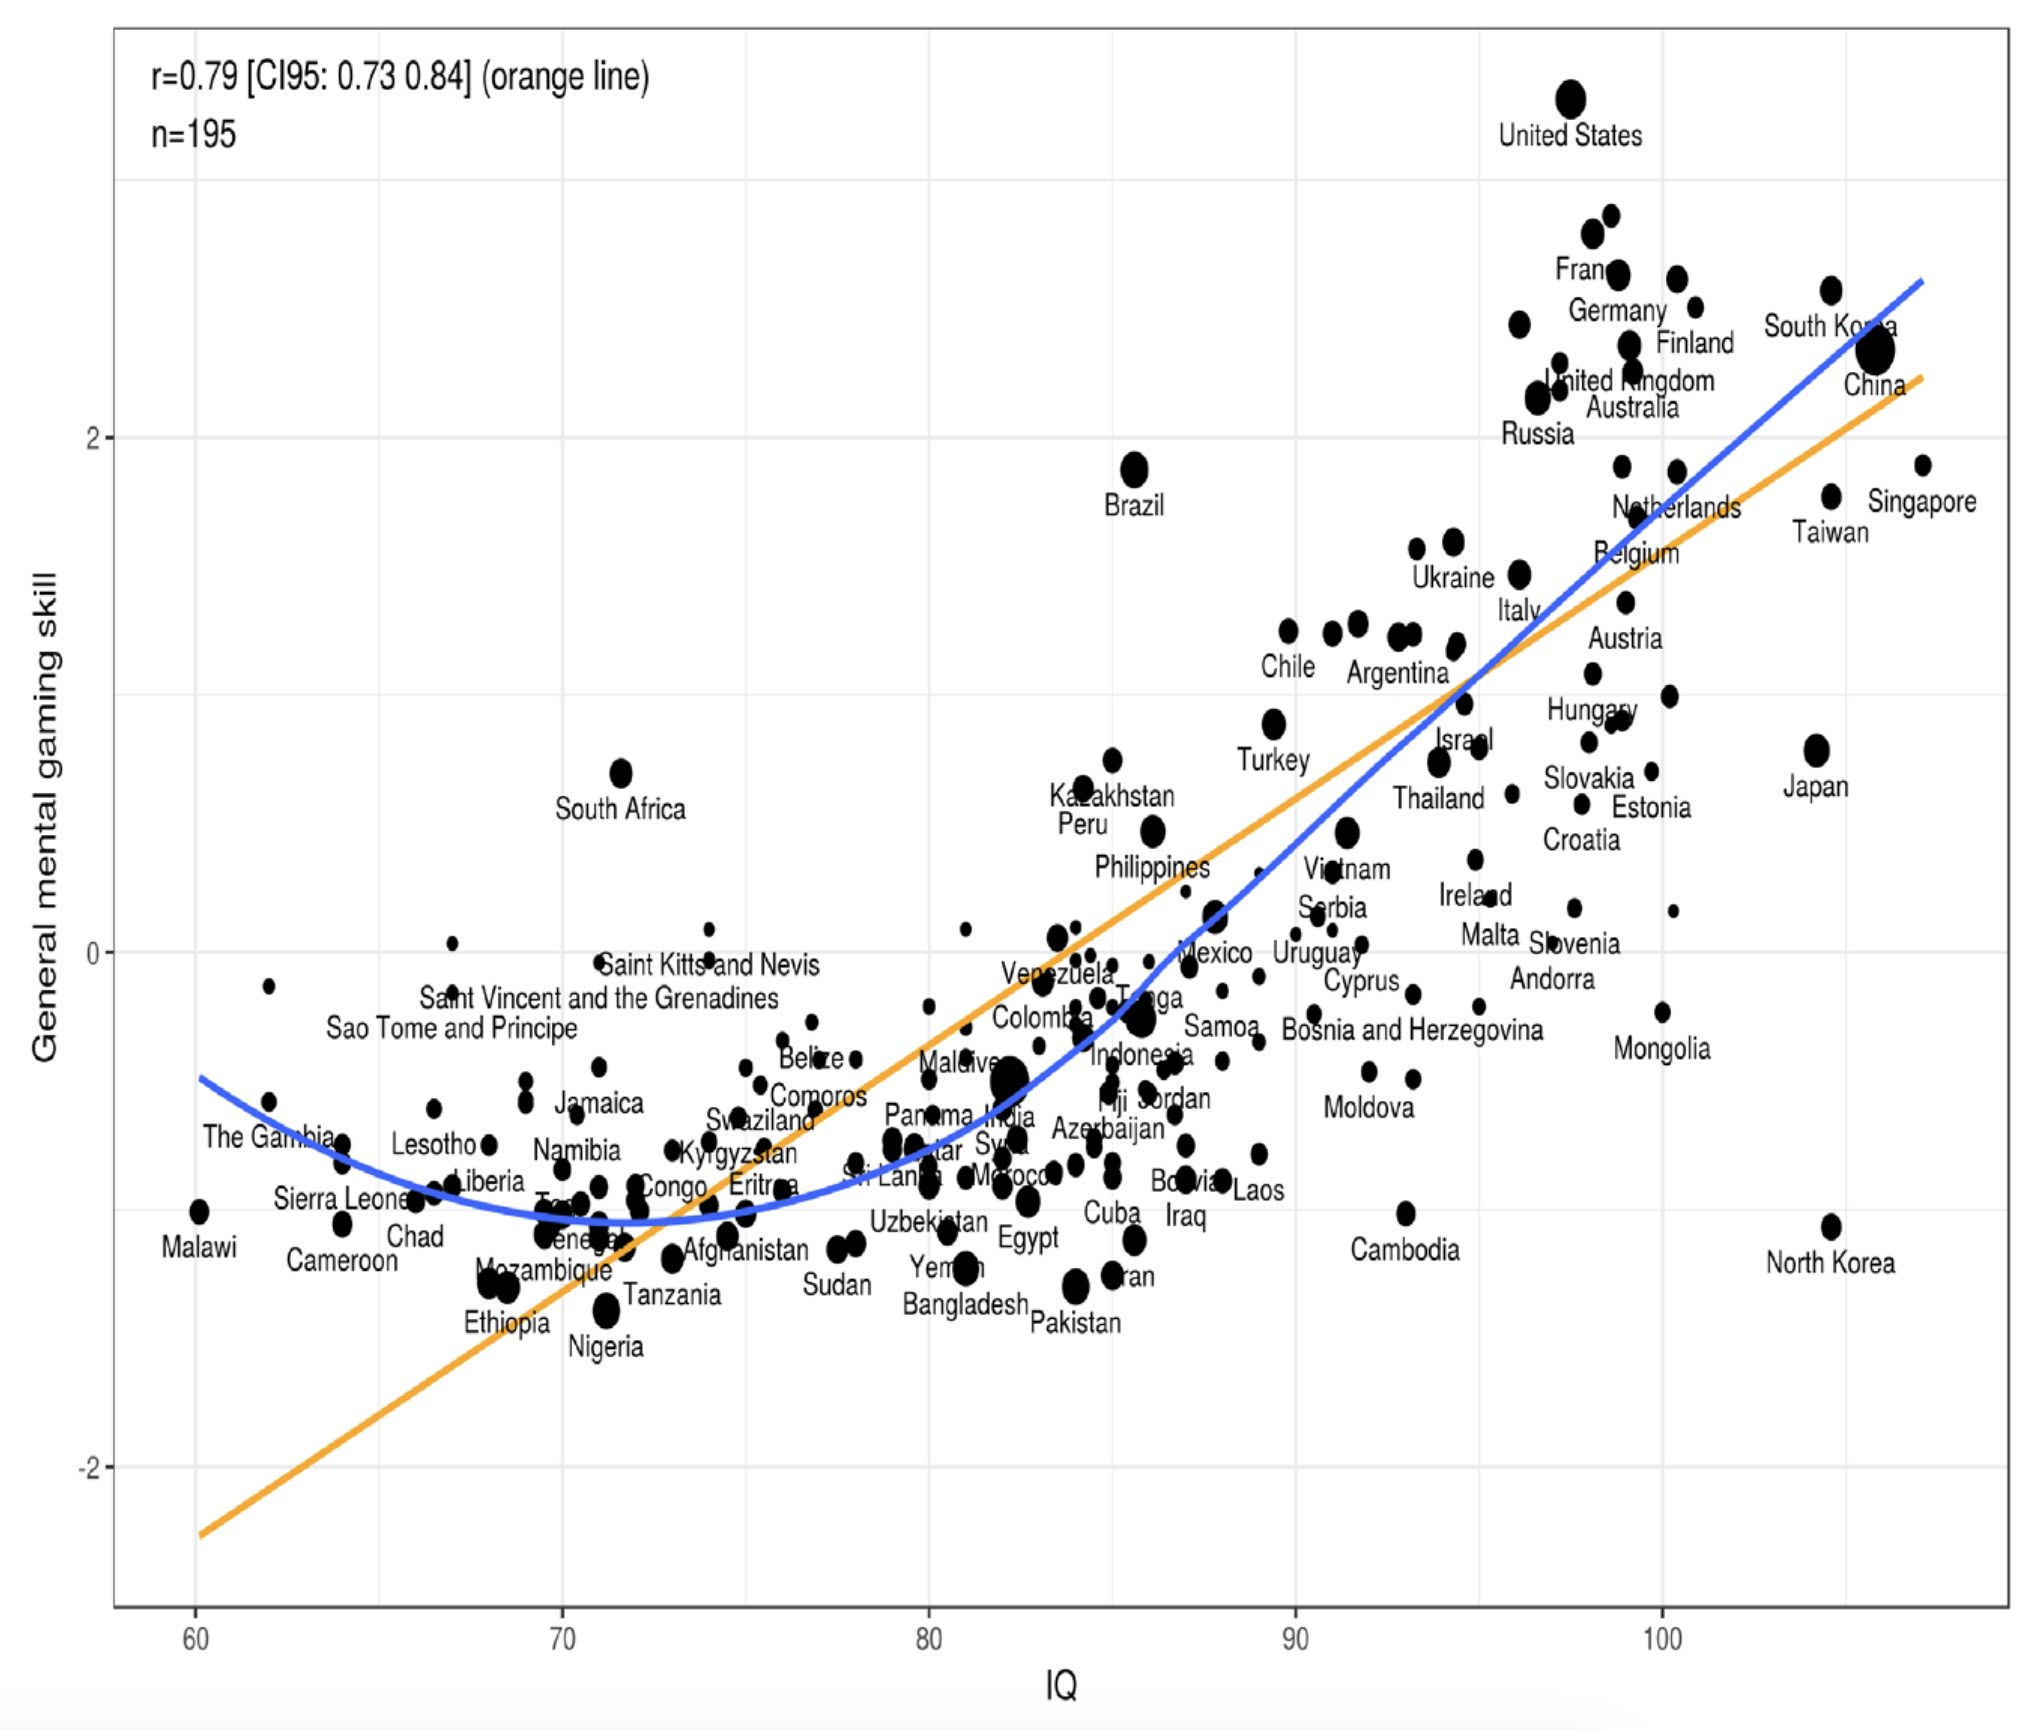
National gaming ability ended up showing a nonlinear (but strong) relationship with national IQ. Notable outliers included North Korea (which performed worse than expected for obvious reasons) and South Africa, Brazil, and the United States, which all performed much better than expected.
Another finding was that Go wasn’t a good indicator of national gaming ability, largely because it is played predominantly in East Asian countries.
Two Dimensions of U.S. City Livability
In this post, the author performed a principal components analysis on 18 city livability rankings, which yielded three distinct clusters. The first was a “happiness” cluster, which contained only a single ranking, and was therefore set aside. The other two clusters were more interesting. Rankings produced by American websites, reports, and consumer advocacy groups formed a cluster he called the “Chill Rankings” (all-American, domestic, down-home). Rankings produced by international organizations or arts- and business-oriented groups formed a cluster he called the “Jetsetter Rankings” (metro, international, cosmopolitan).
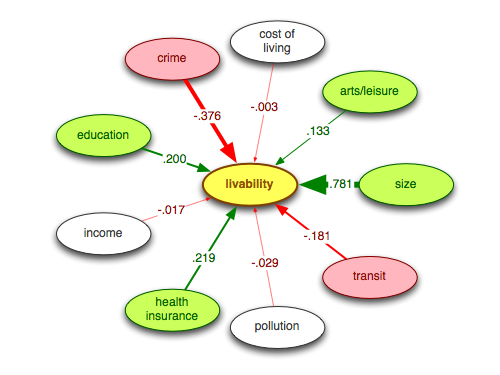
For each cluster of rankings, he fit a structural equation model (SEM) using the following variables as predictors: cost of living, arts and leisure, city size, transit, pollution, health insurance, income, education, and crime.
The SEM for the Chill Rankings is shown below:
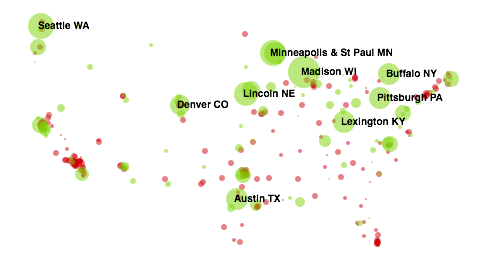
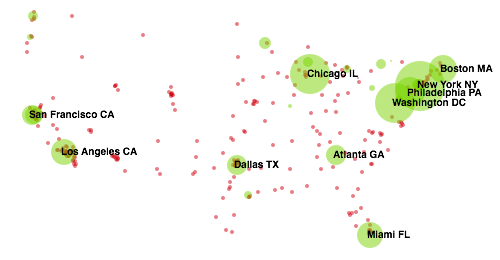
Here is the corresponding “livability map” of the most Chill cities, with the top ten labeled. Green circles indicate above-average scores (red indicates below-average), and circle size reflects the magnitude of the latent livability score:
The SEM for the Jetsetter Rankings is shown here:
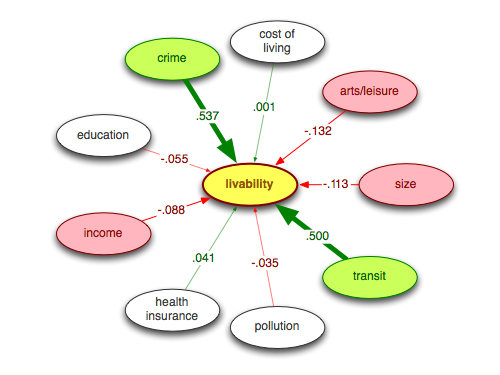
And here is the corresponding Jetsetter livability map, again with the top ten cities labeled:
It really is interesting that there appear to be only two distinct kinds of U.S. city rankings—and that the Chill and Jetsetter livability constructs turn out to be orthogonal!
The Factor Structure of Hand Preference
This paper examined several different handedness surveys. Of particular note was the Edinburgh Handedness Inventory (EHI). The methodology was as follows:
Participants were instructed to indicate their hand preference for the listed EHI activities by typing a “+” in the appropriate column (right or left). If a participant’s preference was so strong that they would never use the other hand unless forced to, they were instructed to type “++” in the appropriate column of right or left. If participants were indifferent to the hand they would use to complete the action, they were instructed to type a “+” in both columns. As per the original EHI instructions, participants were encouraged to try to answer all the questions, and told to only leave a blank if they had no experience at all with the object or task.
Their factor analysis produced the following loadings:
- Writing (0.96)
- Drawing (0.95)
- Scissors (0.90)
- Spoon (0.86)
- Toothbrush (0.83)
- Striking a match (match) (0.81)
- Throwing (0.75)
- Opening box (lid) (0.66)
- Broom (upper hand) (0.62)
- Knife (without fork) (0.57)
The magnitude of many of these loadings is striking. Writing has a loading of 0.96, which is nearly perfect. It really does seem that if you want to know whether someone is generally right- or left-handed, you can simply ask which hand they write with. This may have been obvious already, but it’s nice to have confirmation and reassuring to see the statistical methods behave as expected.
The Two Factors Underlying LLM Benchmark Scores
Epoch AI performed a principal components analysis (PCA) on various LLMs’ scores on a range of benchmarks. They found that benchmark scores were dominated by a single factor, a general factor of capabilities, which accounted for about half of the variance. While a general factor of capabilities is to be expected, the more interesting finding was what the second principal component measured. It corresponded to models that were “good at agentic tasks, but bad at vision… and also bad at math”. In other words, it was measuring Claudiness. And indeed, the top five models on that component were all Claudes. (The bottom five were all OpenAI GPT models.) This pattern suggests systematic differences in how different labs prioritize different capabilities.