What Is A Nerd? (A Psychometric Analysis of the NPAS)
What is a nerd? Definitions vary, but one practical way to answer that question is empirical: identify the traits that predict someone’s self-label of “nerd”. The Nerdy Personality Attributes Scale (NPAS) does exactly that. The creators began with 445 candidate items, had participants rate themselves on the items, report how nerdy they were, and then kept the 26 items most strongly correlated with self-reported nerdiness1. Below I describe the data, the factor structure, reliability and validity, gender bias in items, a reduced 12-item set, and what the findings imply about the prototypical “nerd.”
Data
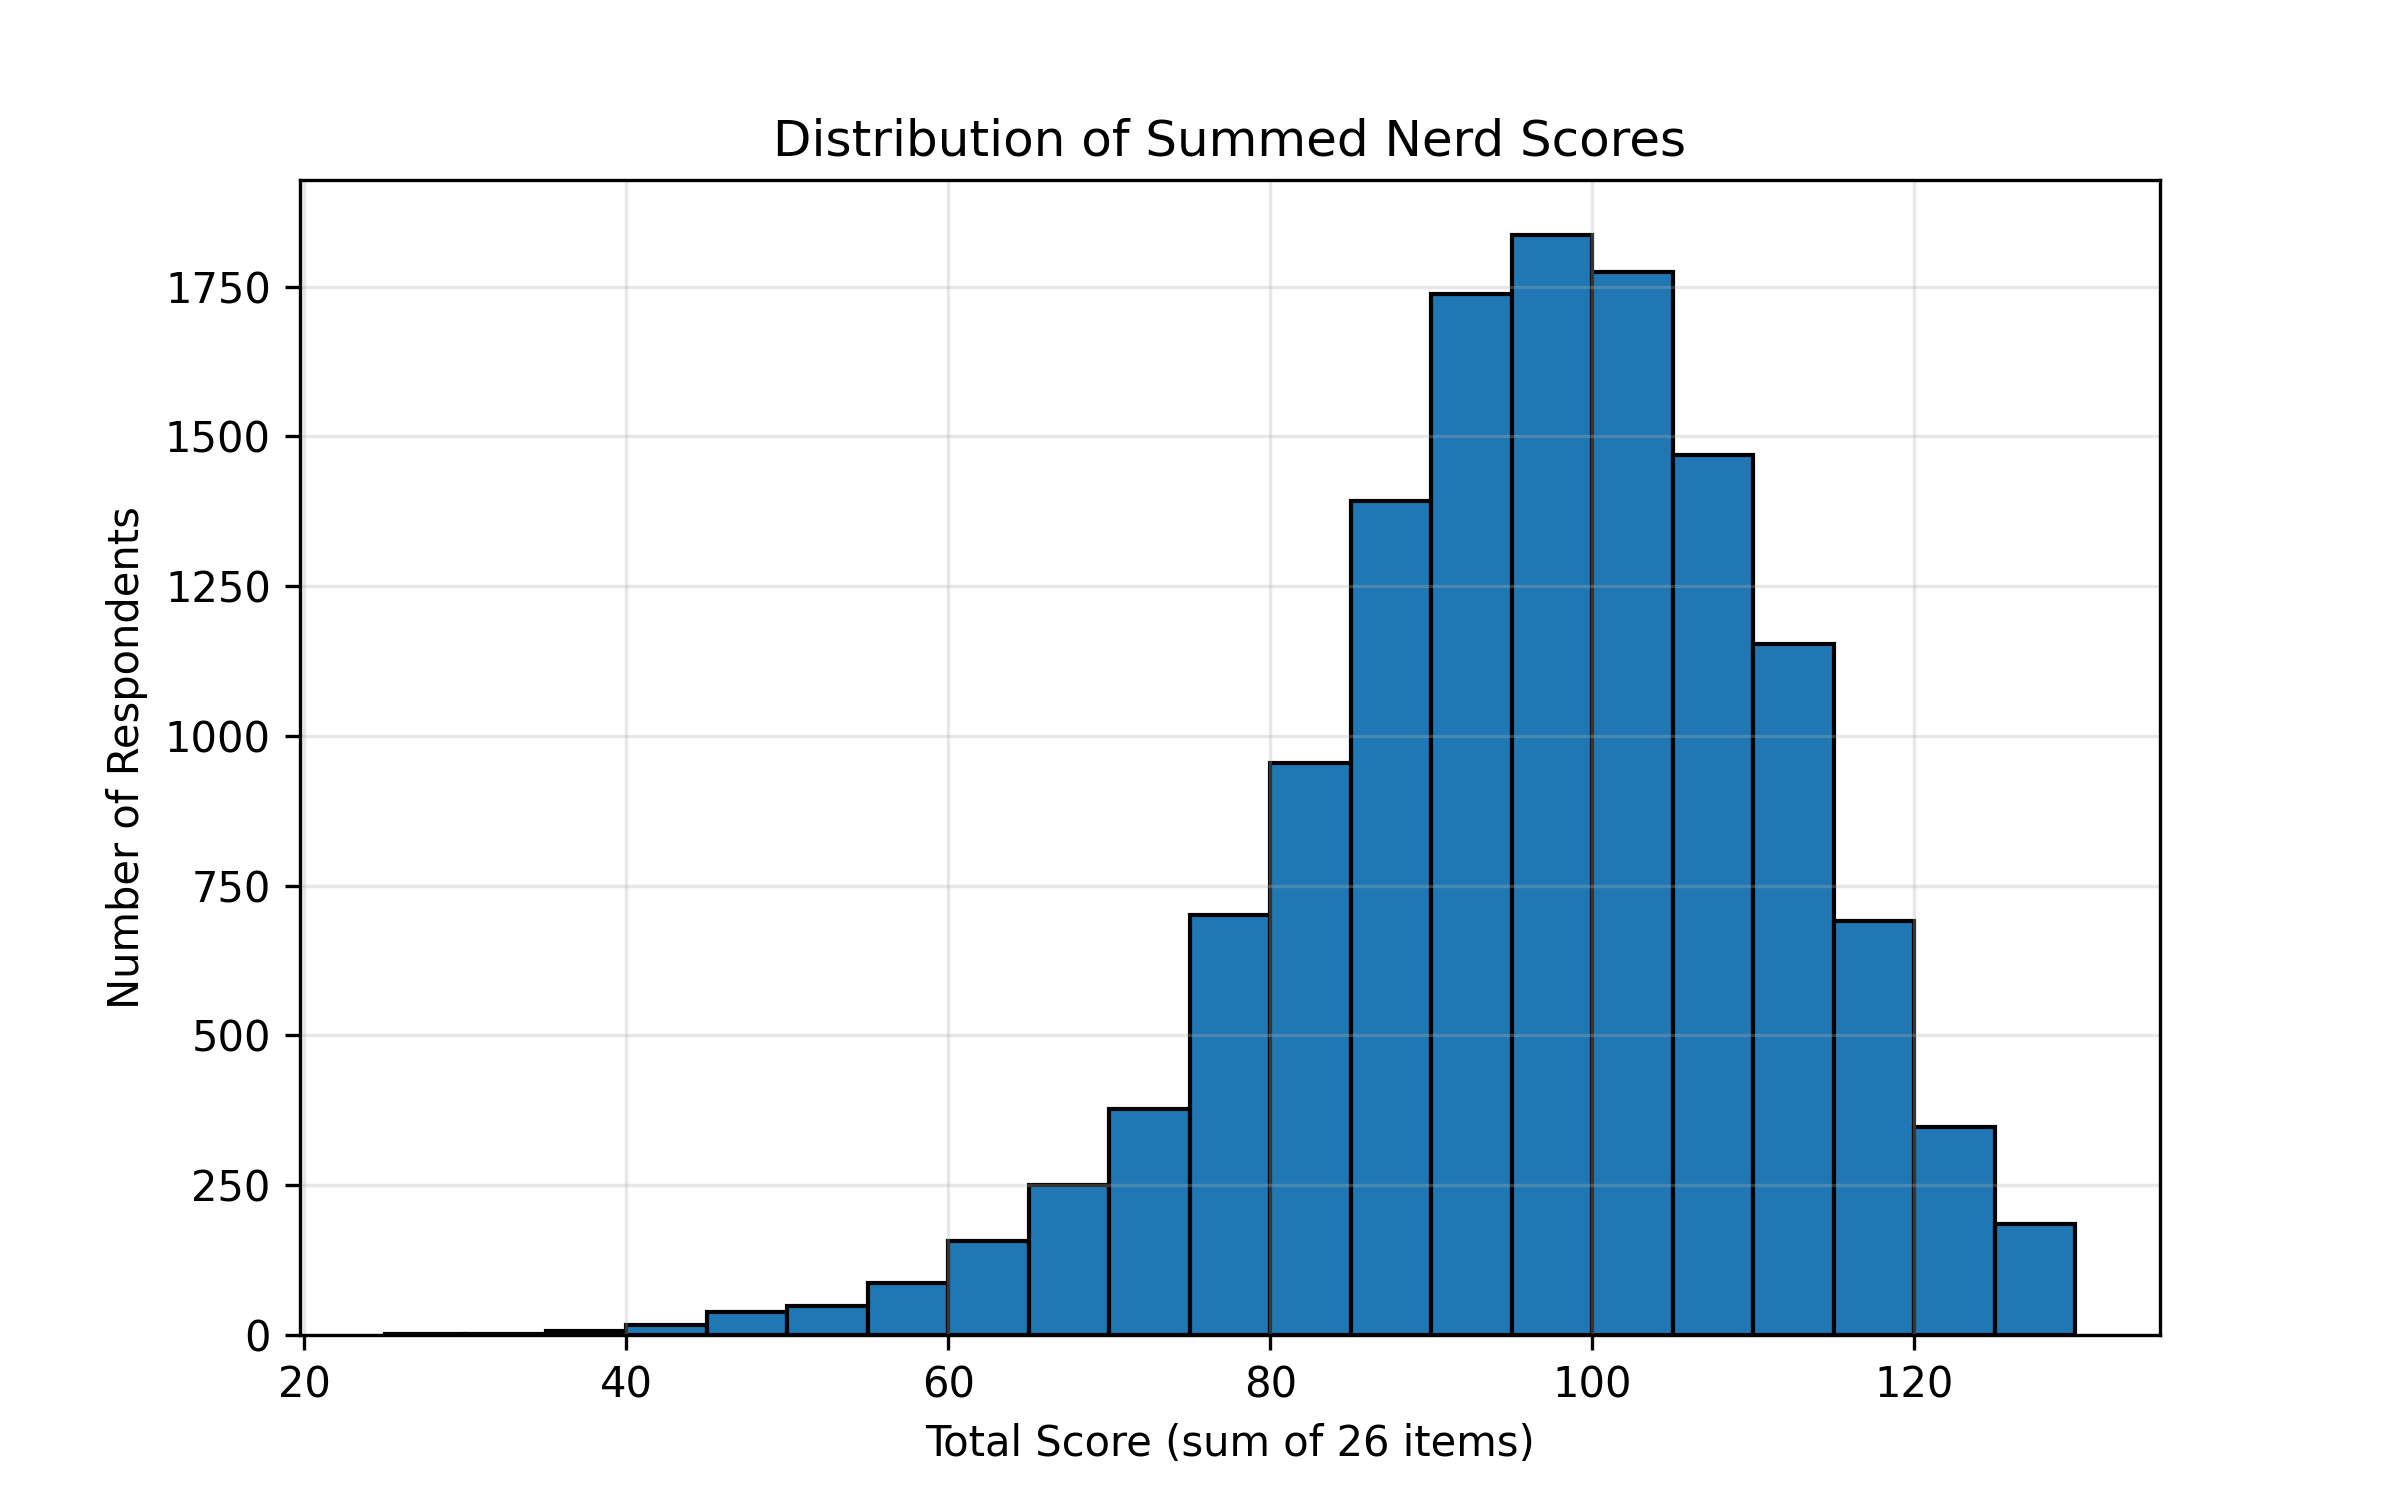
The analysis uses the public NPAS dataset from Open Psychometrics (N = 14,167). Respondents rated 26 items on a five-point scale from Strongly Disagree (1) to Strongly Agree (5). The sample is self-selected (visitors to an online psychometrics site); the sample is likely nerdier than average.
Factor Structure
Exploratory factor analysis produced a clear one-factor solution; additional factors were uninterpretable. The factor loadings are as follows:
| Question | Loading |
|---|---|
| Q5: I collect books. | 0.58 |
| Q26: I can be socially awkward at times. | 0.57 |
| Q9: I like science fiction. | 0.56 |
| Q13: I would describe my smarts as bookish. | 0.56 |
| Q24: I am a strange person. | 0.55 |
| Q6: I prefer academic success to social success. | 0.54 |
| Q17: I am more comfortable interacting online than in person. | 0.54 |
| Q4: My appearance is not as important as my intelligence. | 0.50 |
| Q20: I was a very odd child. | 0.50 |
| Q10: I would rather read a book than go to a party. | 0.49 |
| Q1: I am interested in science. | 0.48 |
| Q8: I spend recreational time researching topics others might find dry or overly rigorous. | 0.48 |
| Q23: I get excited about my ideas and research. | 0.47 |
| Q14: I like to read technology news reports. | 0.47 |
| Q12: I spend more time at the library than any other public place. | 0.47 |
| Q3: I like to play RPGs. (Ex. D&D) | 0.44 |
| Q7: I watch science related shows. | 0.43 |
| Q22: I enjoy learning more than I need to. | 0.42 |
| Q2: I was in advanced classes. | 0.42 |
| Q16: I gravitate towards introspection. | 0.39 |
| Q25: I care about super heroes. | 0.38 |
| Q21: I sometimes prefer fictional people to real ones. | 0.35 |
| Q18: I love to read challenging material. | 0.30 |
| Q11: I am more comfortable with my hobbies than I am with other people. | 0.29 |
| Q15: I have started writing a novel. | 0.28 |
| Q19: I have played a lot of video games. | 0.22 |
Internal Consistency
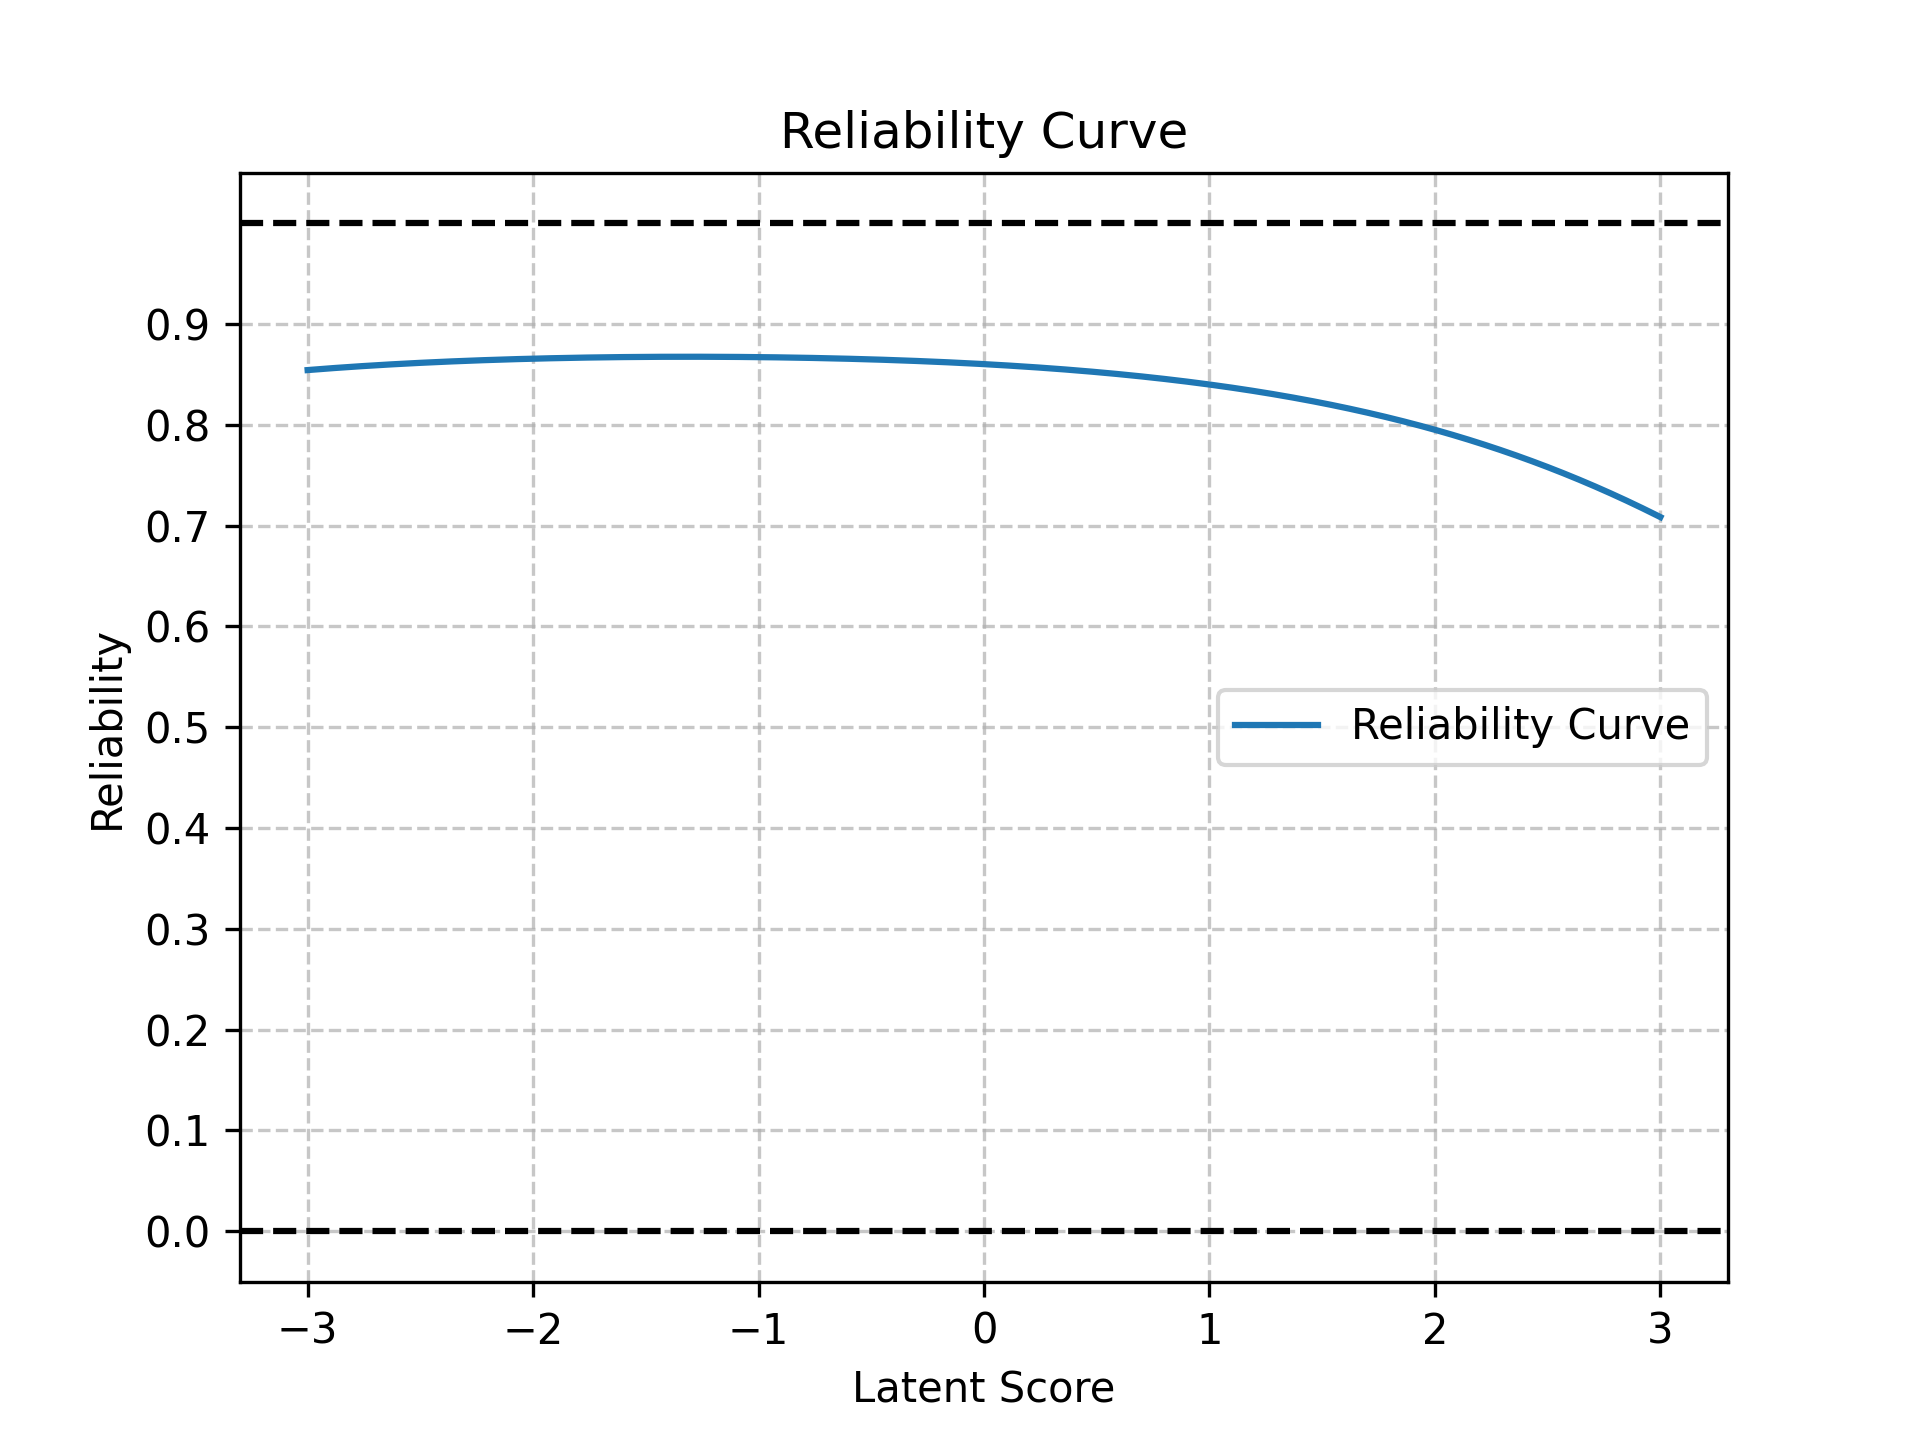
The coefficient omega is 0.87, a level of internal consistency that supports treating the 26 items as a coherent scale. However, test information declines above +1 SD on the latent trait, indicating the NPAS has fewer items that discriminate high levels of nerdiness in this sample. This is consistent with a ceiling effect in the population, probably as a result of the self-selection. The latent nerdiness score correlates r = 0.51 with self-reported nerdiness (1–7 scale) which supports validity.
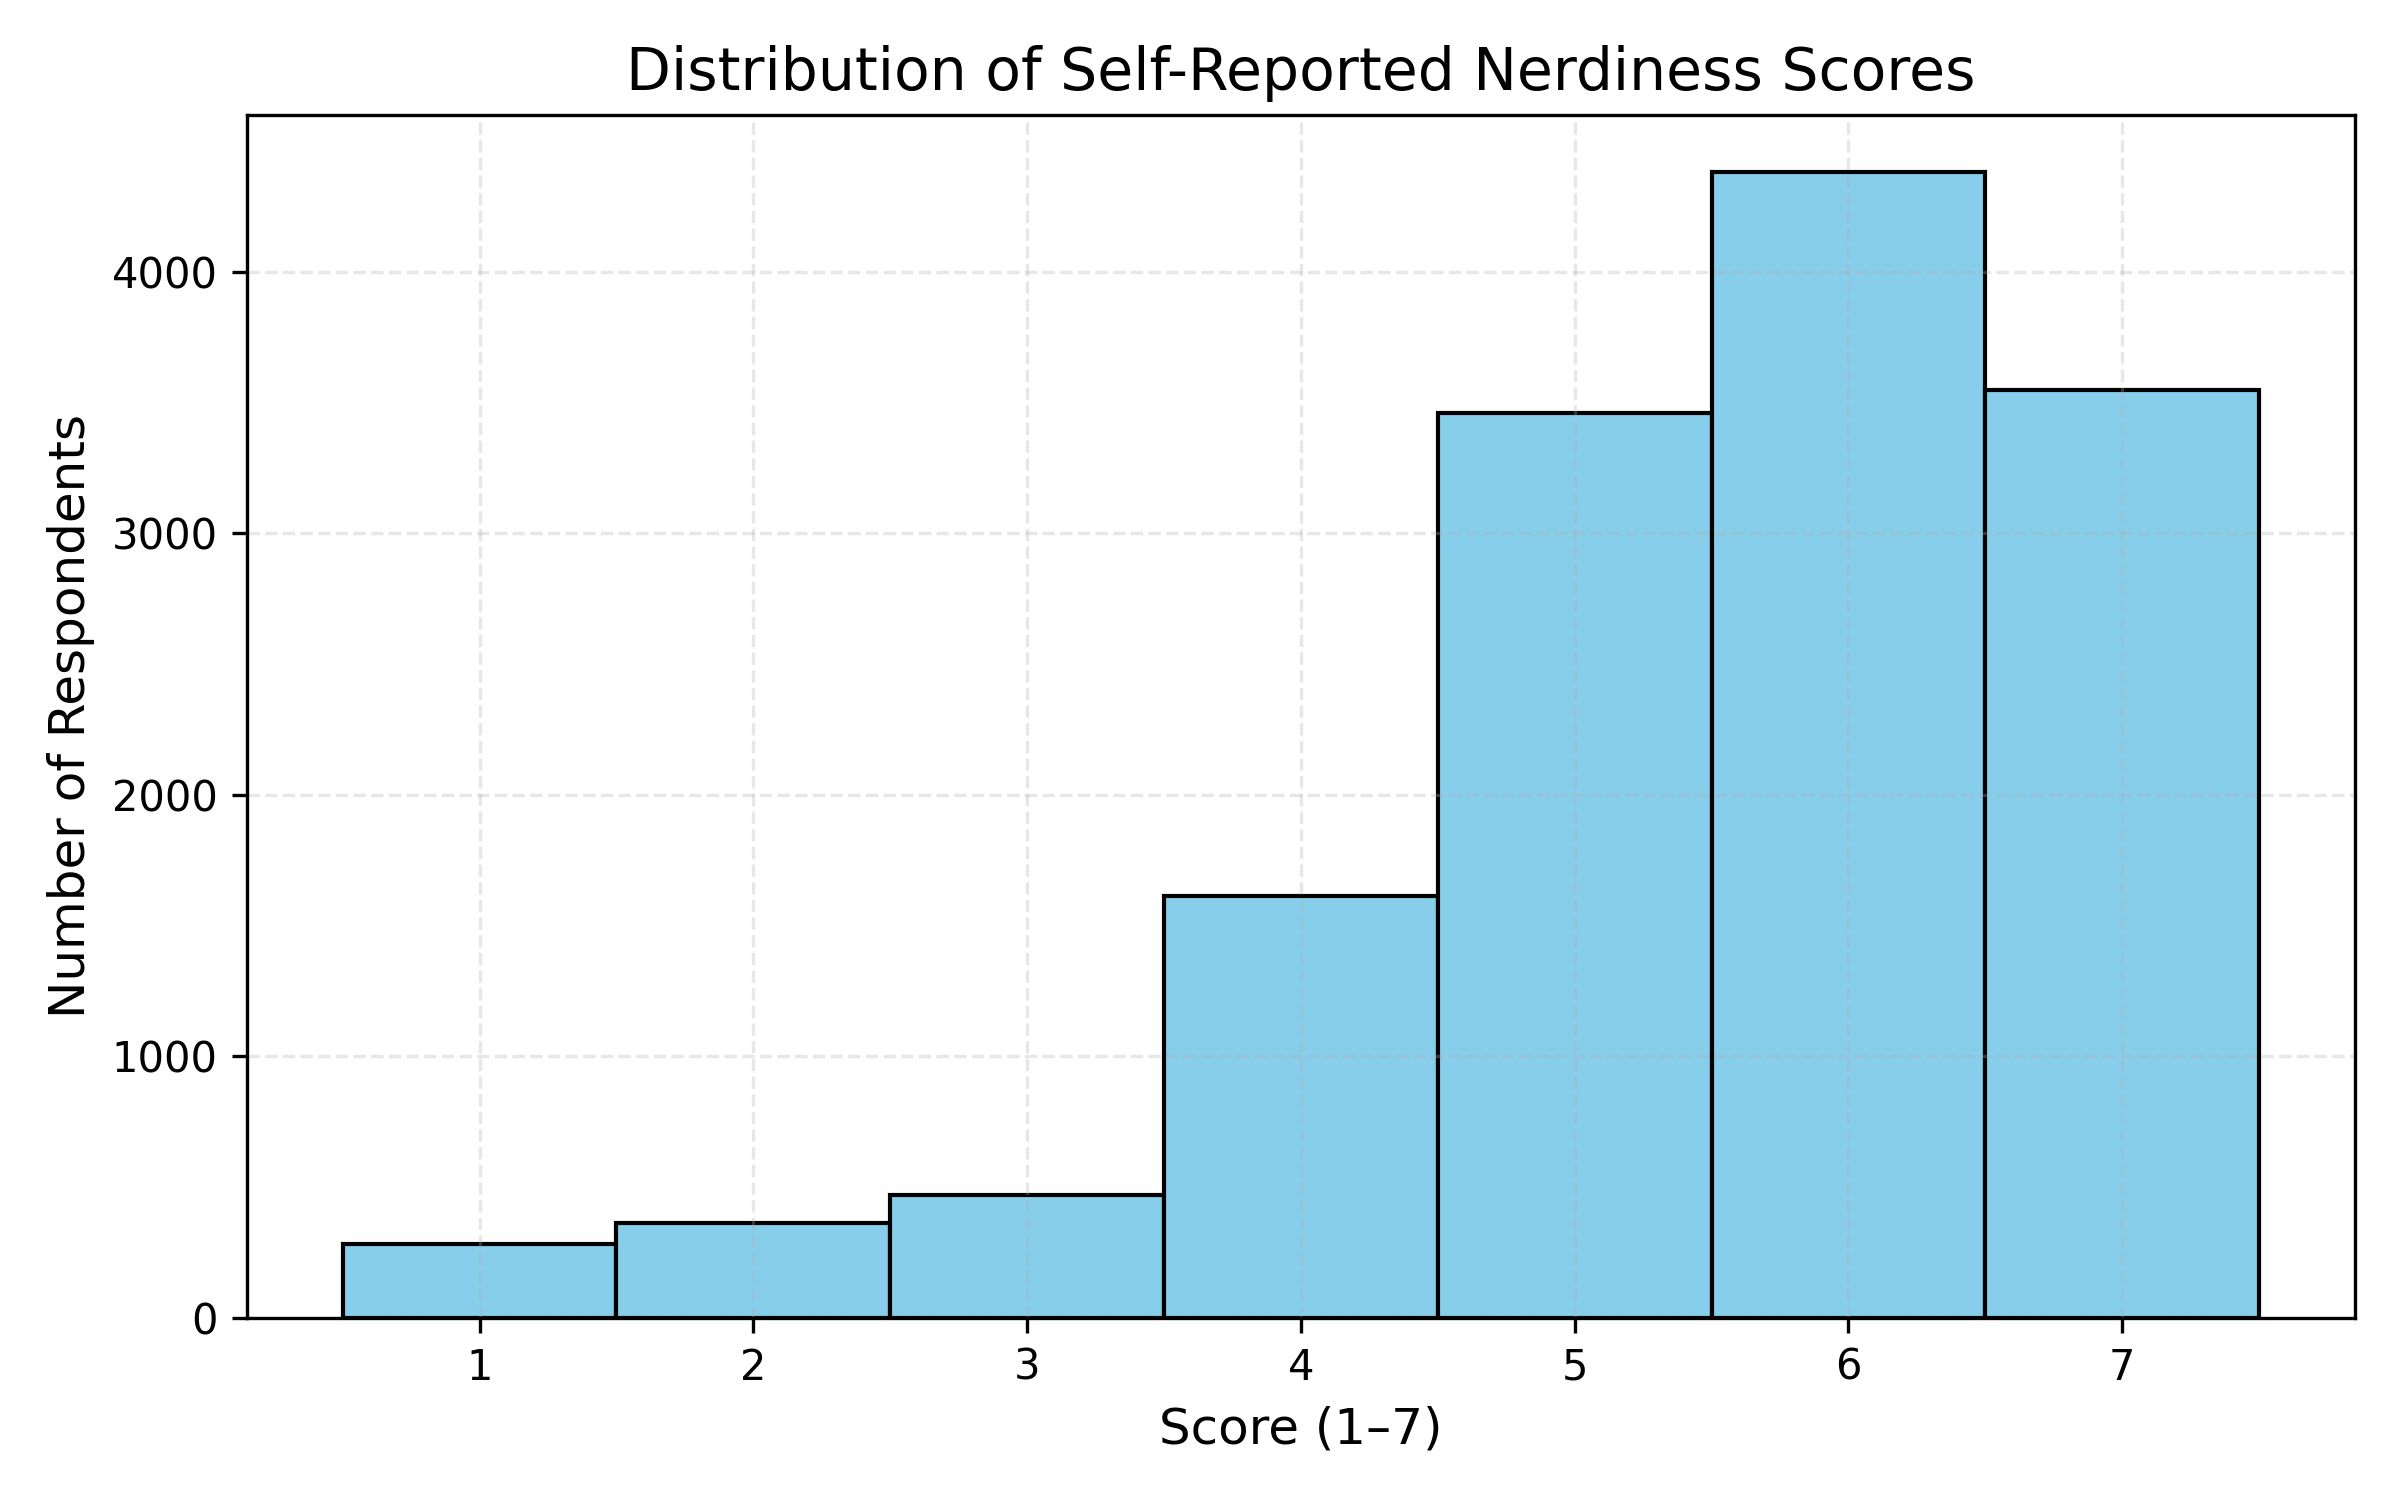
The latent nerd scores and self-reported nerdiness correlate relatively weakly for two measures intended to assess the same construct. Examining the self-reported nerdiness histogram, one issue appears to be that the data is highly skewed: the vast majority of respondents agree at least a little that they are nerdy. One way to address this is to resample the data to obtain a broader (in this case, uniform) distribution. When this is done, the correlation between latent nerdiness and self-reported nerdiness increases to 0.57. Alternatively, computing a polyserial correlation (appropriate for an ordinal and a continuous variable) yields a correlation of 0.56, similar to the resampled correlation.
Examination of Gender Differences
Before analyzing gender differences, it is necessary to verify that the scale functions similarly for men and women. First, I check whether any item loadings differ by gender. An item whose loading varies substantially across genders indicates a difference in how central that item is to the underlying construct of nerdiness. The table below shows item loadings for each gender and the between-group differences. Items in bold are those whose loadings differ meaningfully by gender.
| Male | Female | Difference | |
|---|---|---|---|
| Q1: I am interested in science. | 0.48 | 0.48 | -0.00 |
| Q2: I was in advanced classes. | 0.38 | 0.44 | -0.07 |
| Q3: I like to play RPGs. (Ex. D&D) | 0.44 | 0.44 | 0.01 |
| Q4: My appearance is not as important as my intelligence. | 0.49 | 0.51 | -0.02 |
| Q5: I collect books. | 0.57 | 0.59 | -0.02 |
| Q6: I prefer academic success to social success. | 0.54 | 0.54 | -0.00 |
| Q7: I watch science related shows. | 0.46 | 0.43 | 0.03 |
| Q8: I spend recreational time researching topics others might find dry or overly rigorous. | 0.46 | 0.50 | -0.04 |
| Q9: I like science fiction. | 0.55 | 0.57 | -0.02 |
| Q10: I would rather read a book than go to a party. | 0.51 | 0.47 | 0.04 |
| Q11: I am more comfortable with my hobbies than I am with other people. | 0.27 | 0.31 | -0.04 |
| Q12: I spend more time at the library than any other public place. | 0.44 | 0.49 | -0.05 |
| Q13: I would describe my smarts as bookish. | 0.58 | 0.56 | 0.03 |
| Q14: I like to read technology news reports. | 0.50 | 0.45 | 0.06 |
| Q15: I have started writing a novel. | 0.22 | 0.32 | -0.10 |
| Q16: I gravitate towards introspection. | 0.36 | 0.40 | -0.04 |
| Q17: I am more comfortable interacting online than in person. | 0.54 | 0.53 | 0.01 |
| Q18: I love to read challenging material. | 0.32 | 0.29 | 0.03 |
| Q19: I have played a lot of video games. | 0.20 | 0.25 | -0.05 |
| Q20: I was a very odd child. | 0.53 | 0.48 | 0.04 |
| Q21: I sometimes prefer fictional people to real ones. | 0.34 | 0.36 | -0.02 |
| Q22: I enjoy learning more than I need to. | 0.42 | 0.42 | -0.00 |
| Q23: I get excited about my ideas and research. | 0.47 | 0.49 | -0.03 |
| Q24: I am a strange person. | 0.56 | 0.54 | 0.01 |
| Q25: I care about super heroes. | 0.38 | 0.41 | -0.02 |
| Q26: I can be socially awkward at times. | 0.56 | 0.57 | -0.01 |
The only item that showed a substantial difference in loadings was Q15: “I have started writing a novel,” which loaded more strongly for women than for men. This suggests that novel-writing relates to nerdiness differently across genders; it is less central to the idea of male nerdiness than to female nerdiness. Because the loadings differ for this item, it will be excluded from the gender difference analysis.
Next, I tested for differential item functioning2 (DIF) by gender. Items with absolute DIF magnitude > 0.10 are shown below; positive values indicate greater probability of endorsement for women at the same latent level; negative values favor men.
Biased in favor of women:
- Q8: I spend recreational time researching topics others might find dry or overly rigorous. (+0.19)
- Q23: I get excited about my ideas and research. (+0.17)
- Q21: I sometimes prefer fictional people to real ones. (+0.16)
- Q13: I would describe my smarts as bookish. (+0.14)
- Q22: I enjoy learning more than I need to. (+0.12)
Biased in favor of men:
- Q19: I have played a lot of video games. (-0.25)
- Q25: I care about super heroes. (-0.24)
- Q11: I am more comfortable with my hobbies than I am with other people. (-0.15)
- Q7: I watch science related shows. (-0.15)
- Q5: I collect books. (-0.11)
Several biased items reflect cultural differences in hobby expression and media consumption rather than differences in the underlying latent trait. The distribution of latent nerdiness by gender is displayed below:
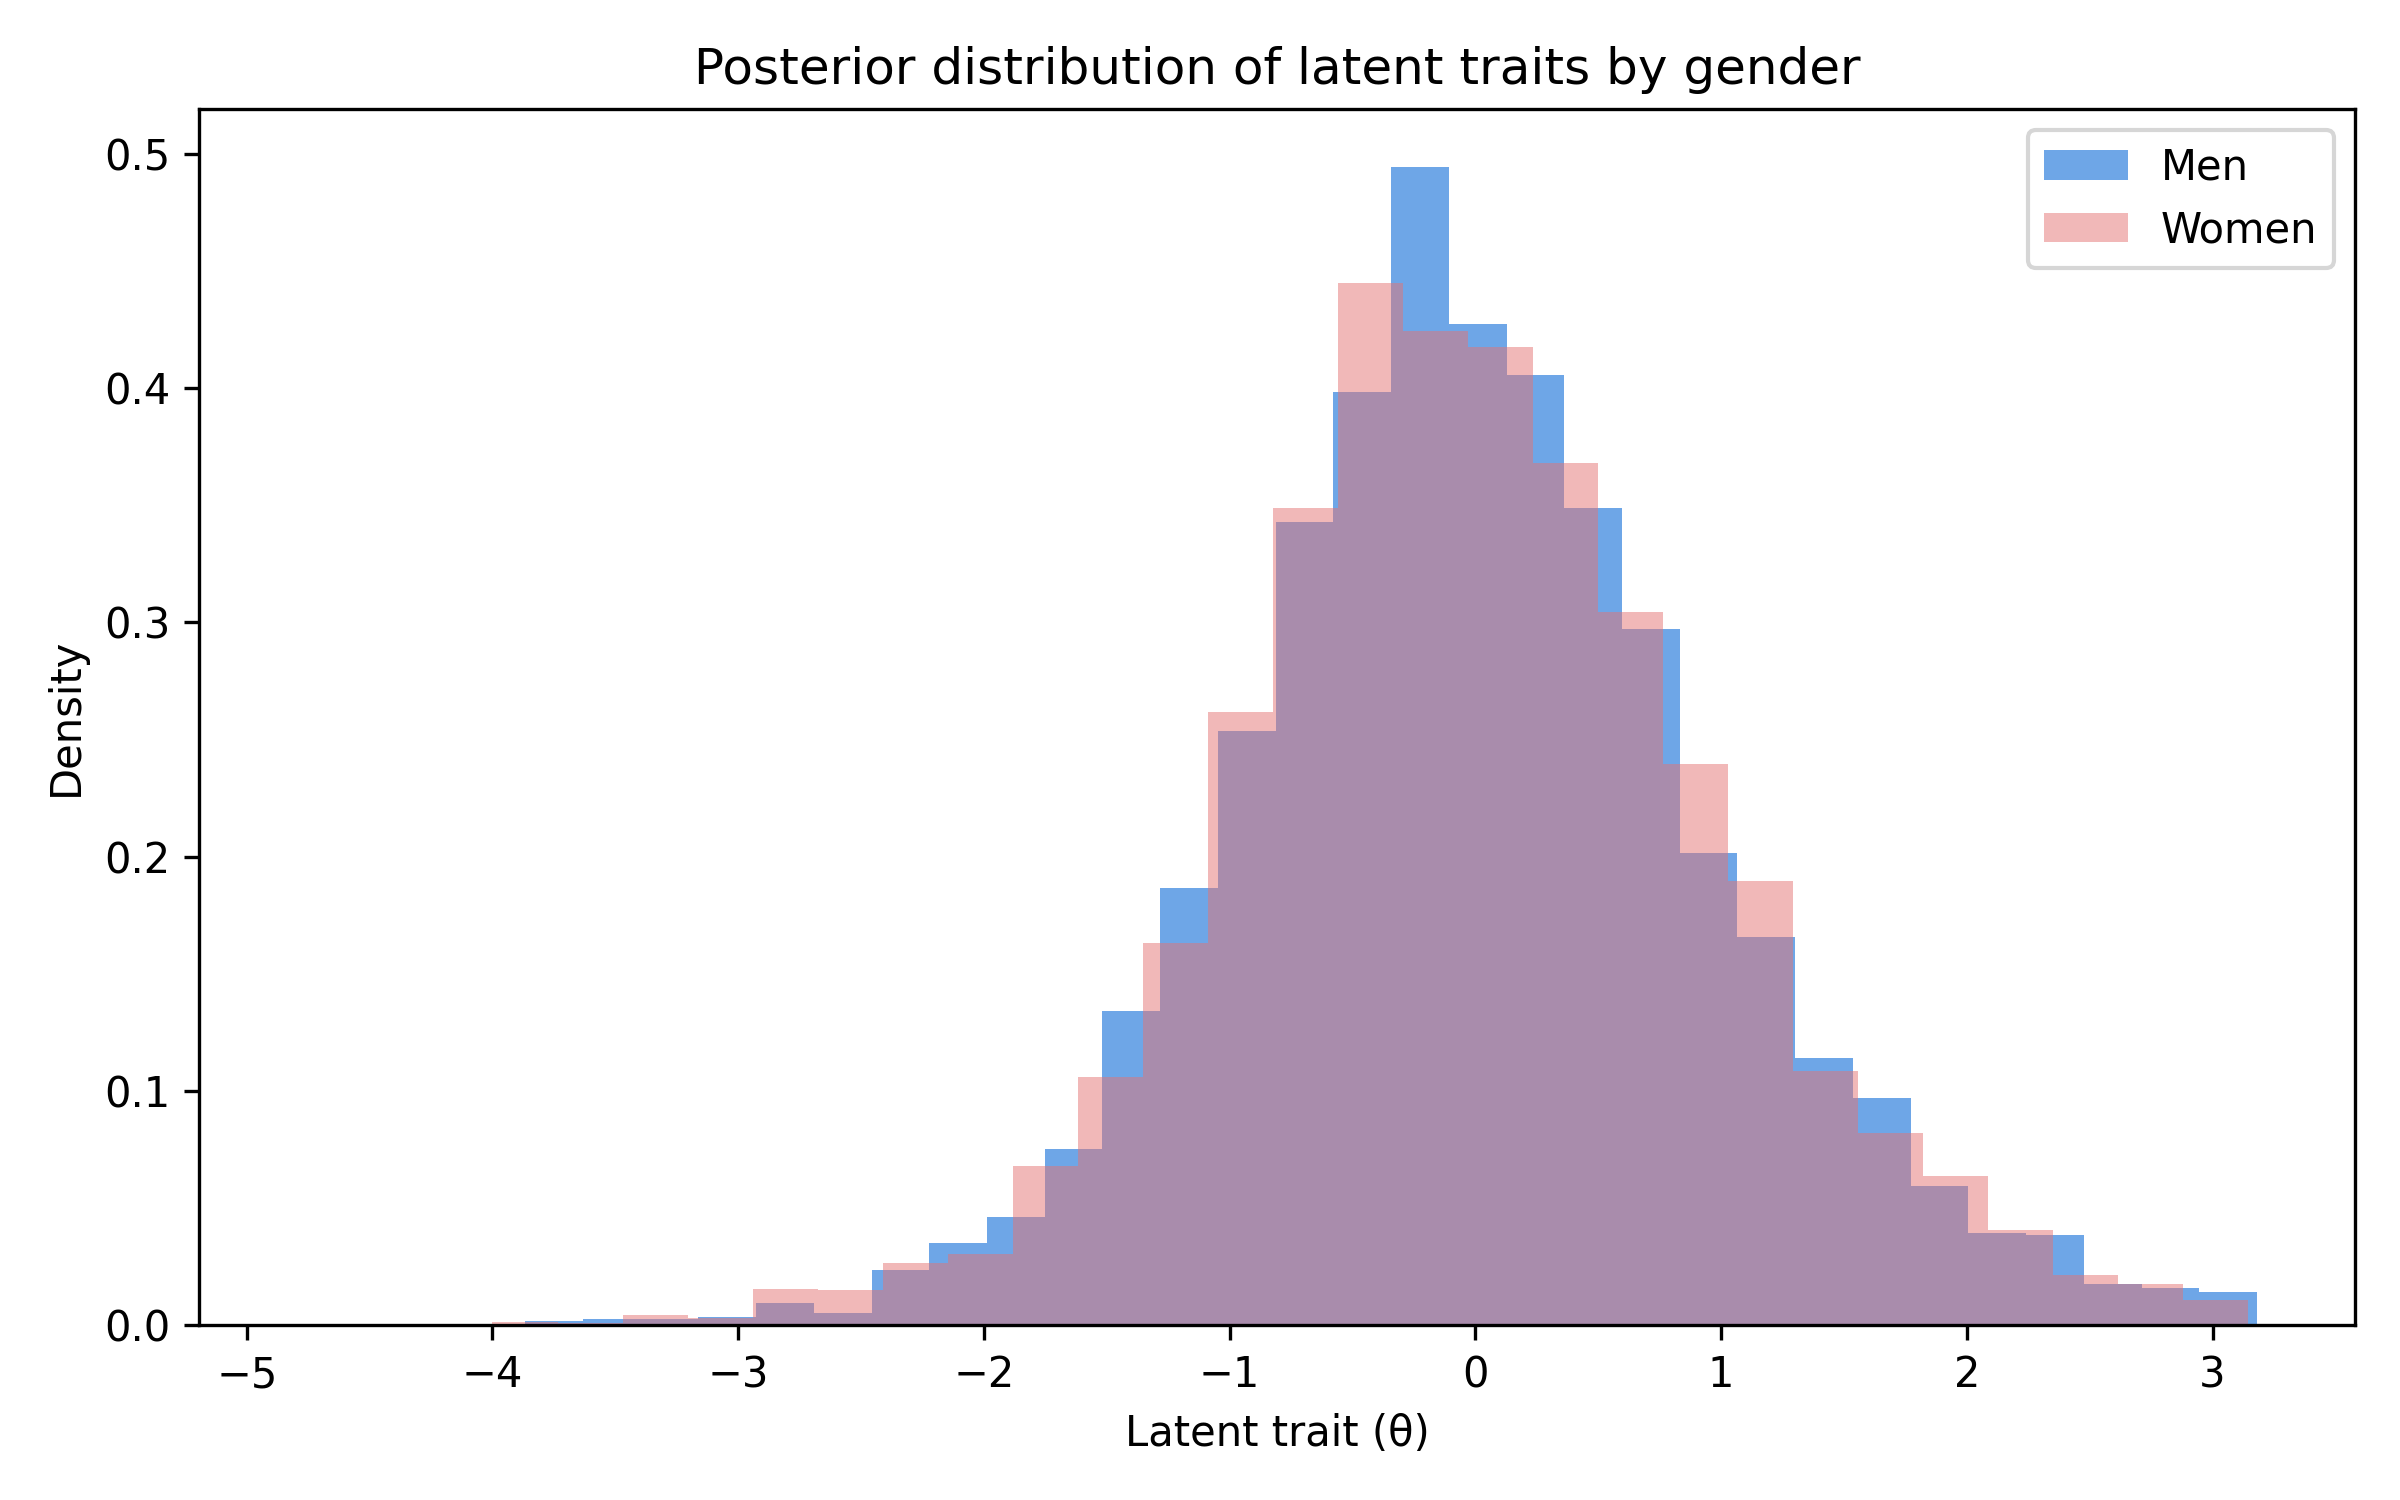
Adjusting for bias, there’s little difference between average male and female nerdiness (at least, in this highly-selected sample).
Reduced Item Set
To make a shorter scale, I applied Bayesian Design Optimization to reduce the number of items while maximizing information. Reducing the number of items to 12 (while excluding items displaying DIF), yields the following items (ordered by expected information contribution):
- Q6: I prefer academic success to social success.
- Q1: I am interested in science.
- Q12: I spend more time at the library than any other public place.
- Q17: I am more comfortable interacting online than in person.
- Q9: I like science fiction.
- Q14: I like to read technology news reports.
- Q25: I care about super heroes.
- Q4: My appearance is not as important as my intelligence.
- Q23: I get excited about my ideas and research.
- Q10: I would rather read a book than go to a party.
- Q16: I gravitate towards introspection.
- Q2: I was in advanced classes.
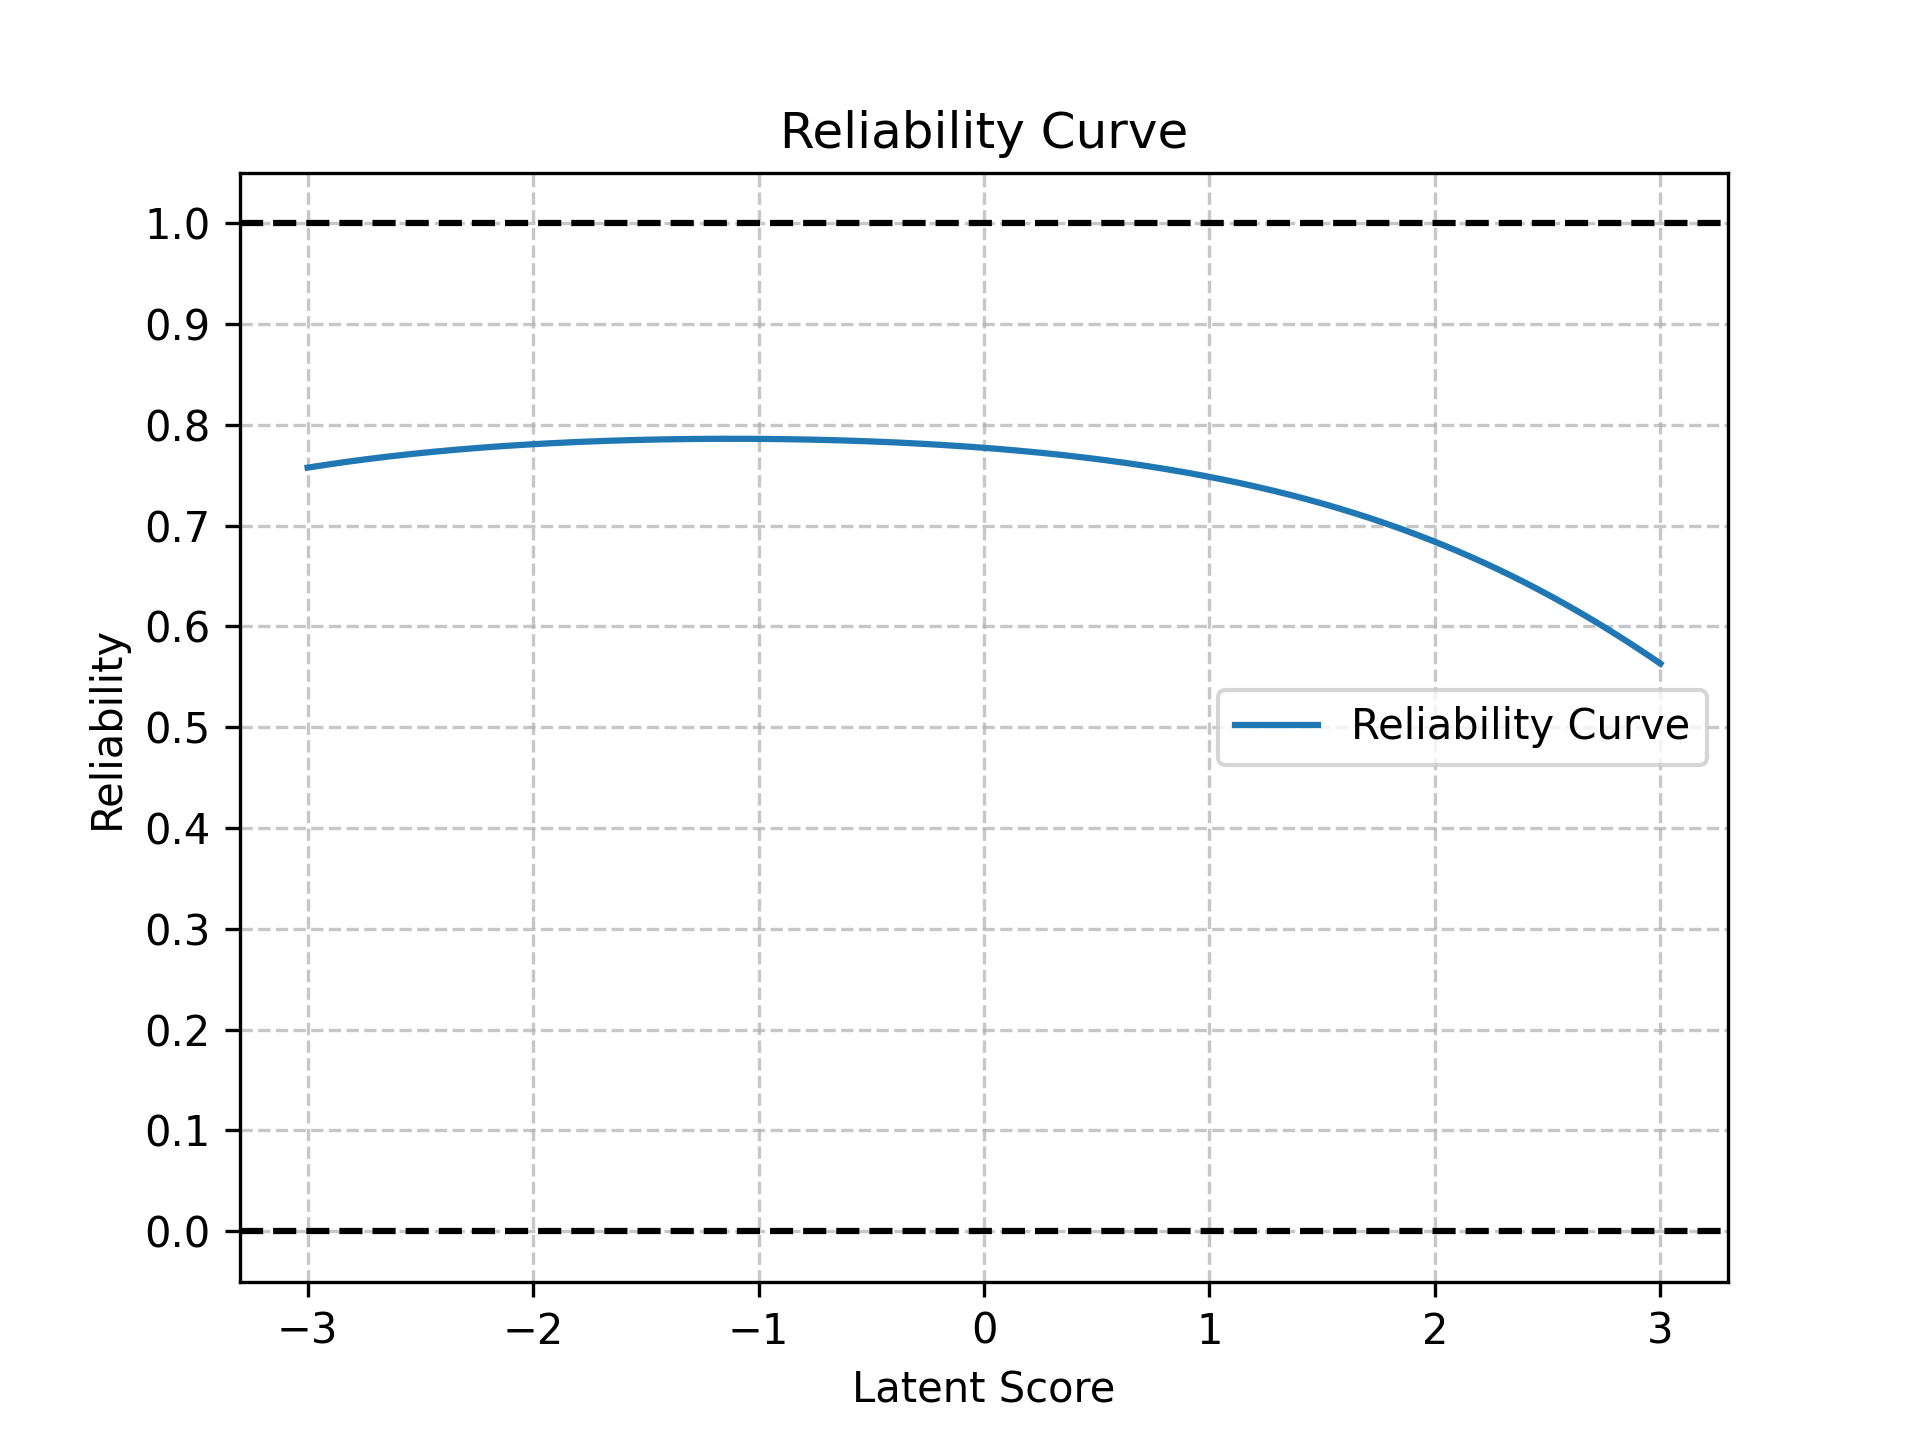
The plot below shows the reliability across the scale. The 12-item set reduces reliability slightly (coefficient omega has dropped to 0.79), although the effect is more pronounced at the higher end of the scale.
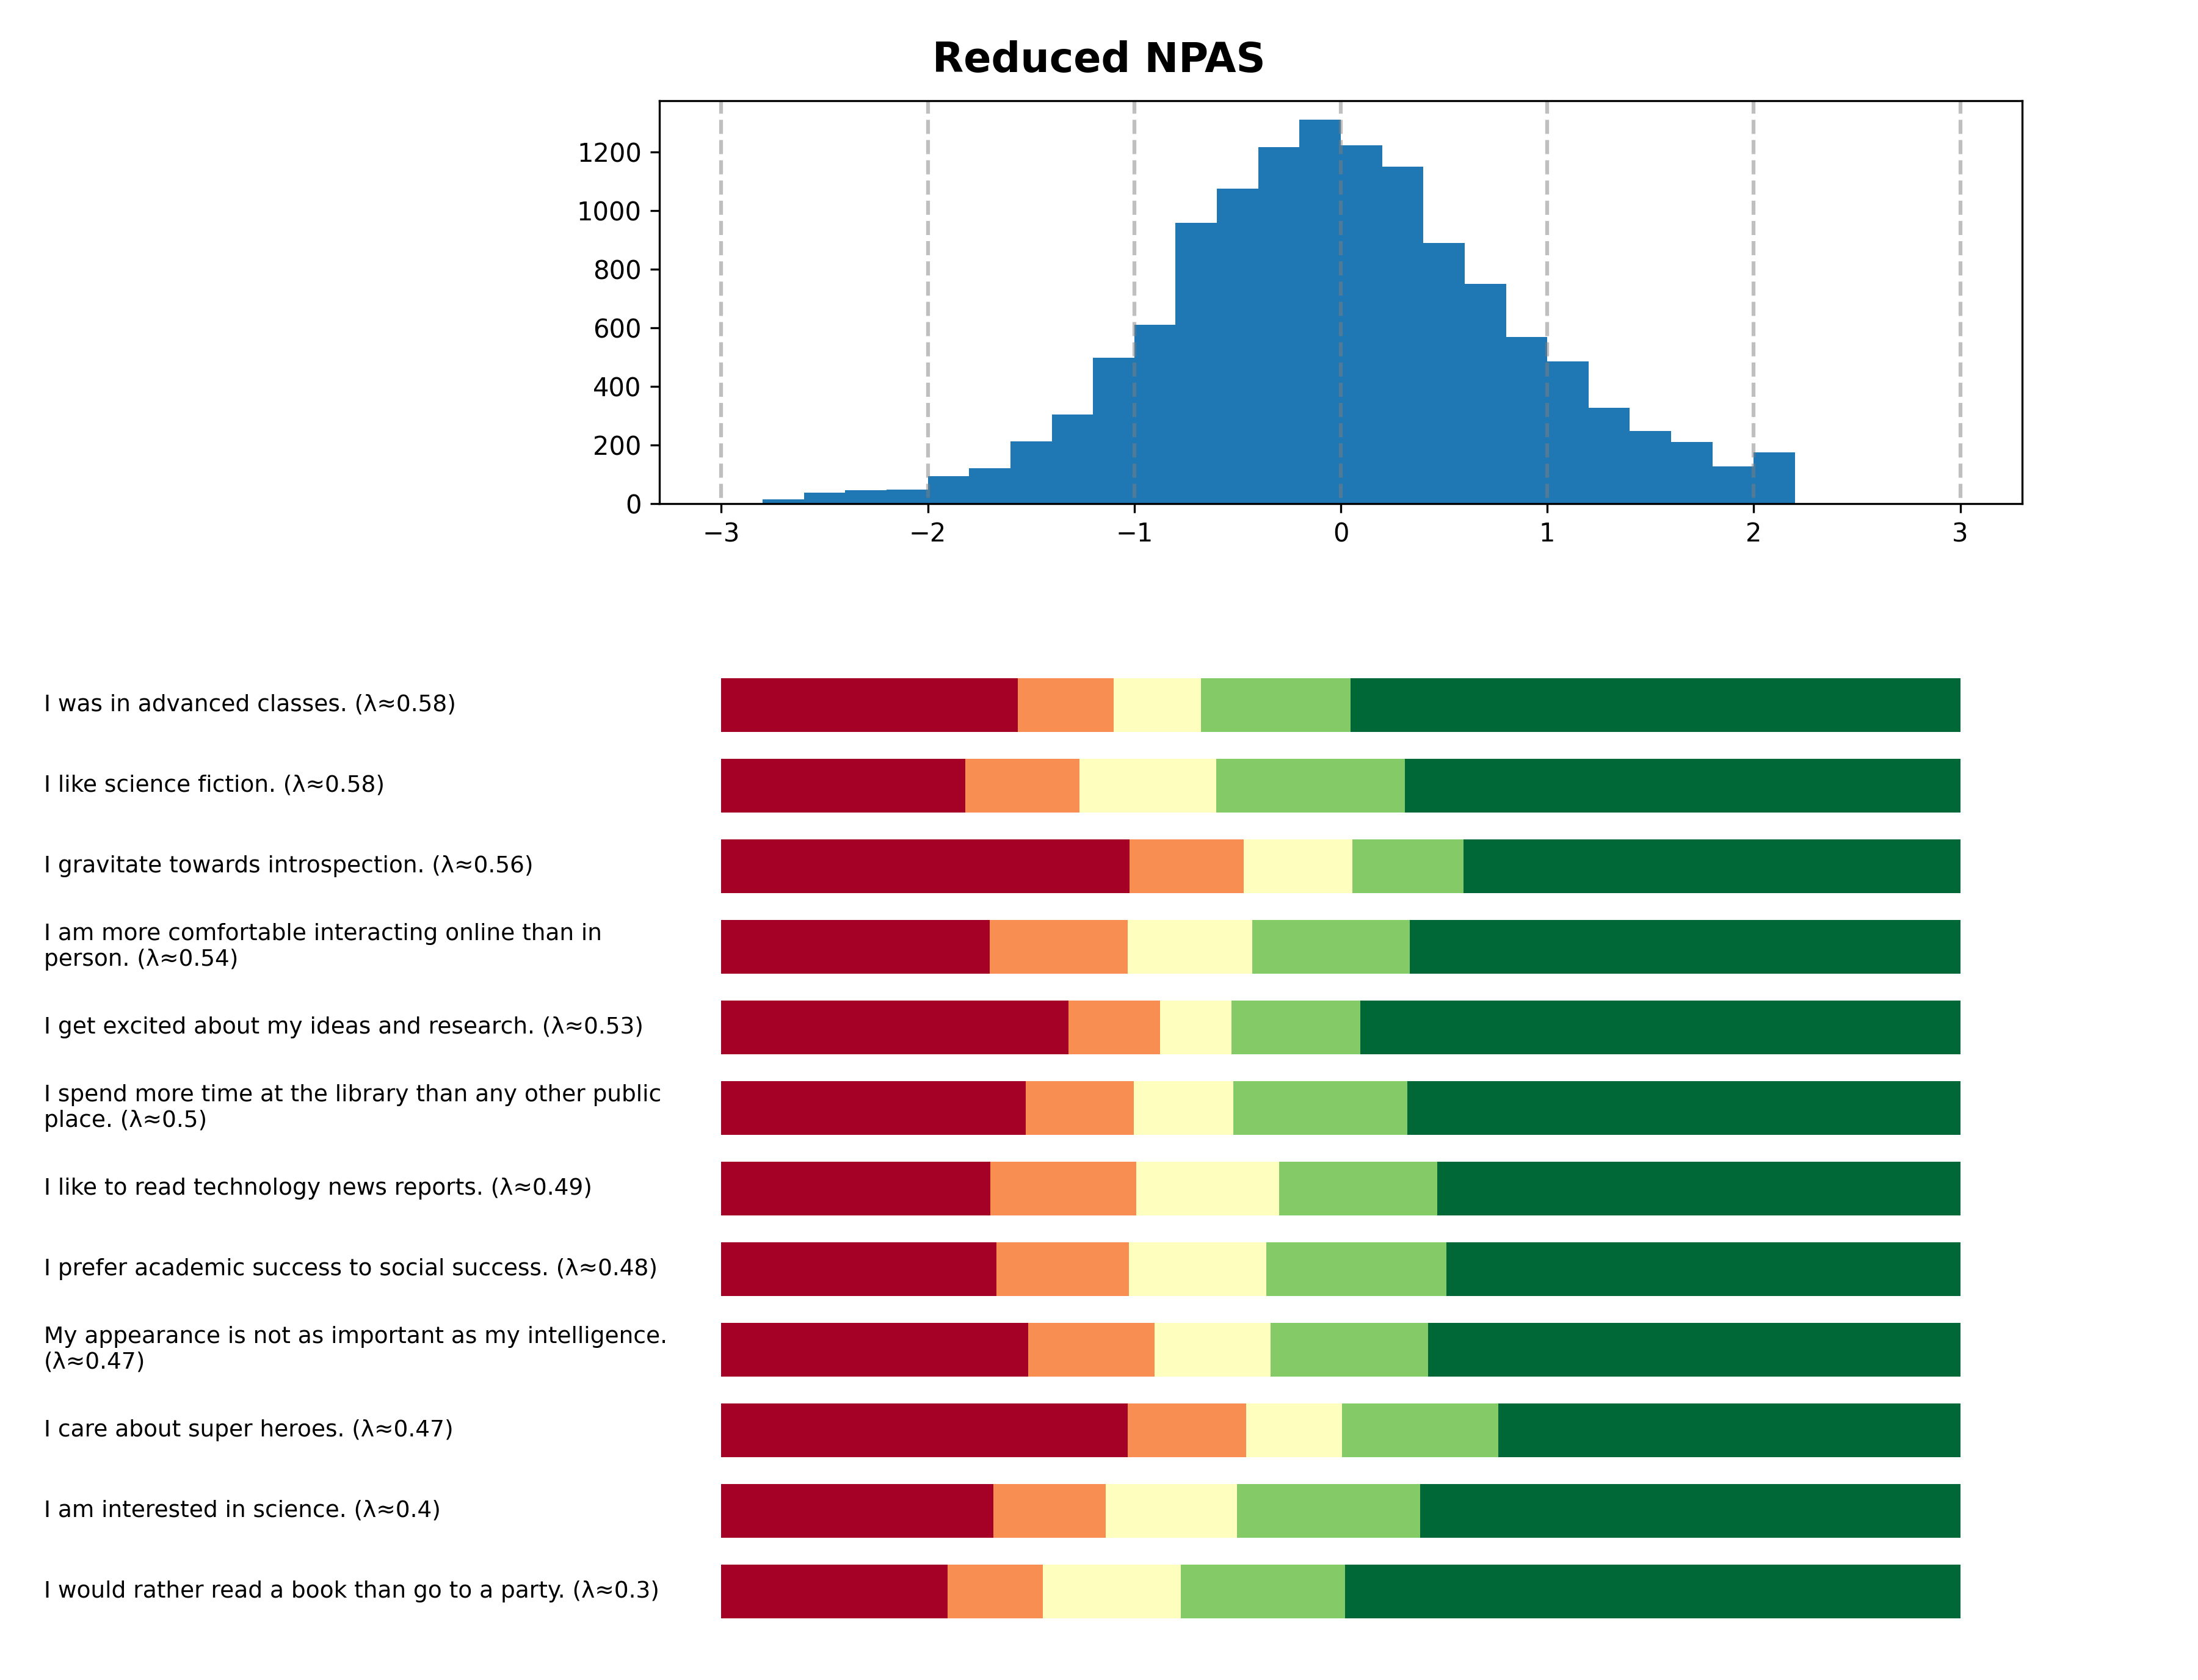
The following plot is a Tailcalled diagram for the reduced set. We create a standardized (mean = 0, SD = 1) latent variable summarizing the displayed items in the bottom of the plot. The rows below the histogram show the median response to each question for a given level of the latent variable.
What is a nerd?
In essence, the prototypical nerd is a socially awkward introvert who values intelligence, learning, and education over popularity. This definition captures the central cluster of traits revealed by the NPAS: intellectual interests combined with a lack of interest (or success) in social affairs.
Others have also attempted to define what a nerd is:
- In his 2003 essay, Why Nerds Are Unpopular, Paul Graham argues that nerds are people who value intelligence over popularity. This matches the definition that I came up with.
- In On “Geek” Versus “Nerd”, the author investigates the distinction between geeks and nerds by performing textual analysis of Twitter. They conclude that “geeky words are more about stuff (e.g., “#stuff”), while nerdy words are more about ideas (e.g., “hypothesis”). Geeks are fans, and fans collect stuff; nerds are practitioners, and practitioners play with ideas.” This contrast is interesting given that the highest-loading item, Q5, is “I collect books.” Yet most NPAS items are idea-oriented, emphasizing curiosity and intellect rather than collecting or fandom. A nerd collects books not to own them, but to read and absorb the ideas inside. Other items are about interests in science, research, and learning.
- In What’s in a Nerd?, Sebastian Jensen argues that the traits that make up the concept of ‘nerd’ are those that “allow people to acquire status in bureaucracies and educational institutions”. He then makes use of a rather interesting procedure3 to argue that the traits correlated with being a nerd are those that are correlated with being more successful in the education system over the organic social environment. This is consistent with what I’ve found. In fact, one of the highest-loading NPAS items is “I prefer academic success to social success.”
Appendix
Erroneous Definitions of Nerd
In All the nerds are dead, Sam Kriss claims that a nerd is “someone who likes things that aren’t good”. This claim is straightforwardly false. Nerds tend to like books, science fiction, learning, RPGs, and similar pursuits. None of these things are inherently ‘not good’.
Later in the article, Kriss writes: “The nerd doesn’t like bad things because of their actual qualities; the nerd likes bad things simply because they’re there. What counts is collecting, itemising, consuming.” But this description seems closer to the geek than the nerd. The NPAS is dominated by items related to curiosity, learning, intelligence, and intellectual engagement rather than collecting or consumption. Even where collecting appears (e.g., books), the broader pattern suggests interest in ideas rather than accumulation itself.
In response to Kriss’s post, Scott Alexander offered his own definition: “My theory is: hipsterism and nerdism are both forms of trying to invest your identity in a cultural product. If there’s no competition, you become a hipster; if there’s high competition, you become a nerd.”
The problem with this definition is that nerds do not necessarily invest their identity in cultural products. Rather, they invest it in intellectual pursuits. This includes academics, reading, science, and learning generally. Cultural products such as RPGs and superheroes are part of the picture, but they appear to be relatively peripheral, as indicated by their comparatively low factor loadings.
Examination of Age Differences
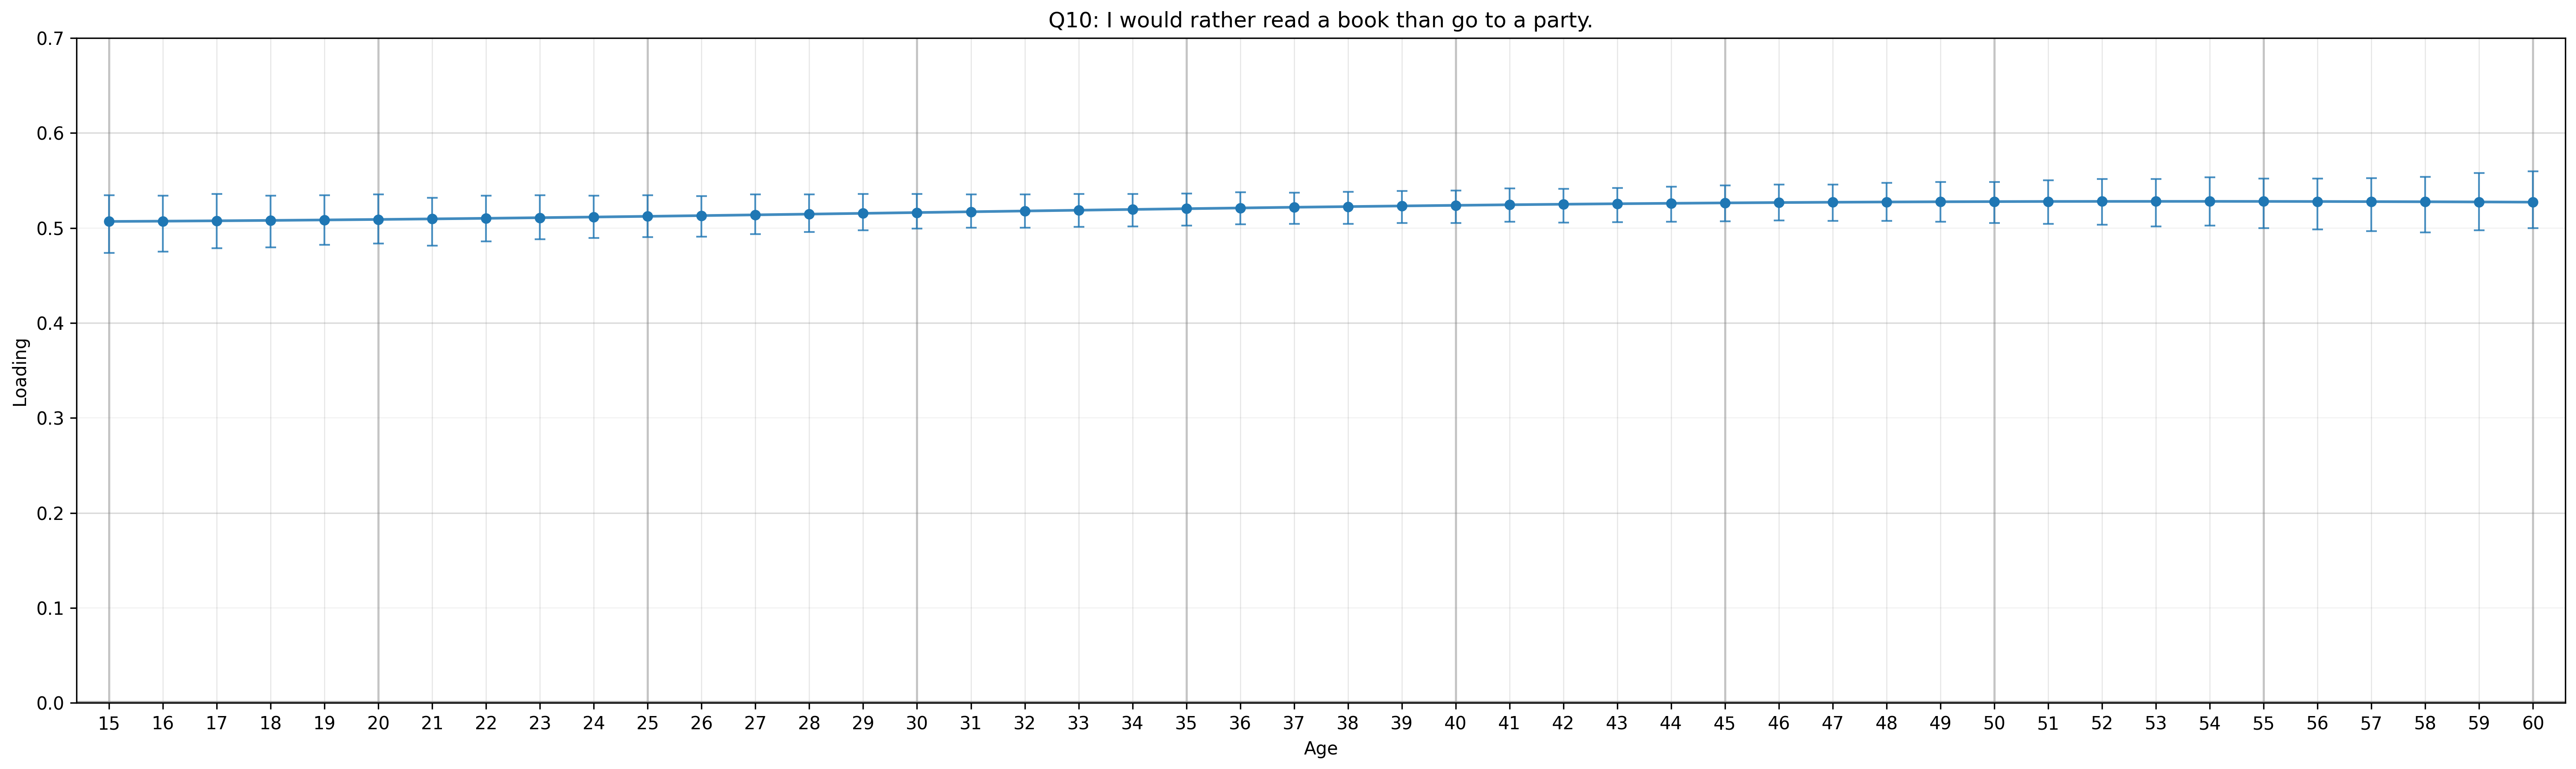
Loadings by Age
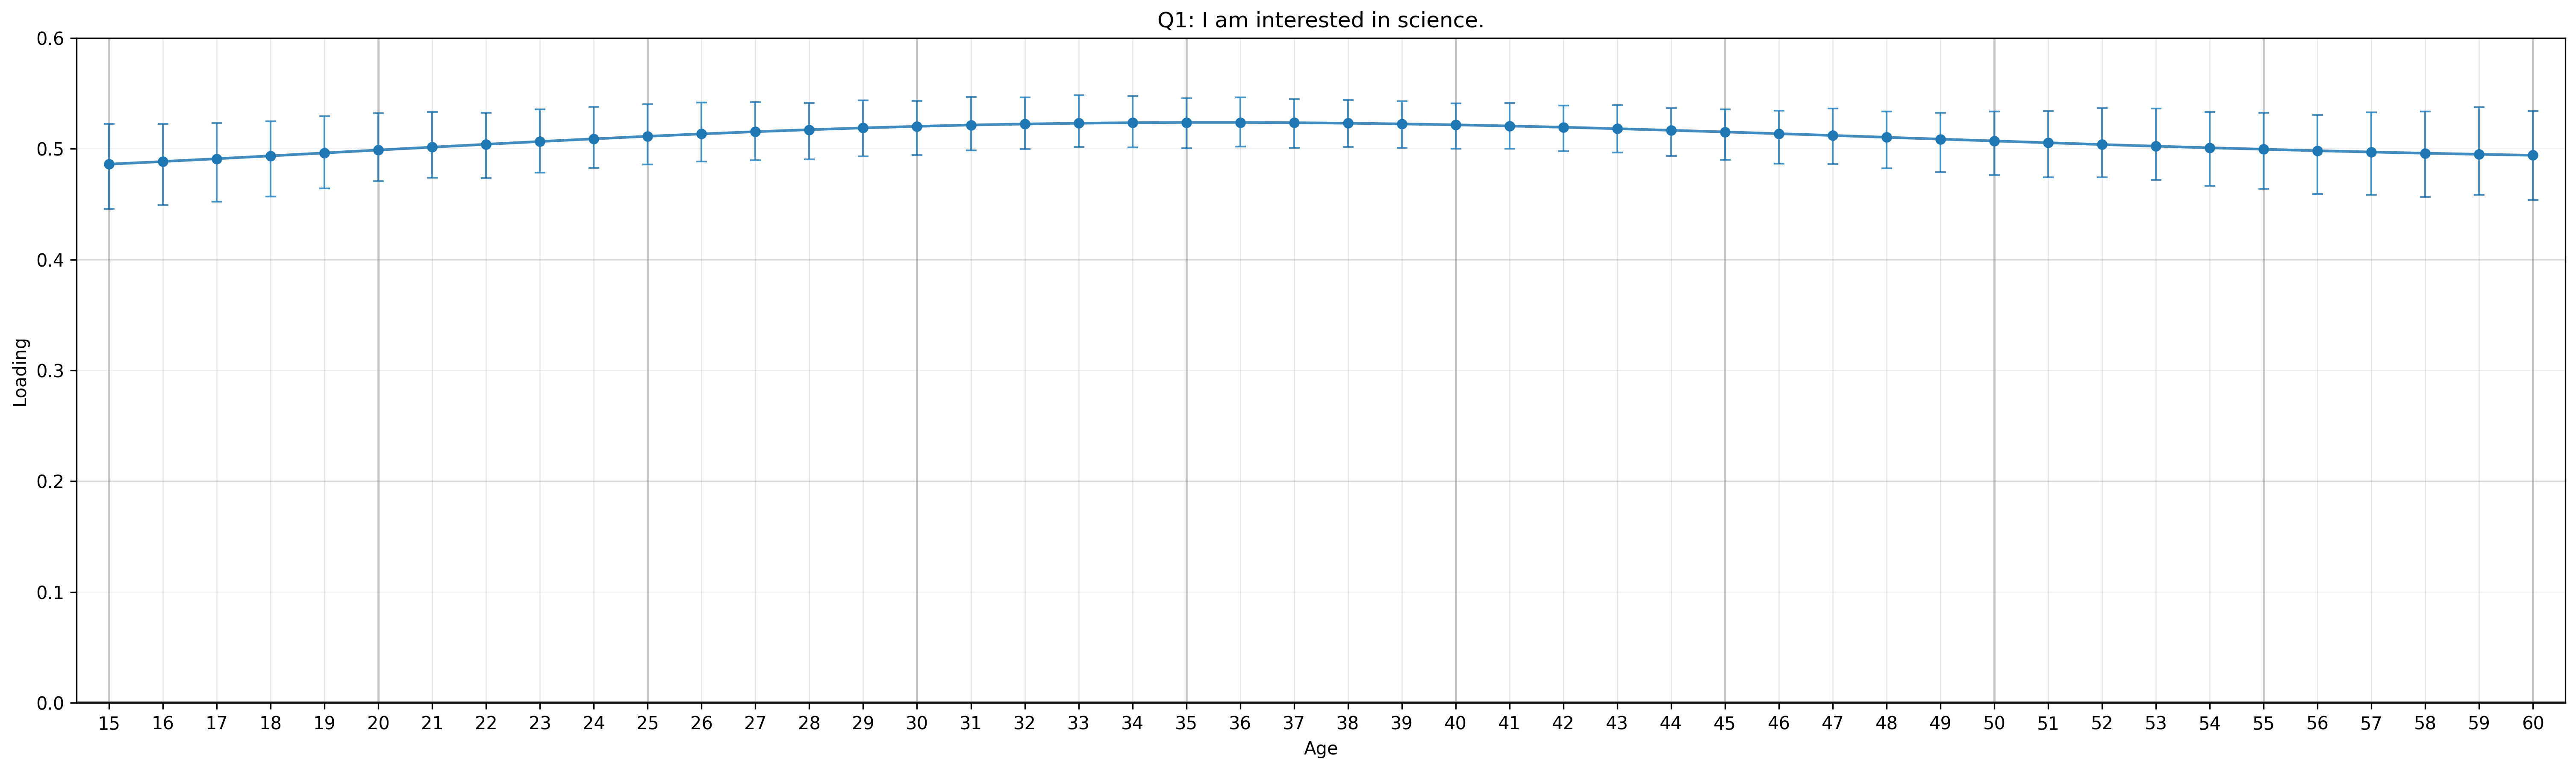
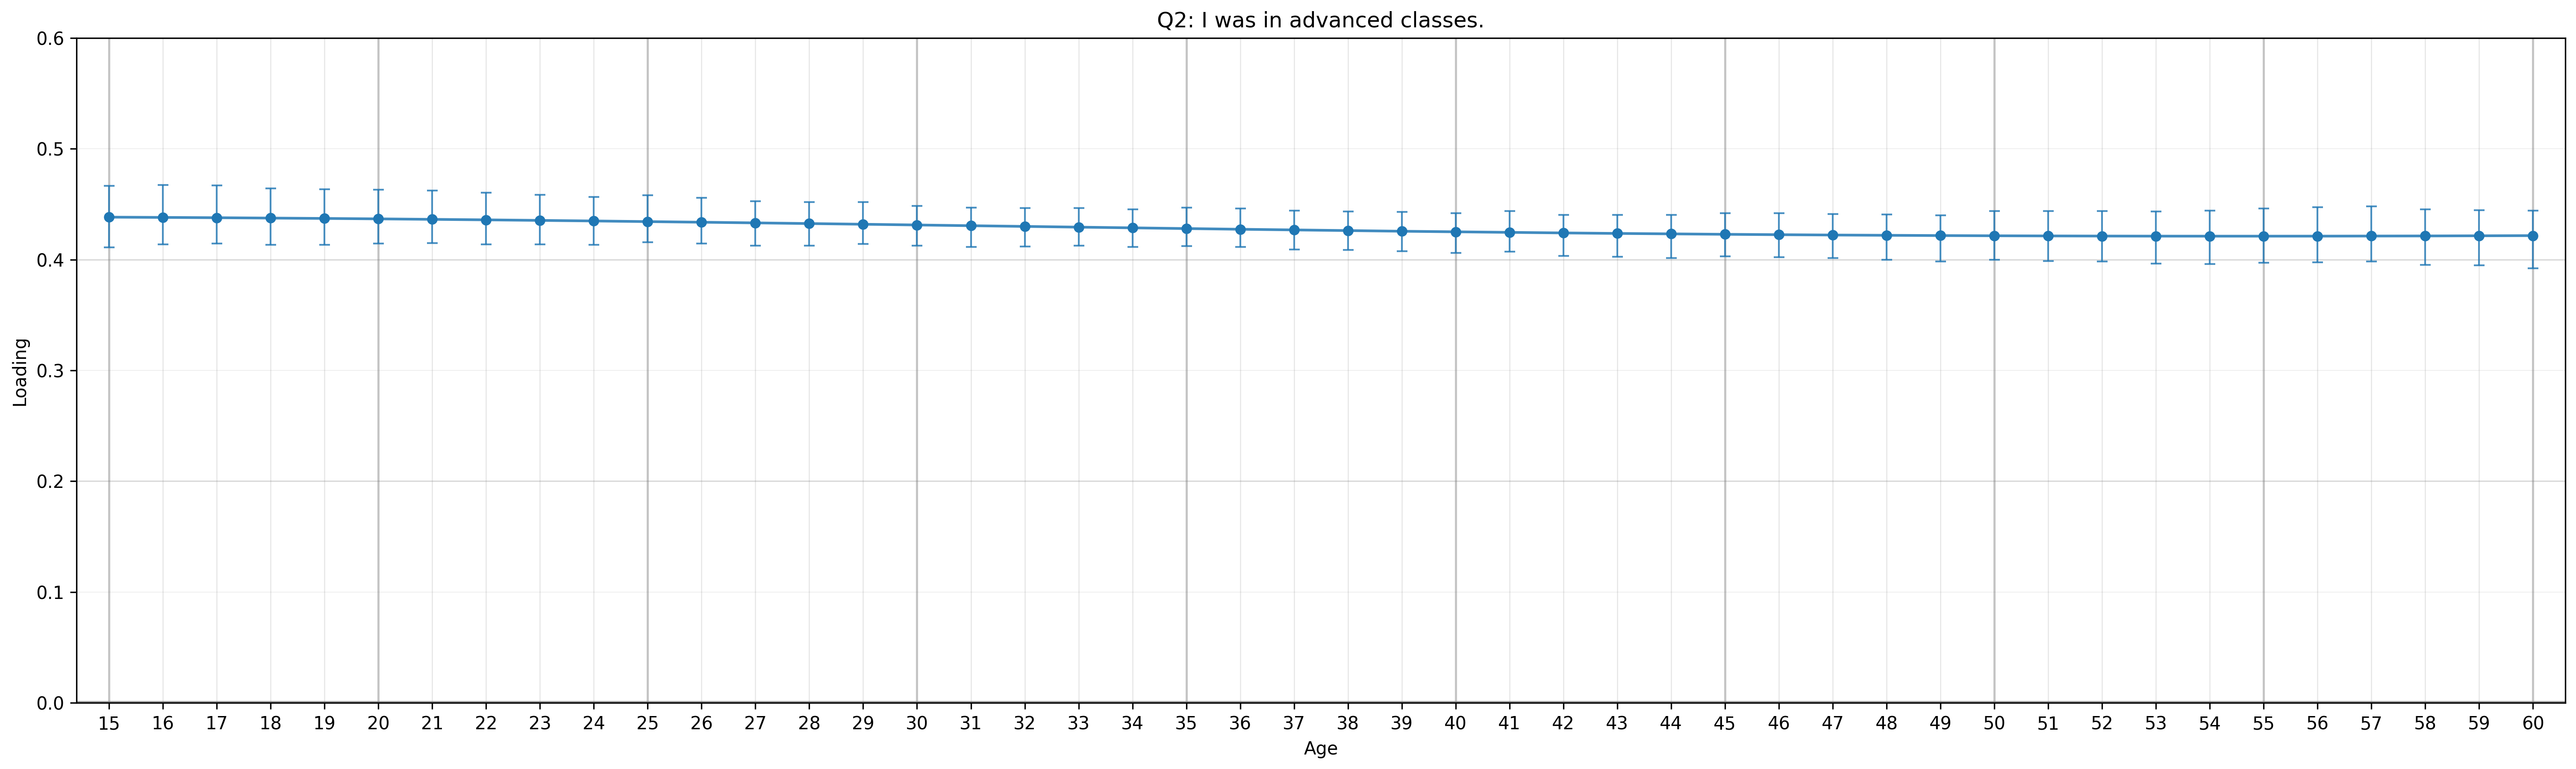
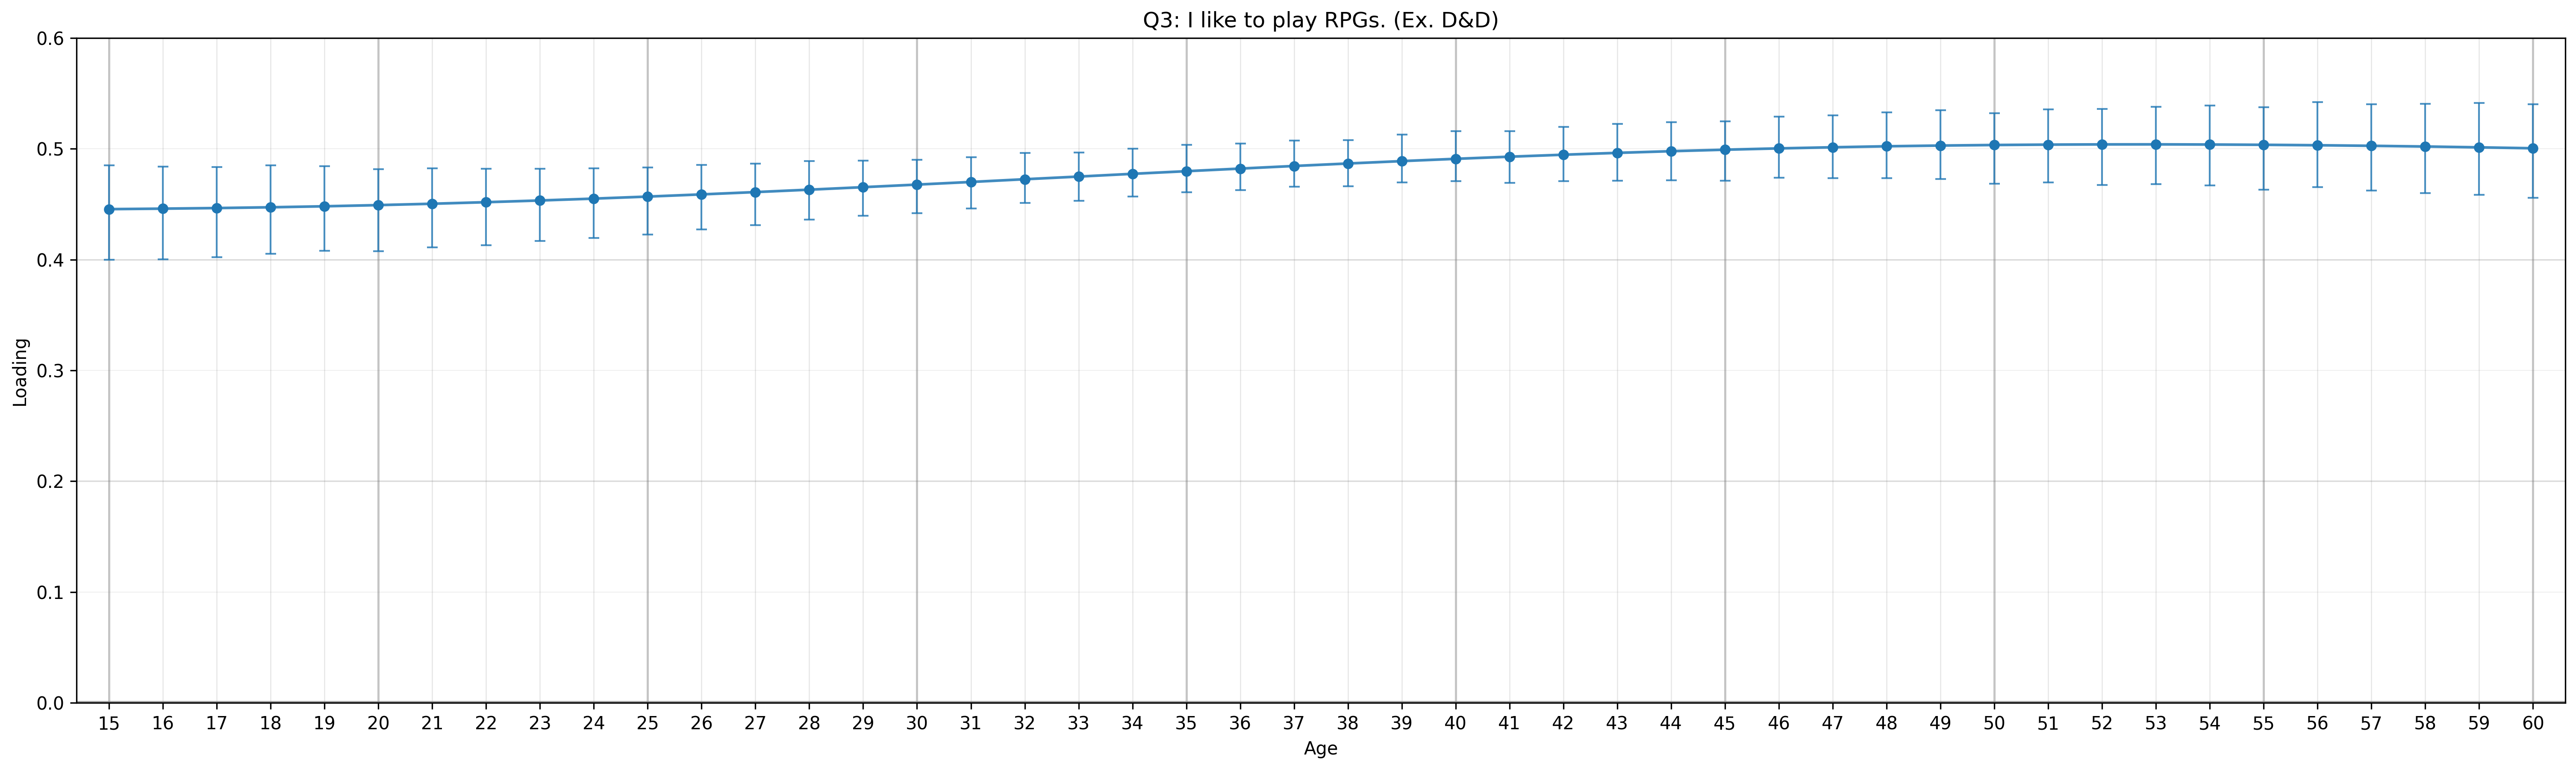
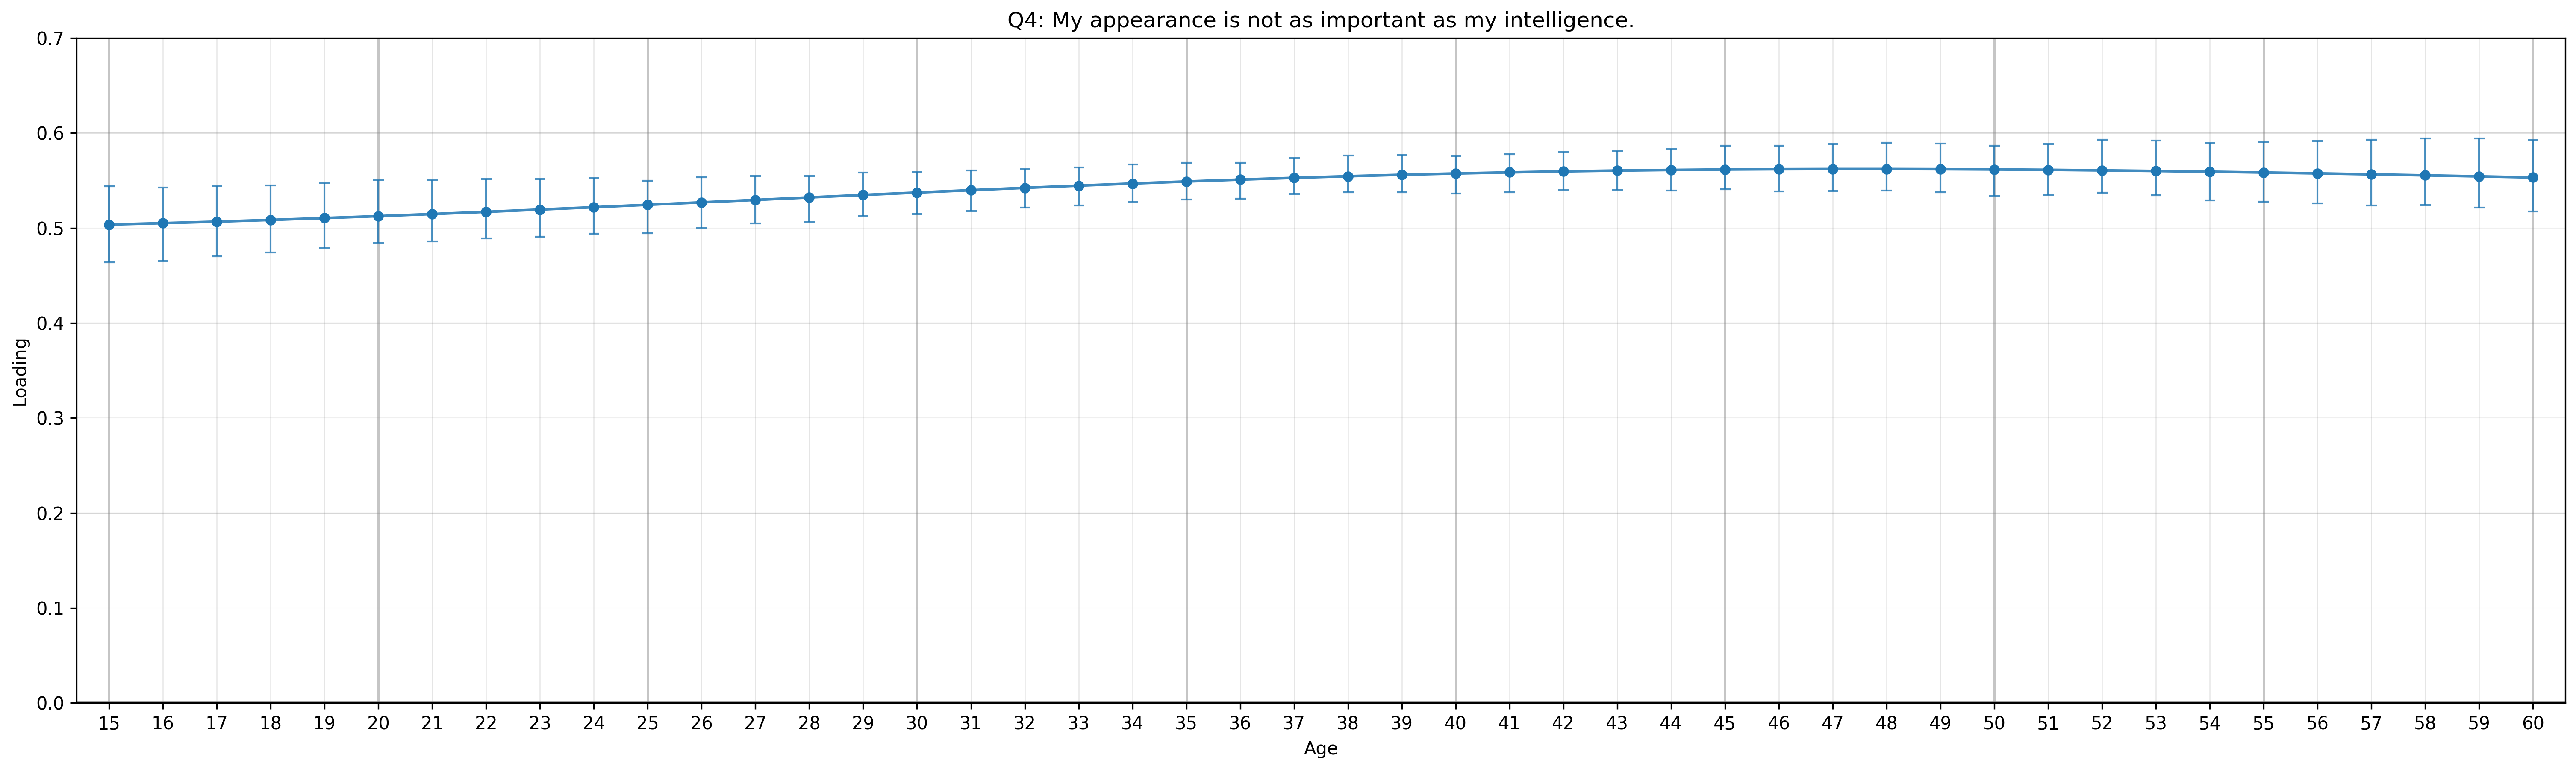
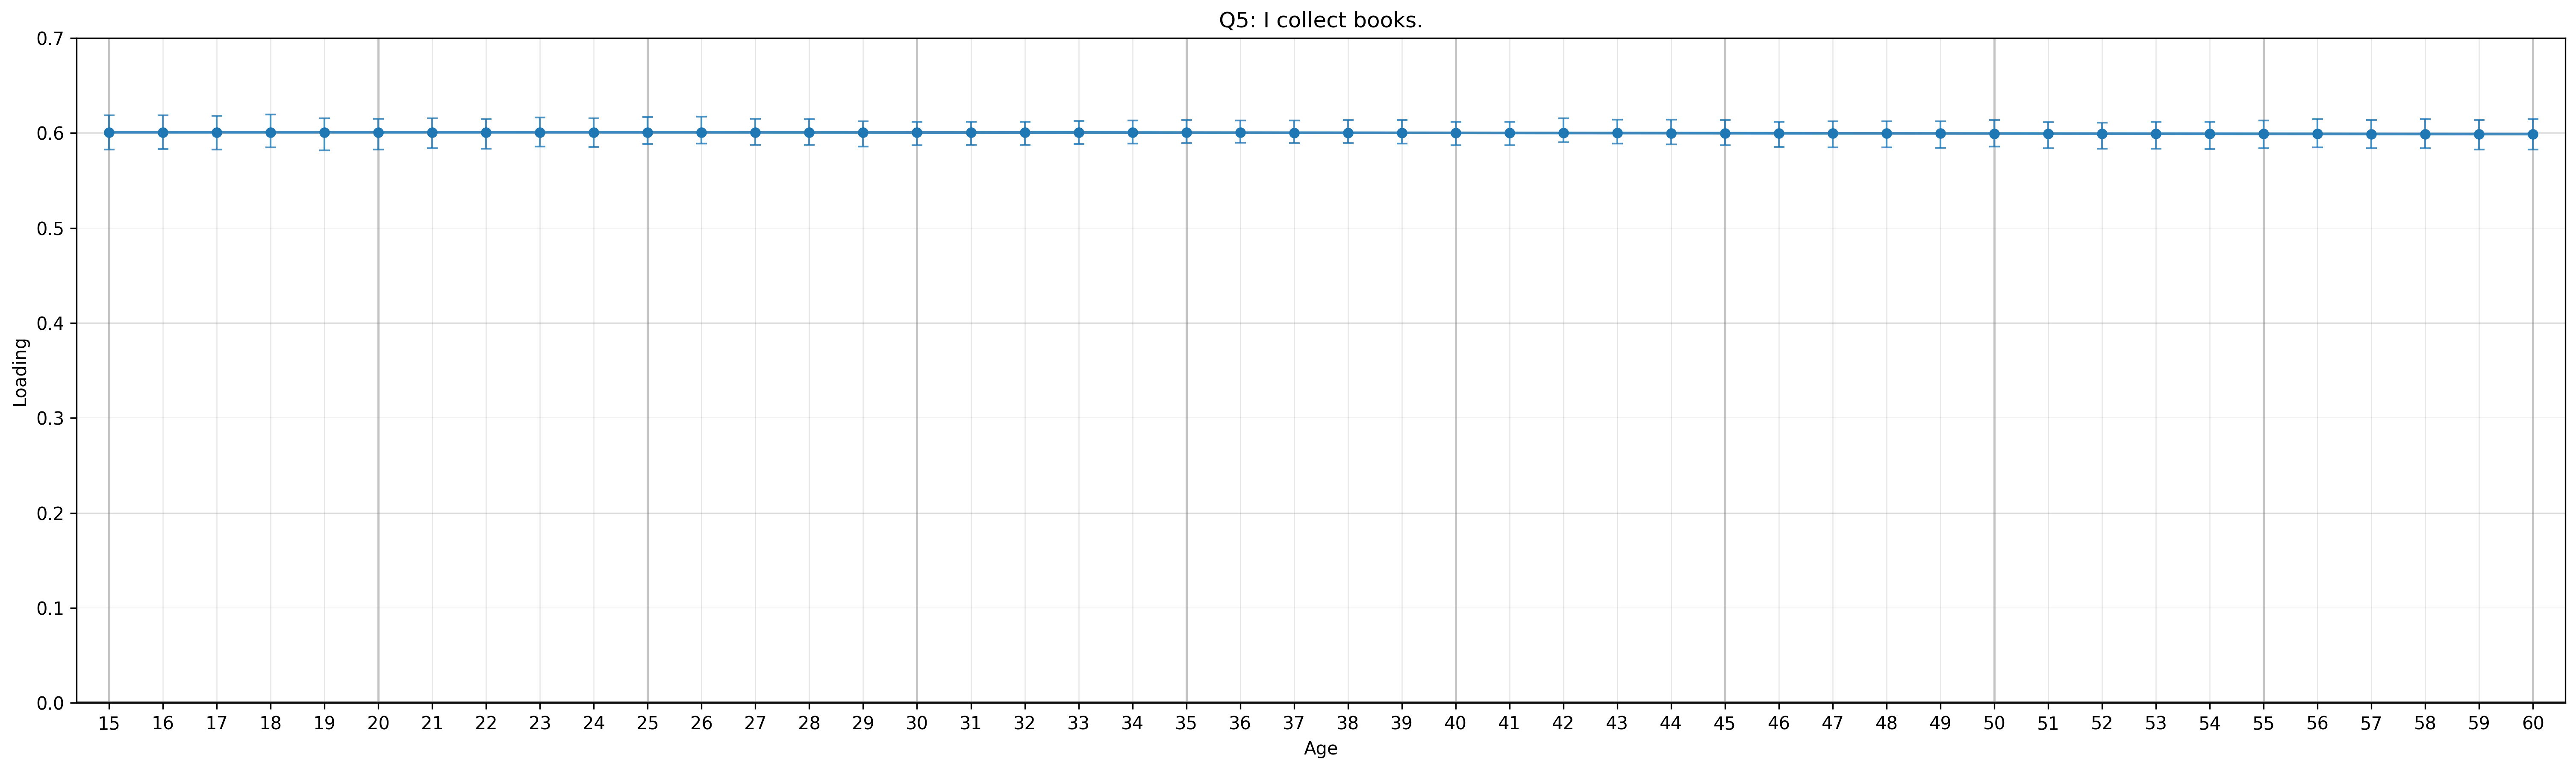
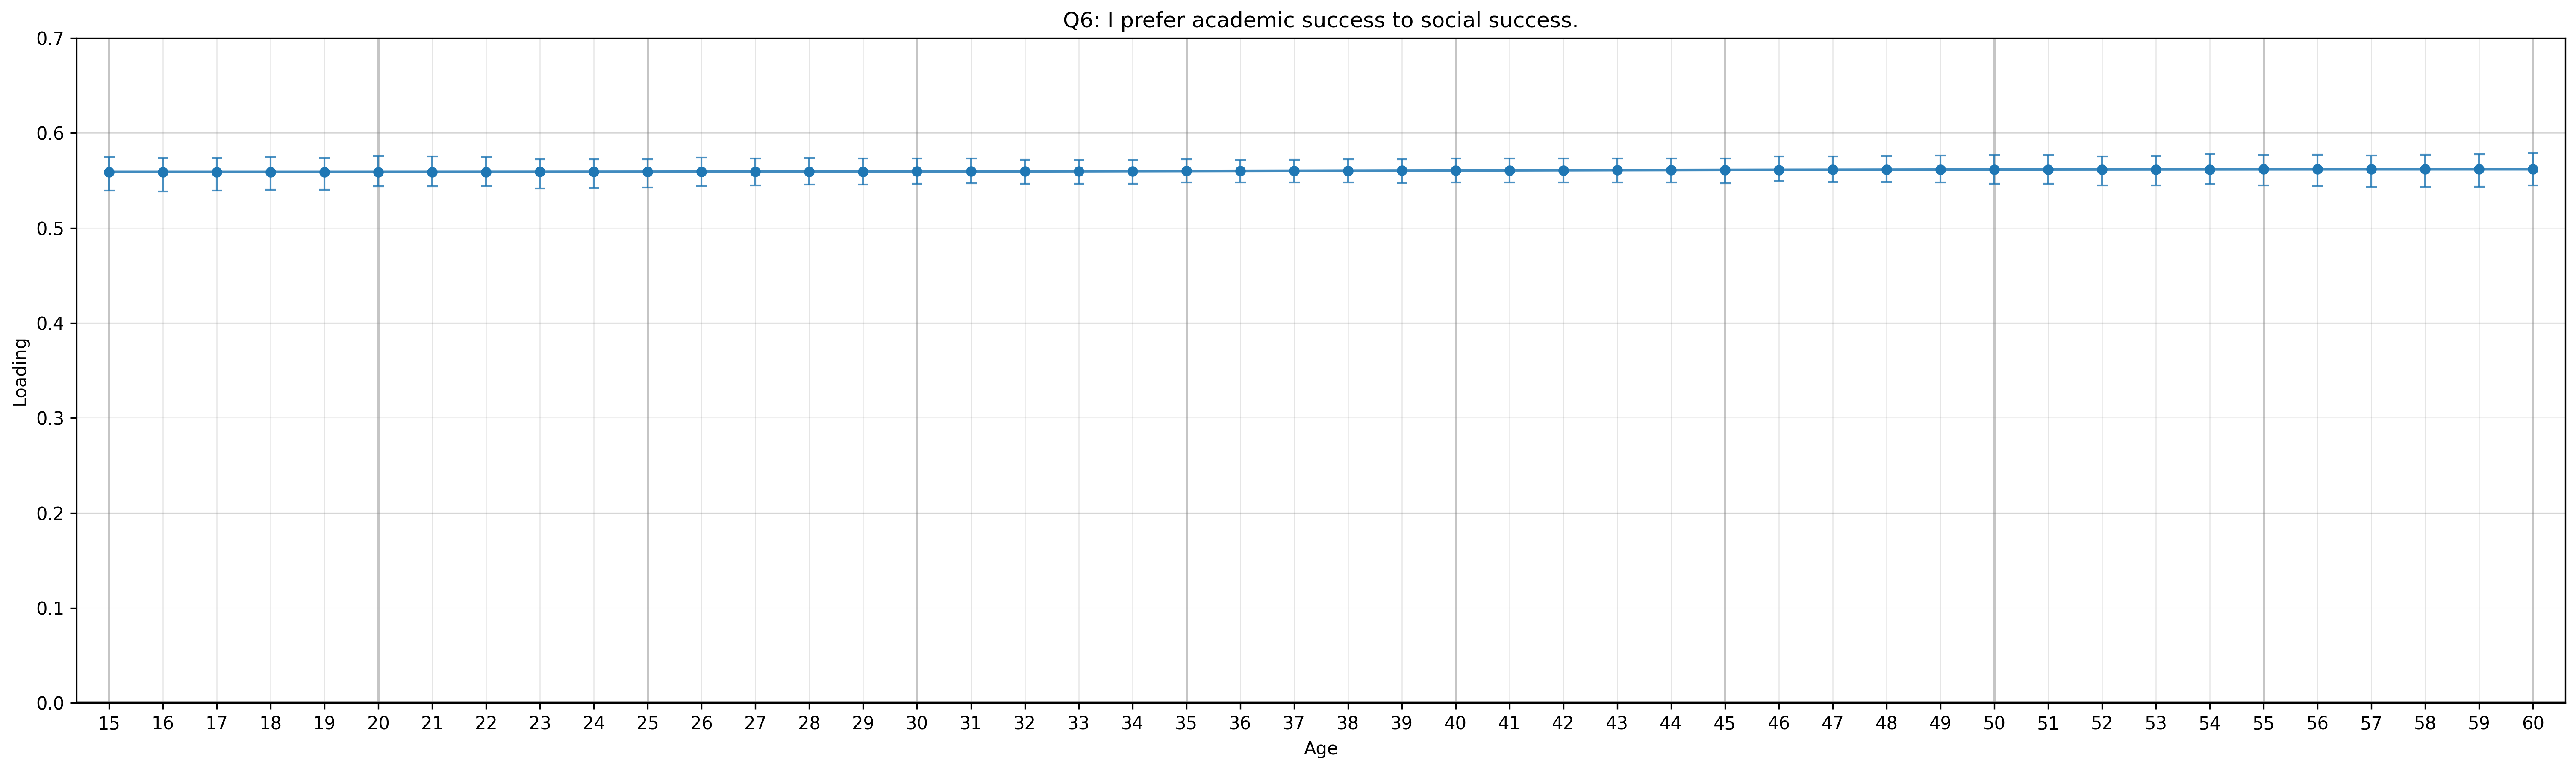
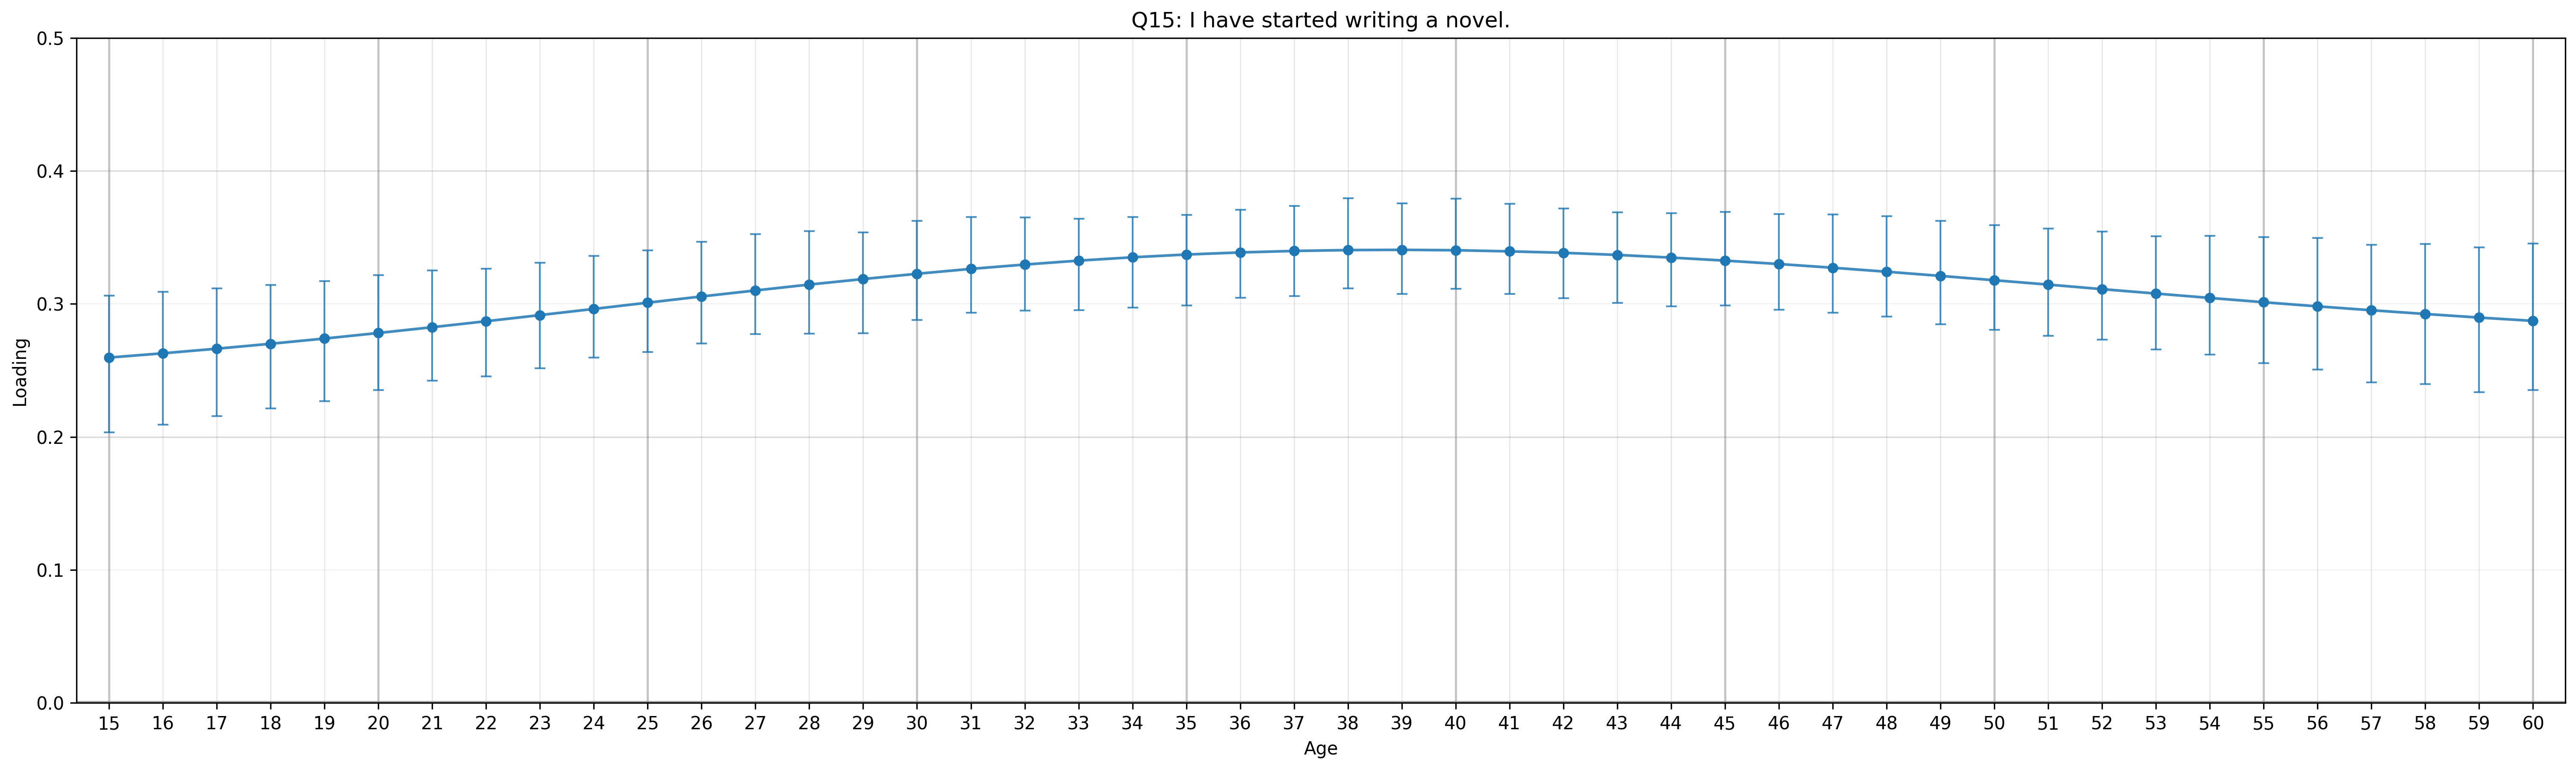
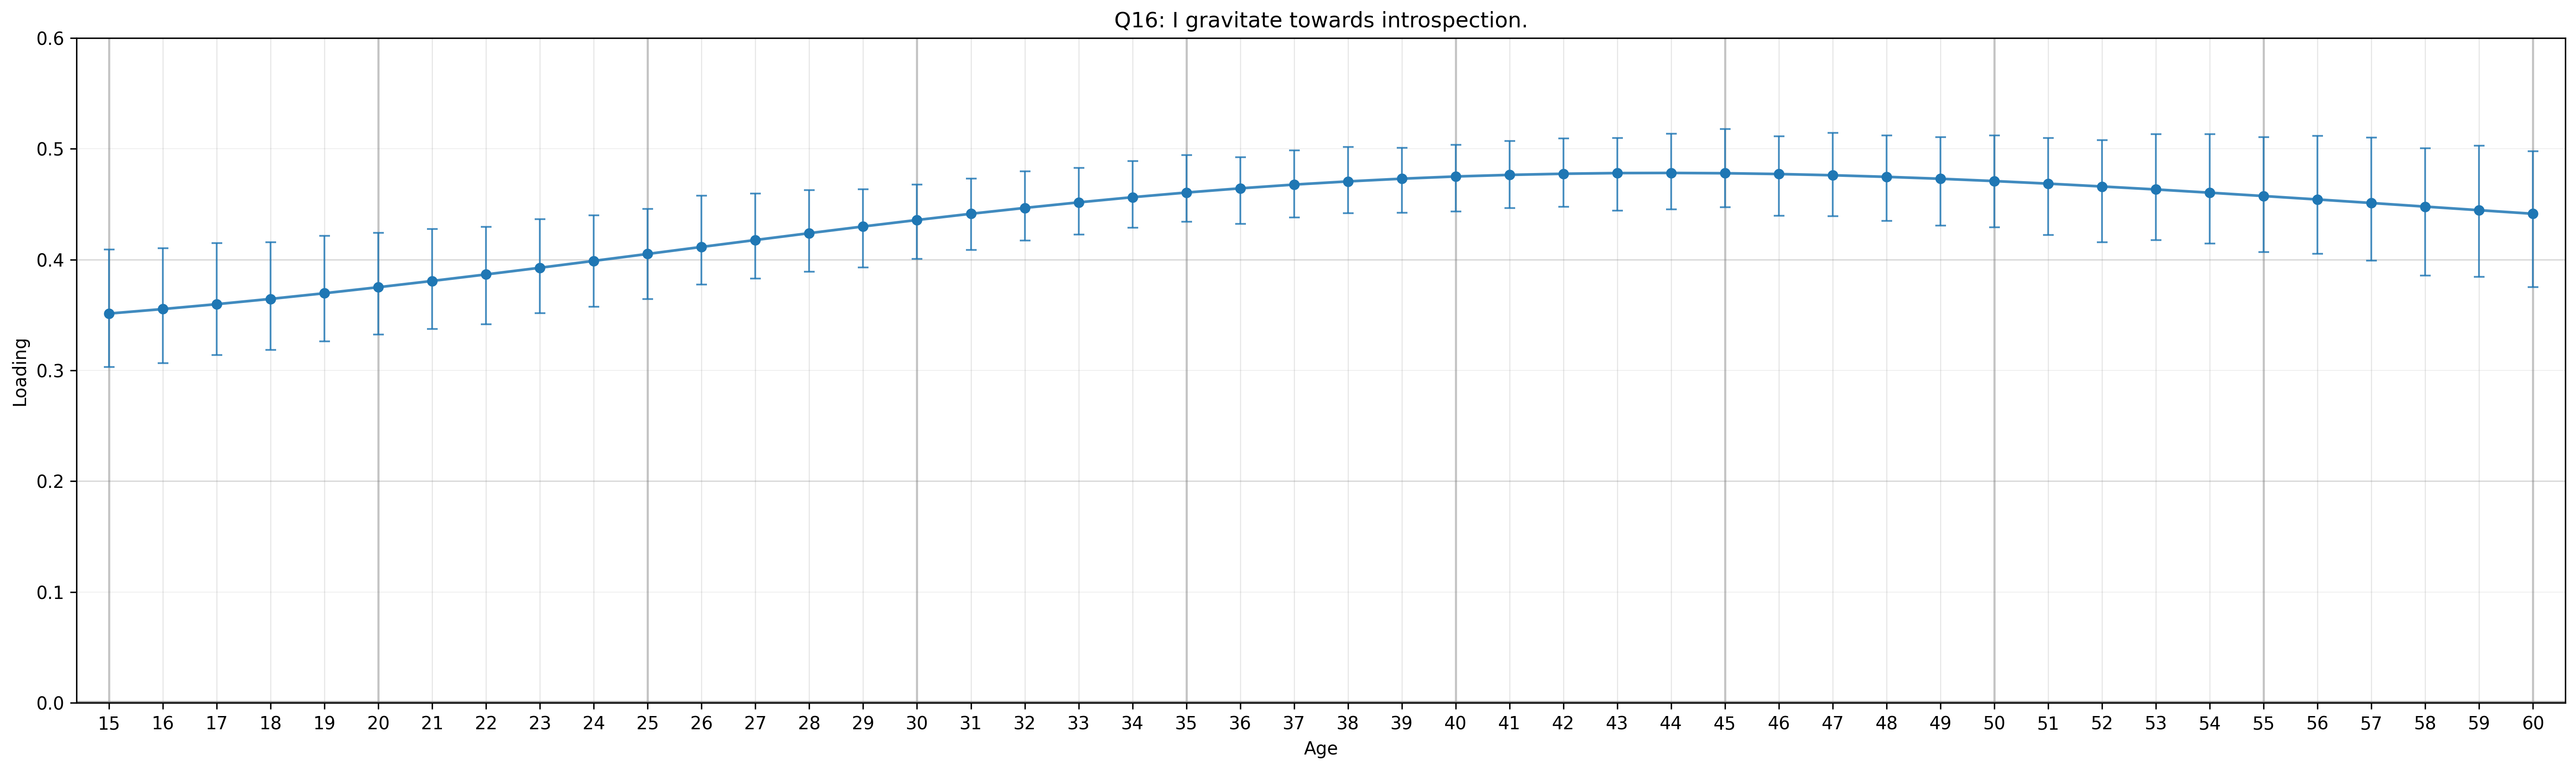
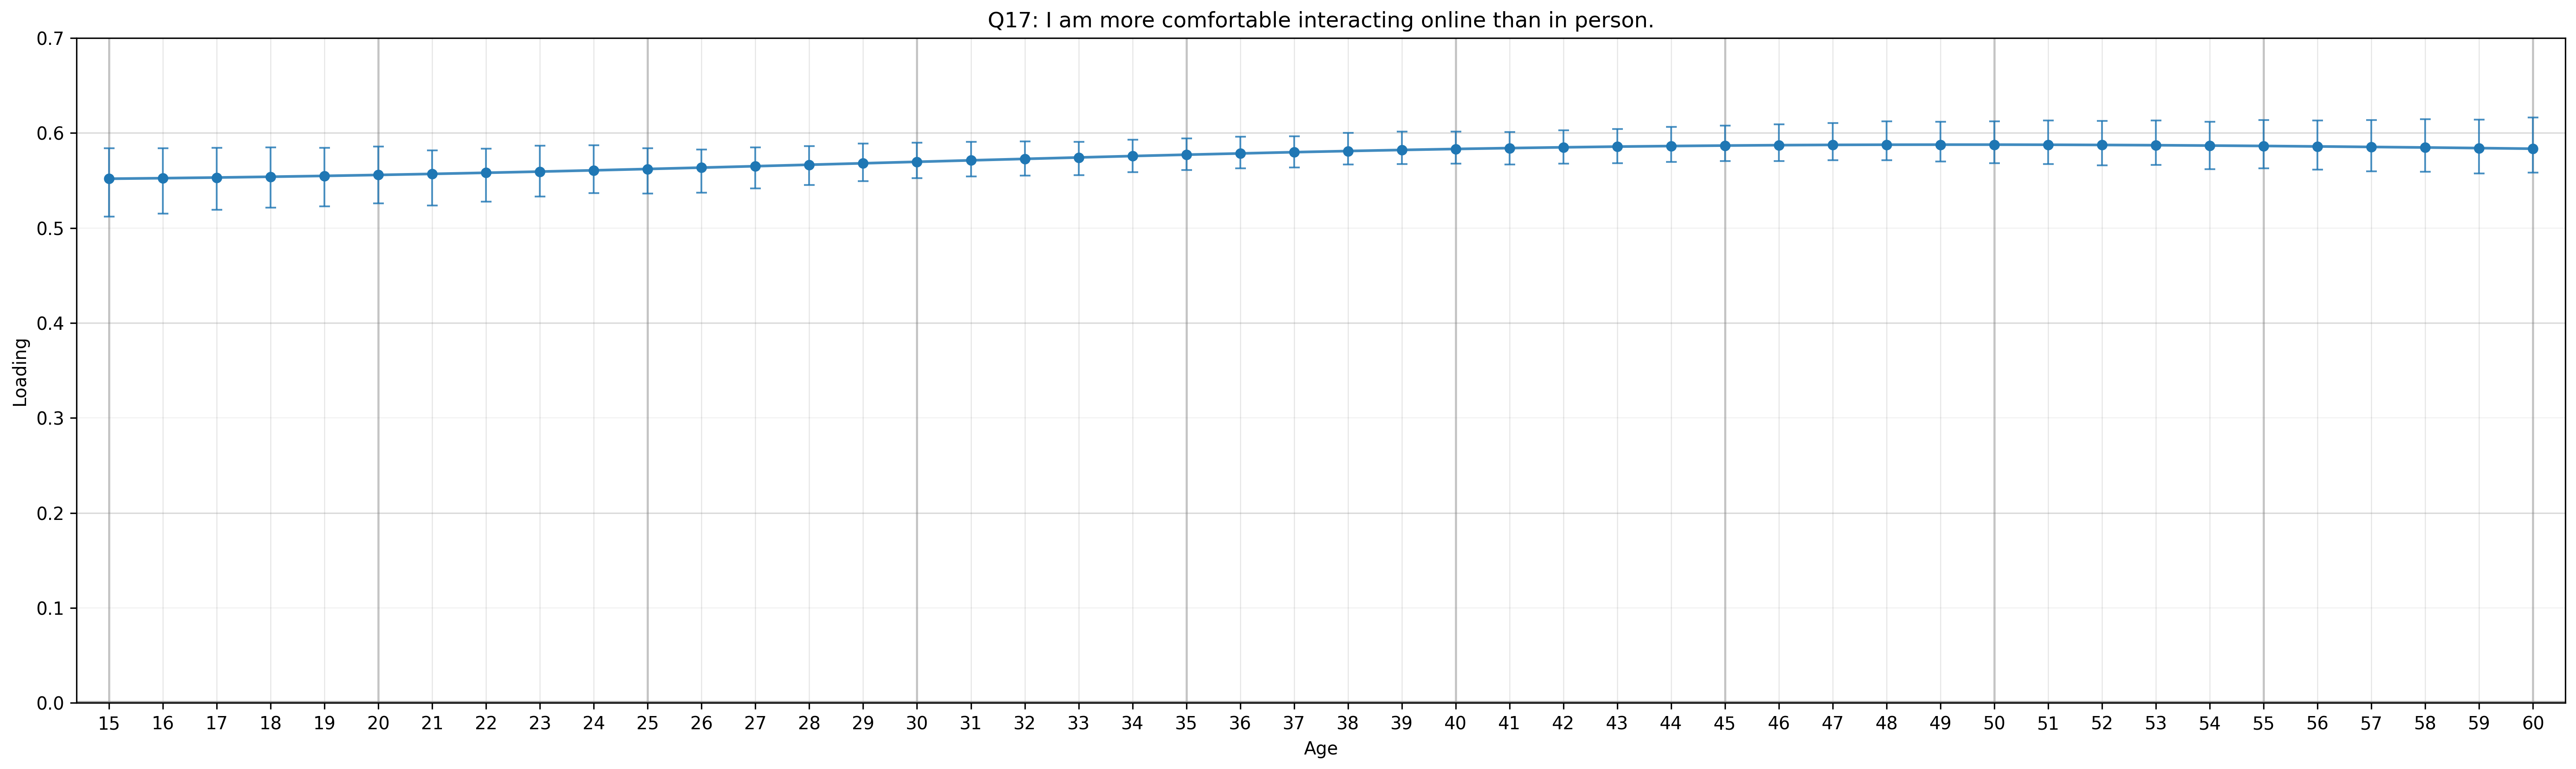
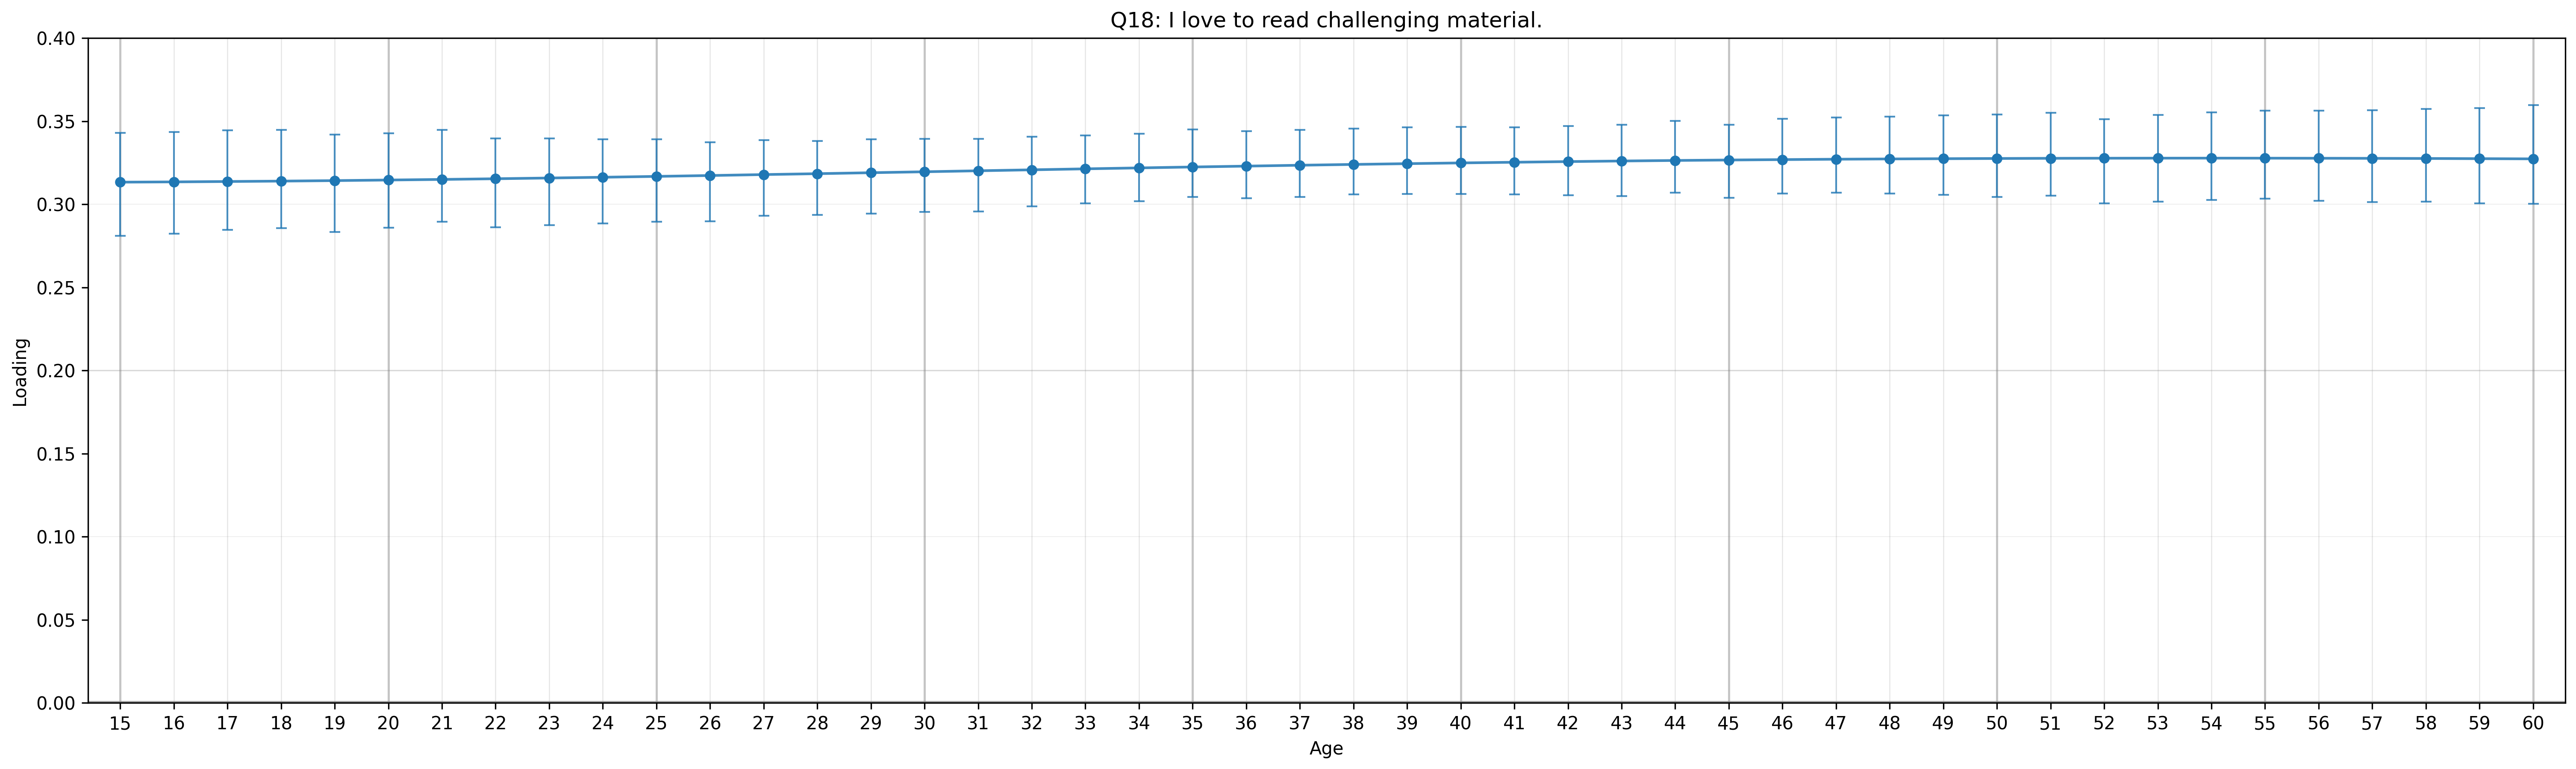
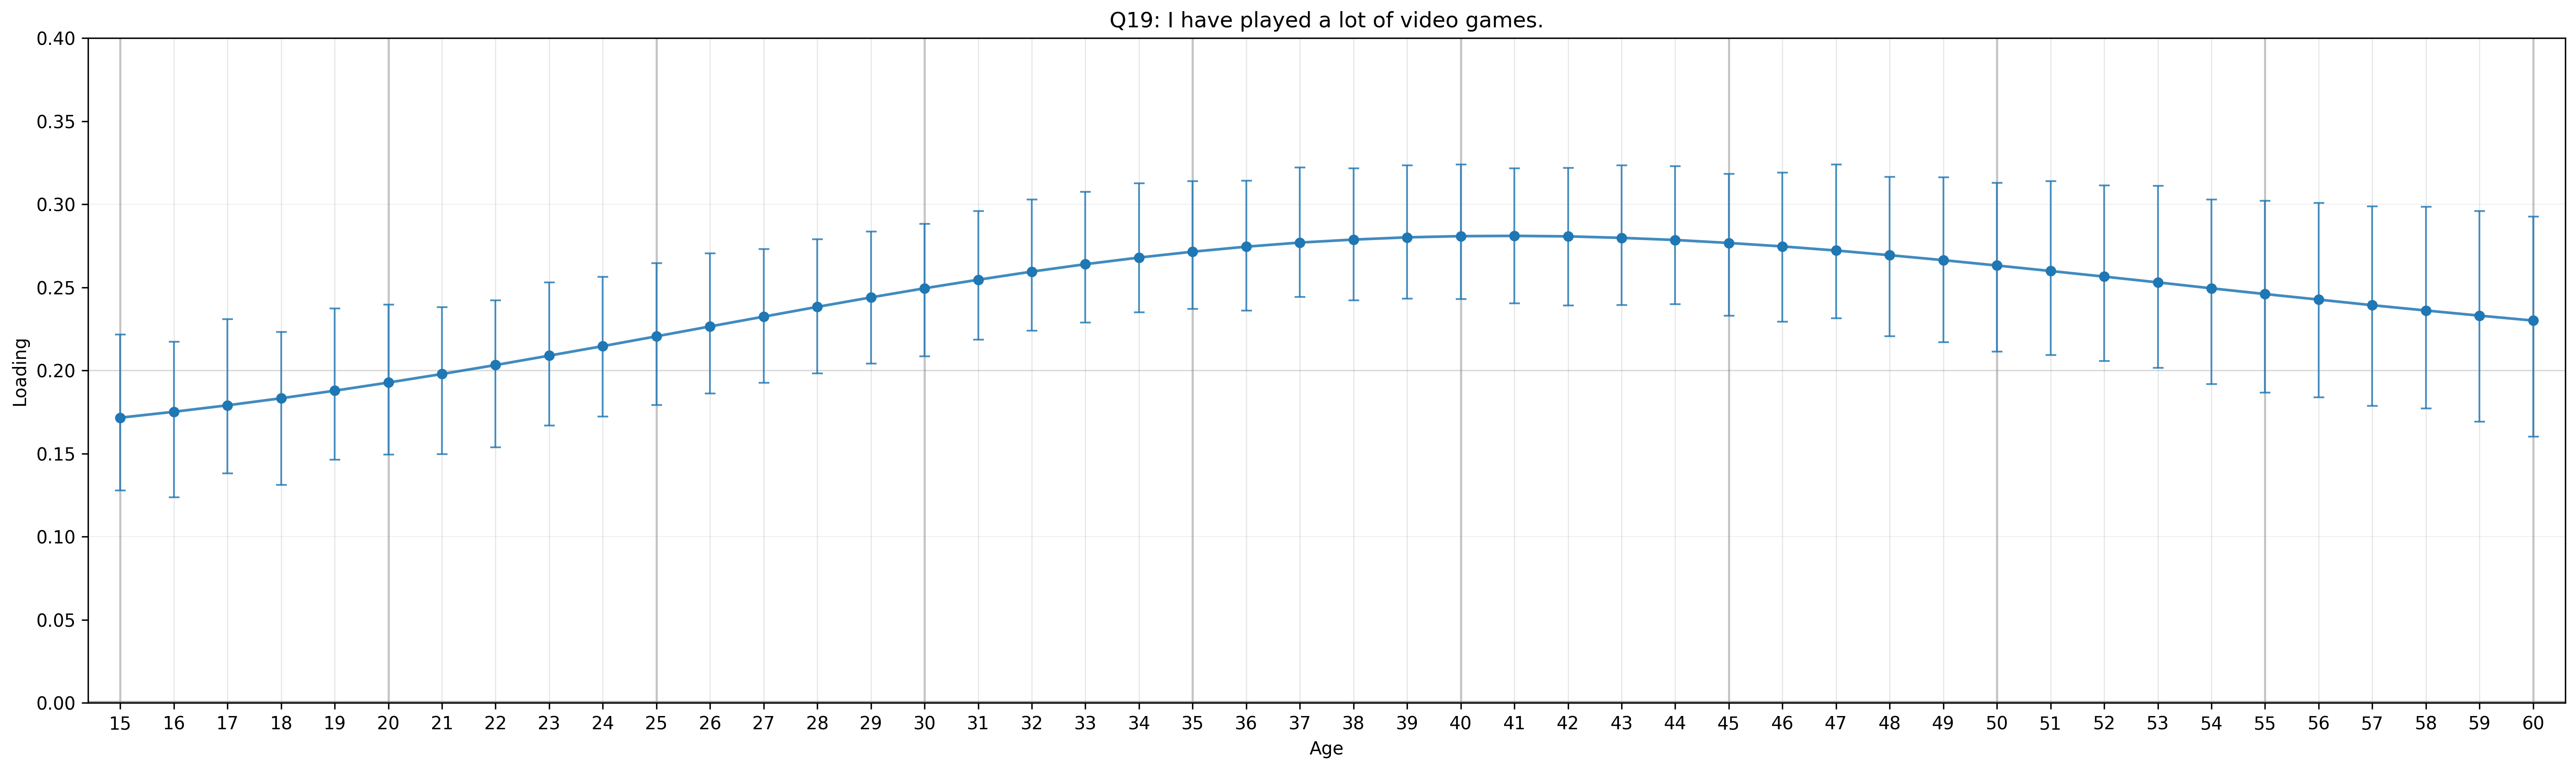
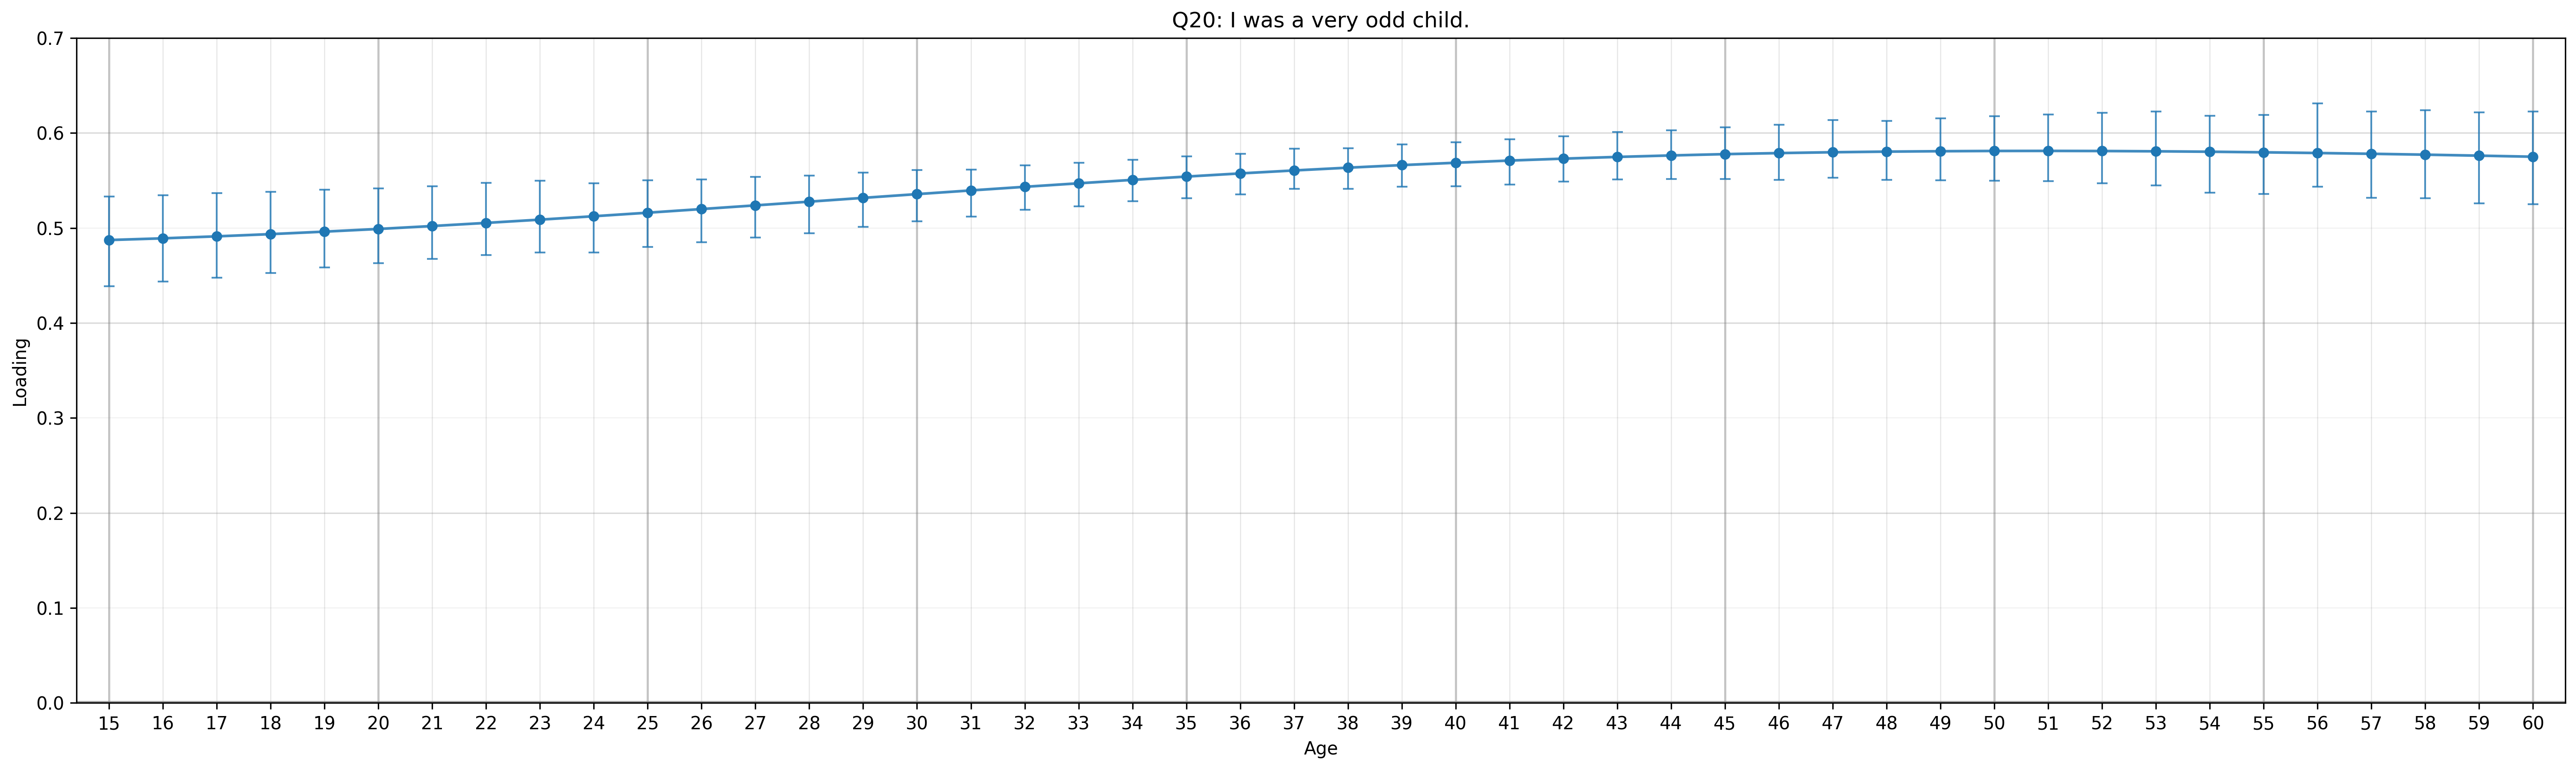
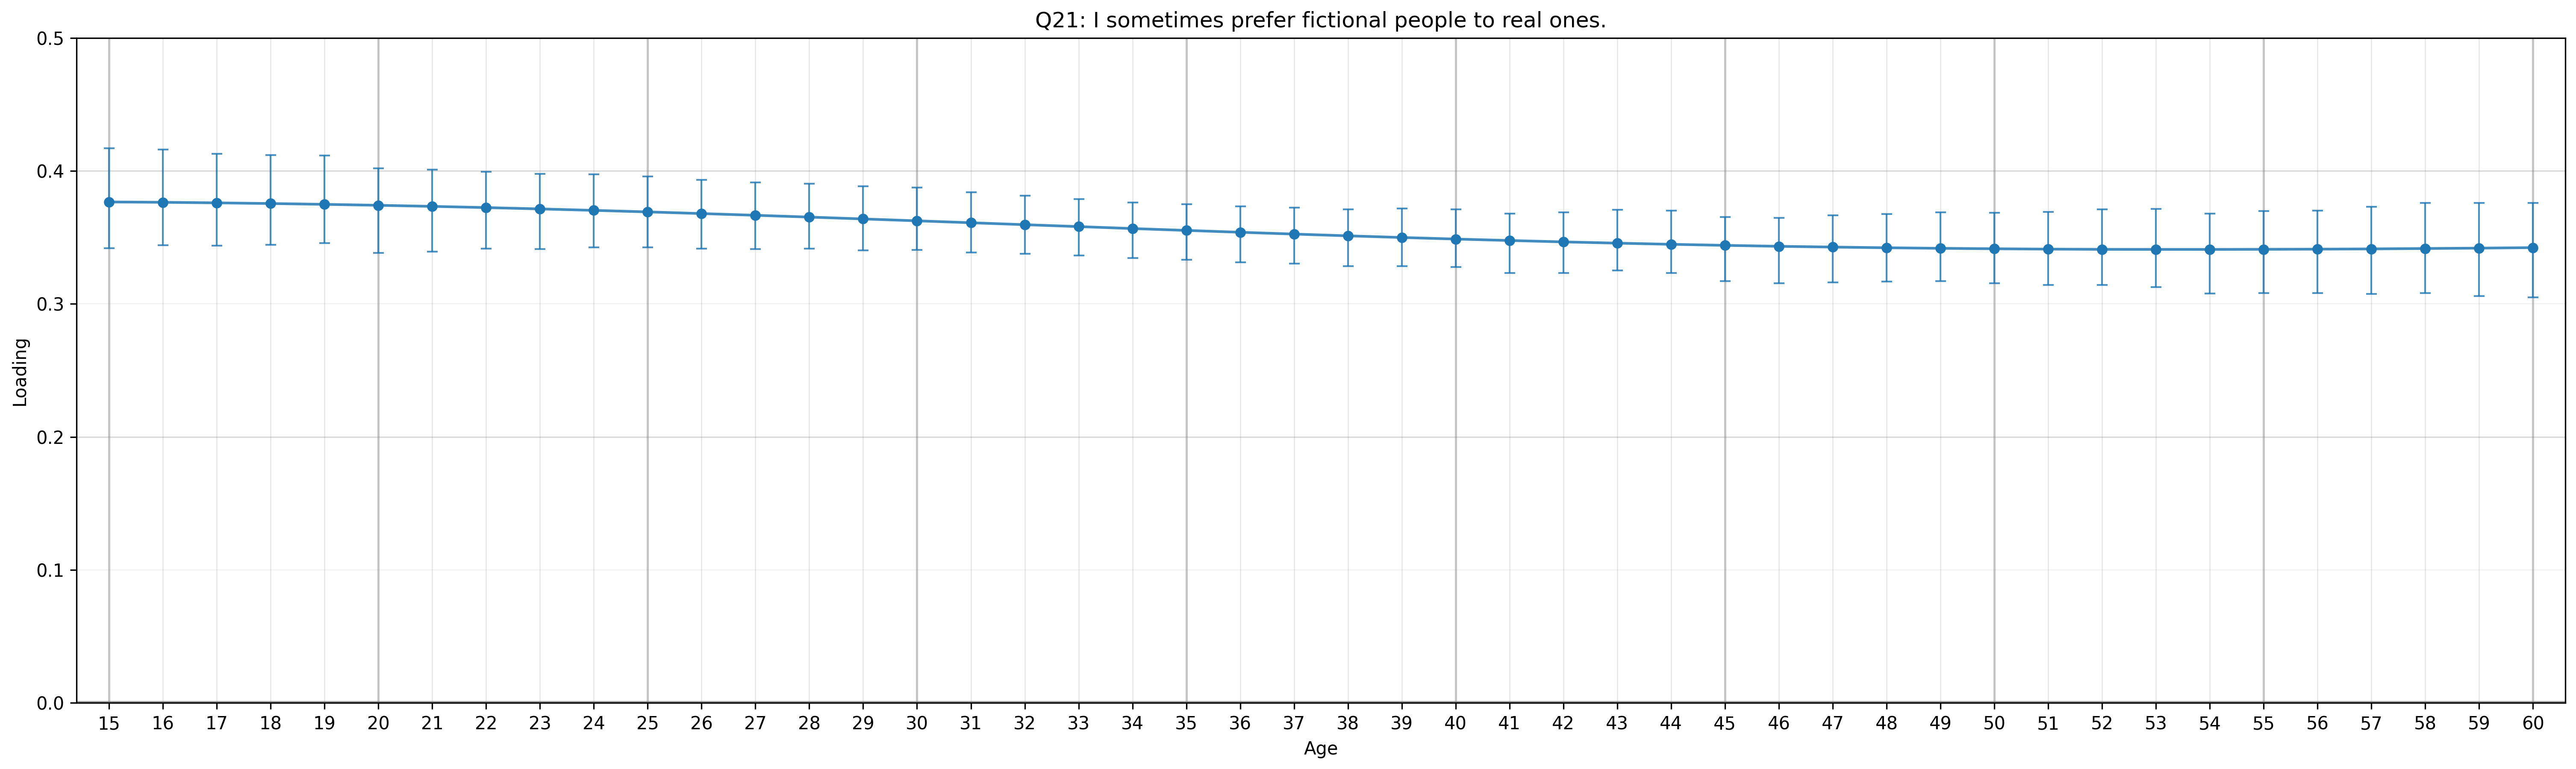
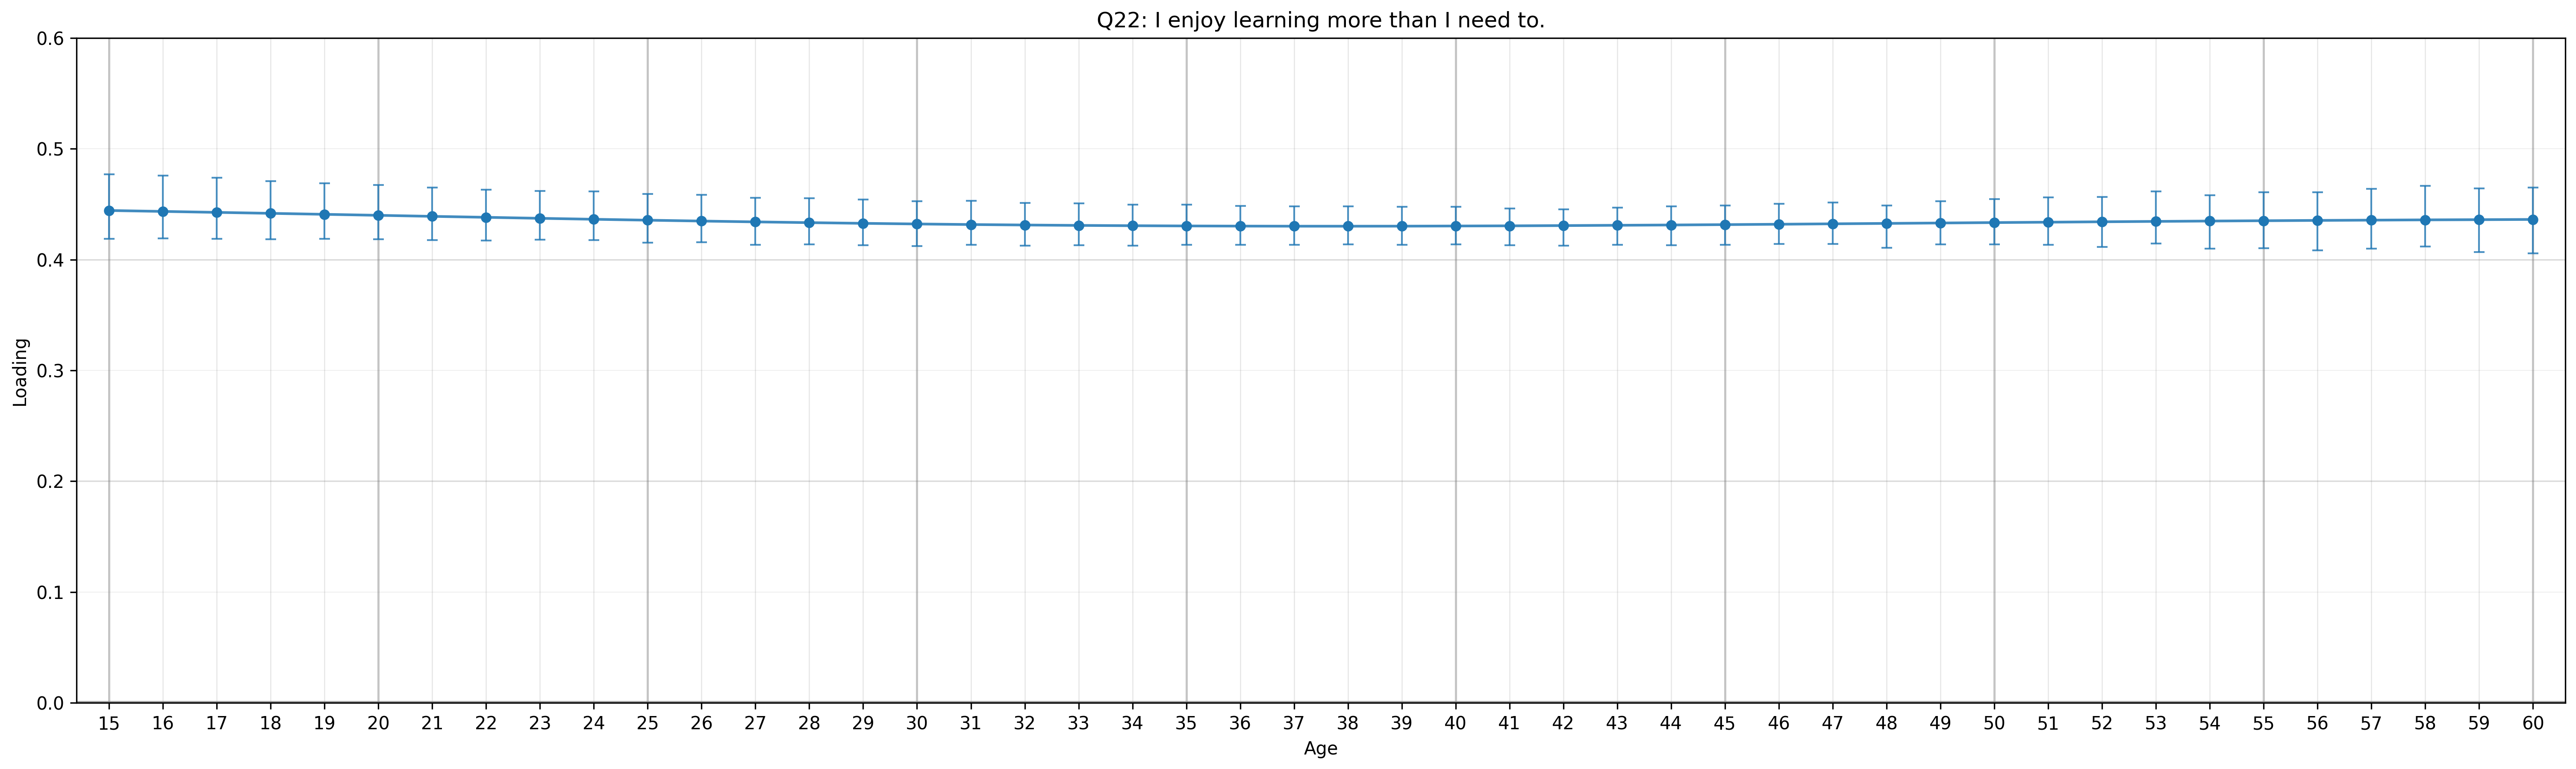
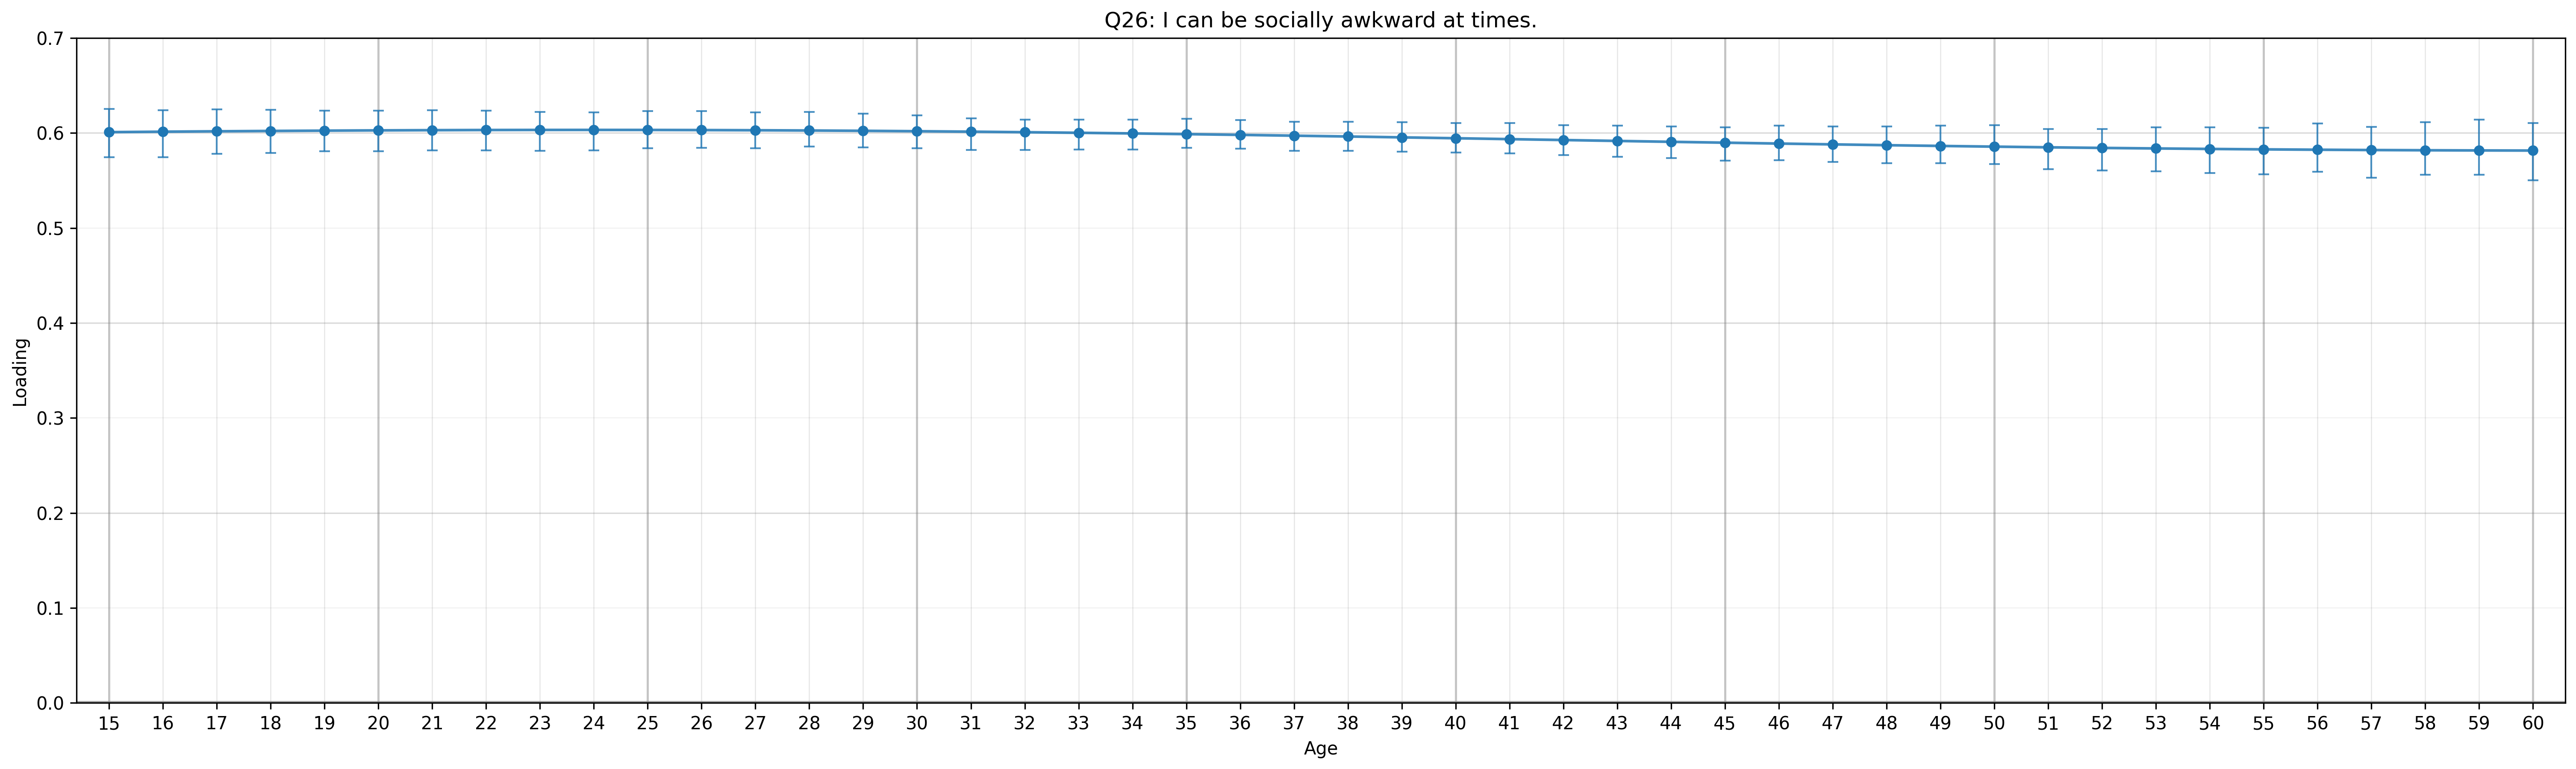
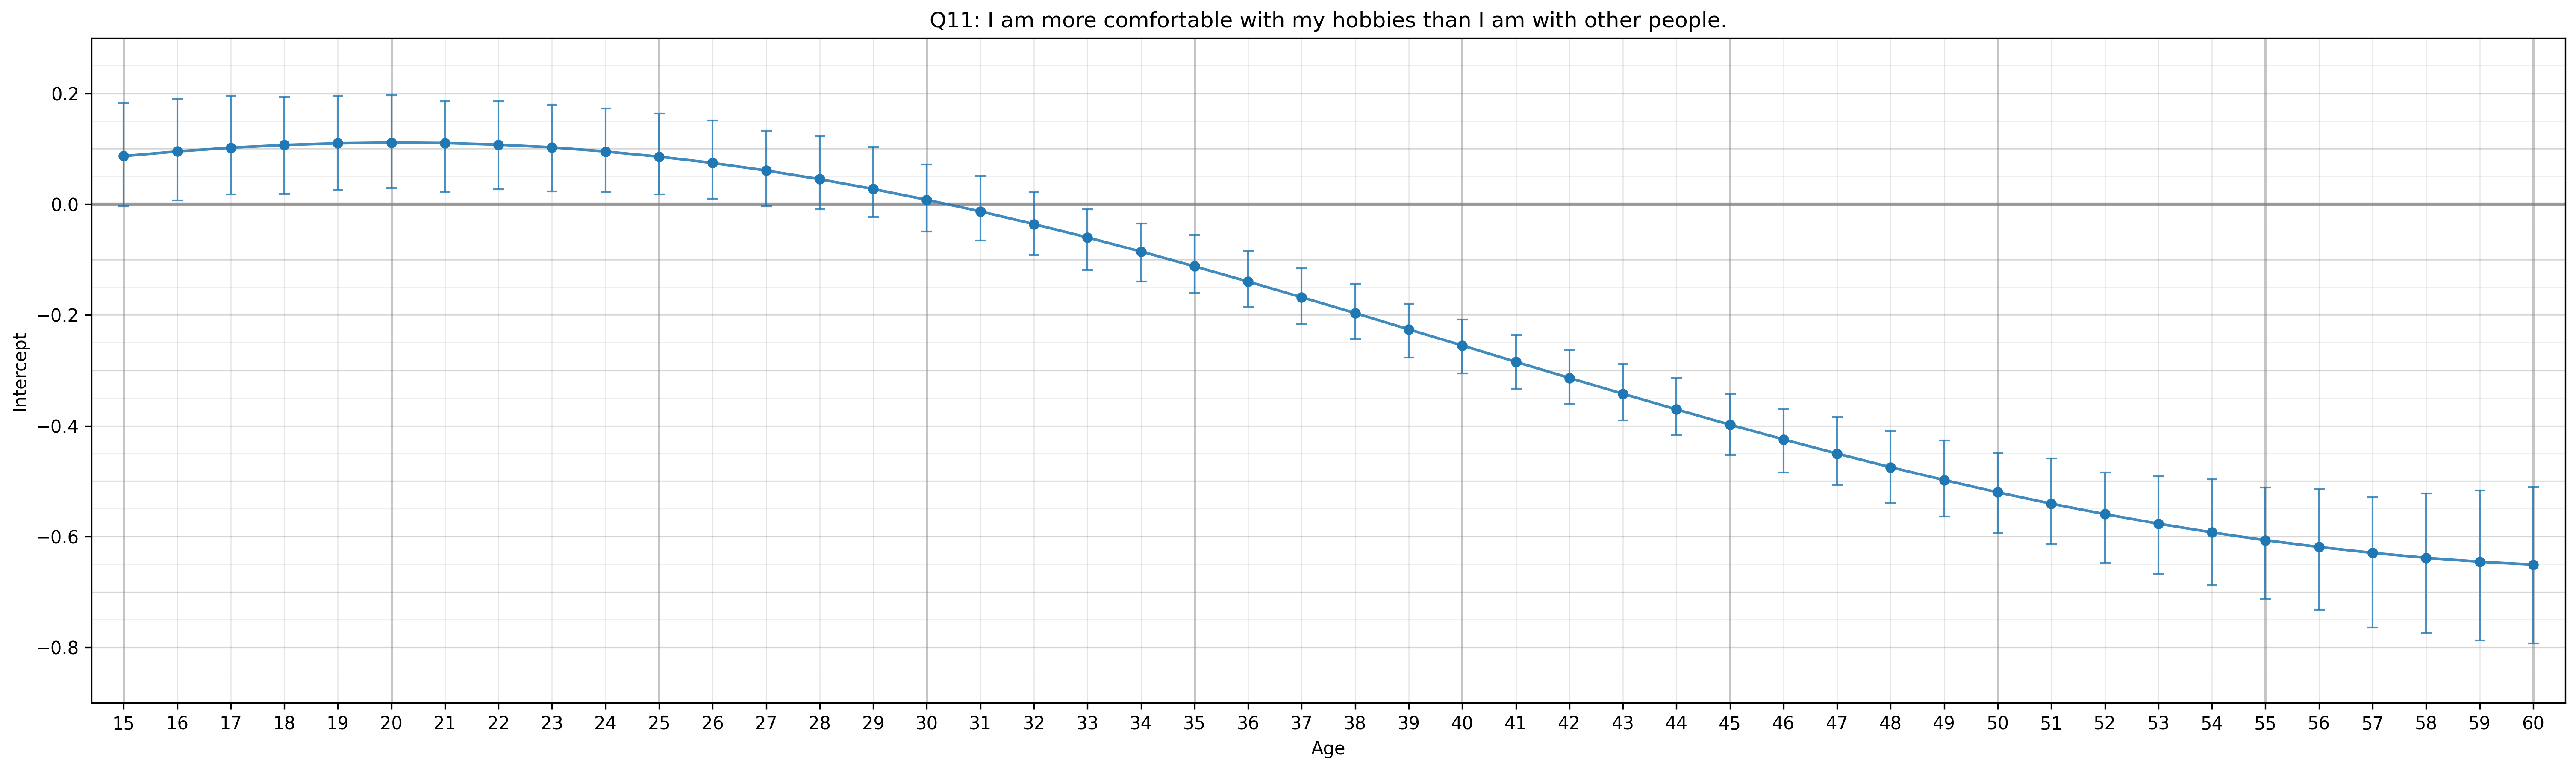
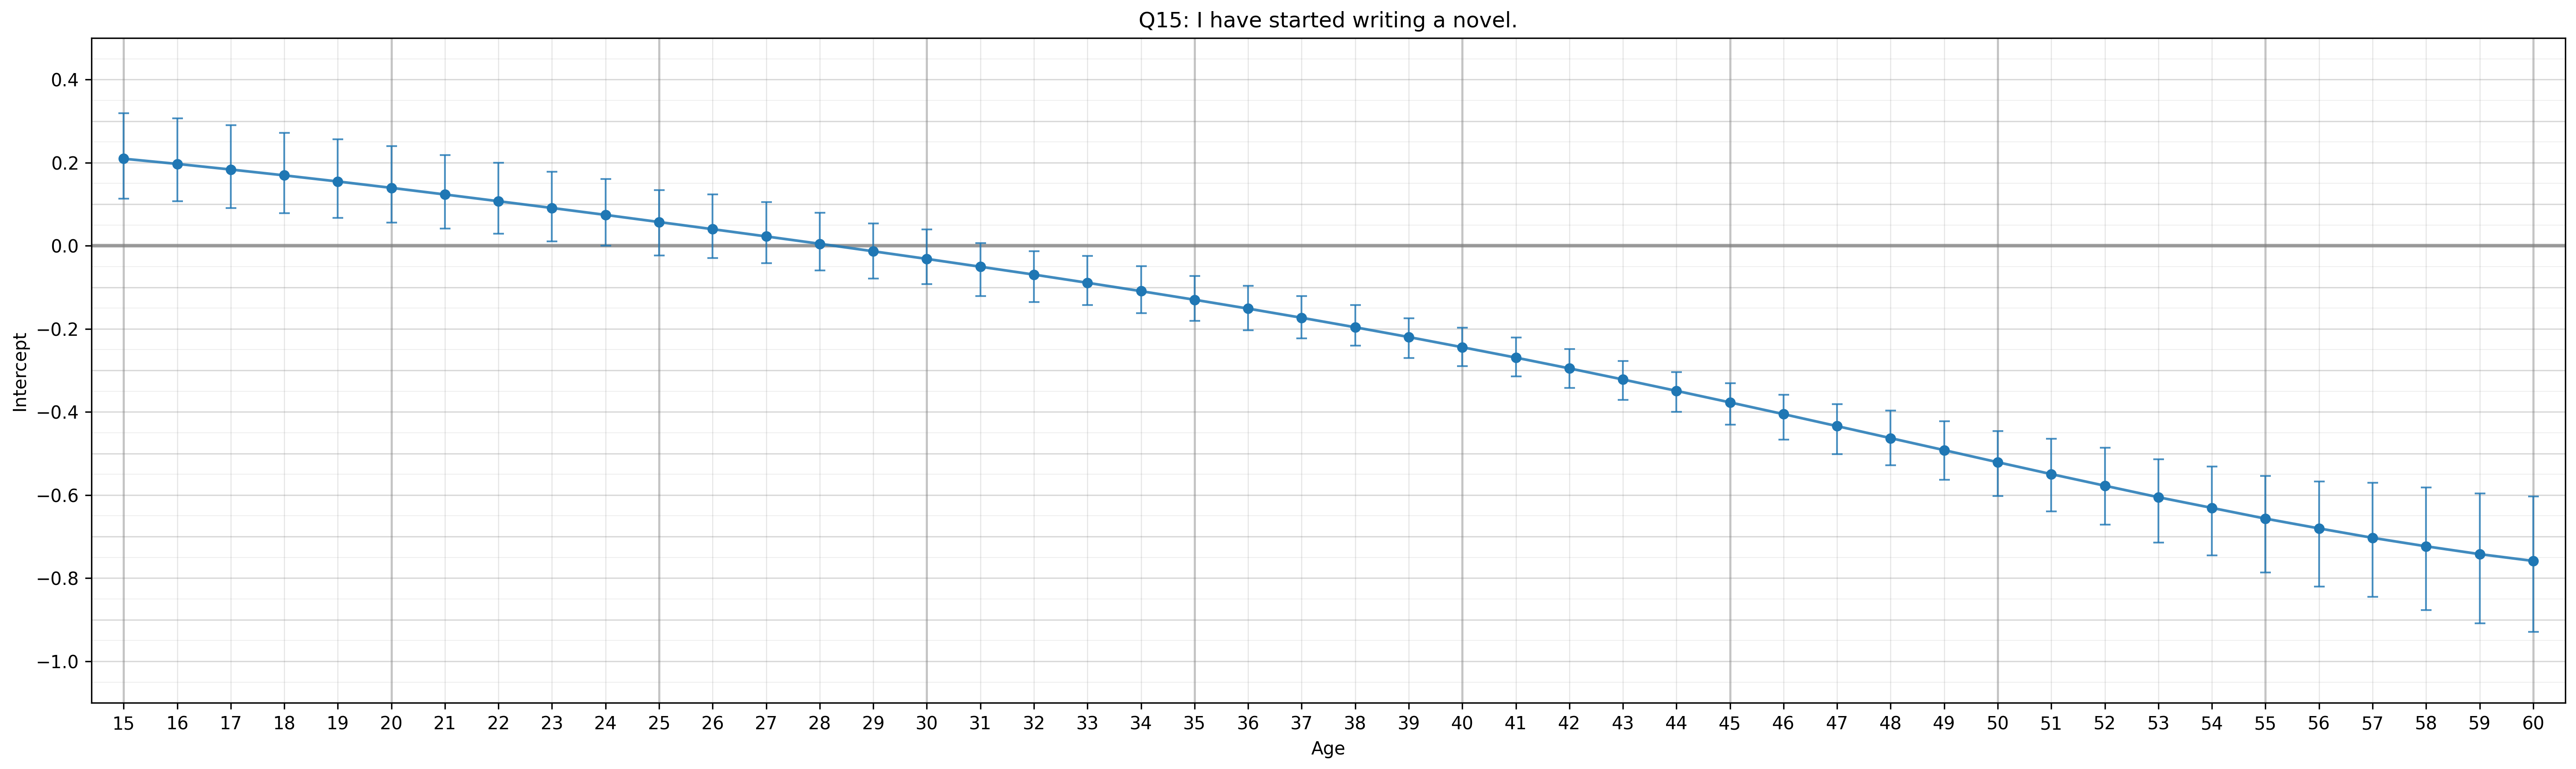
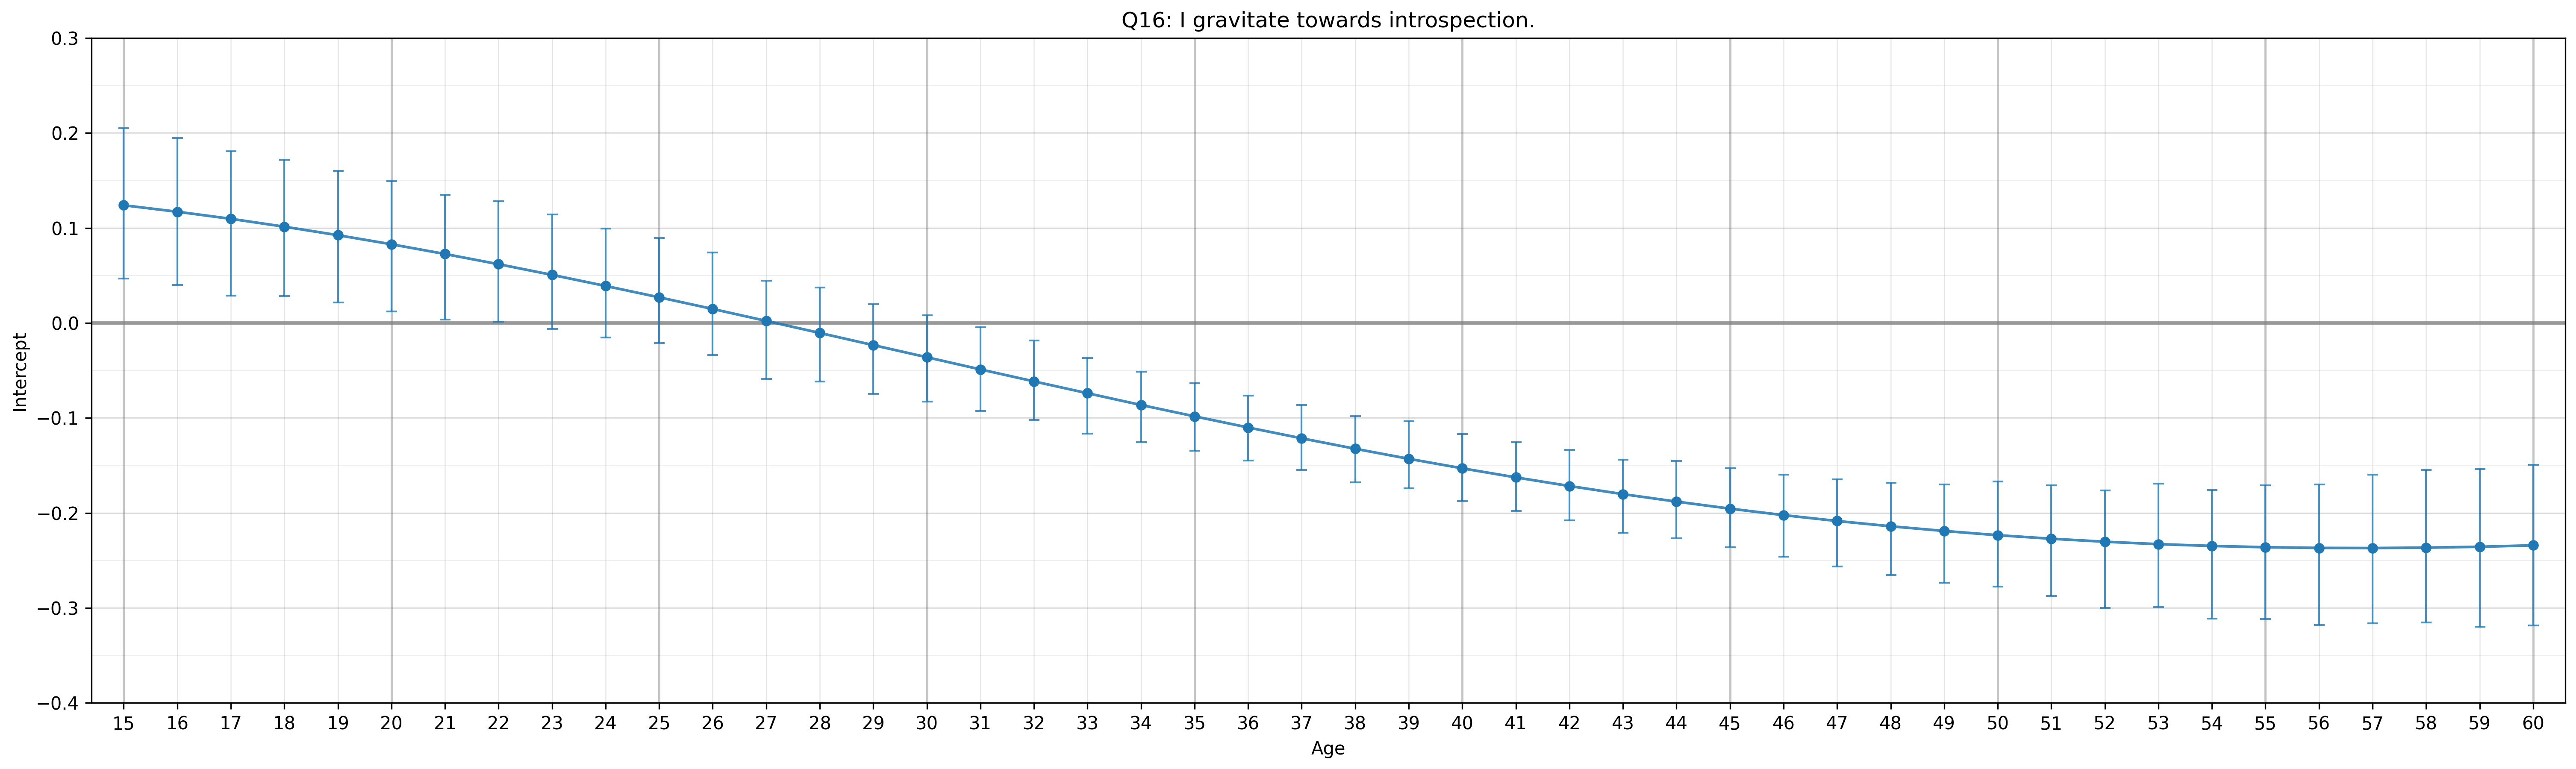
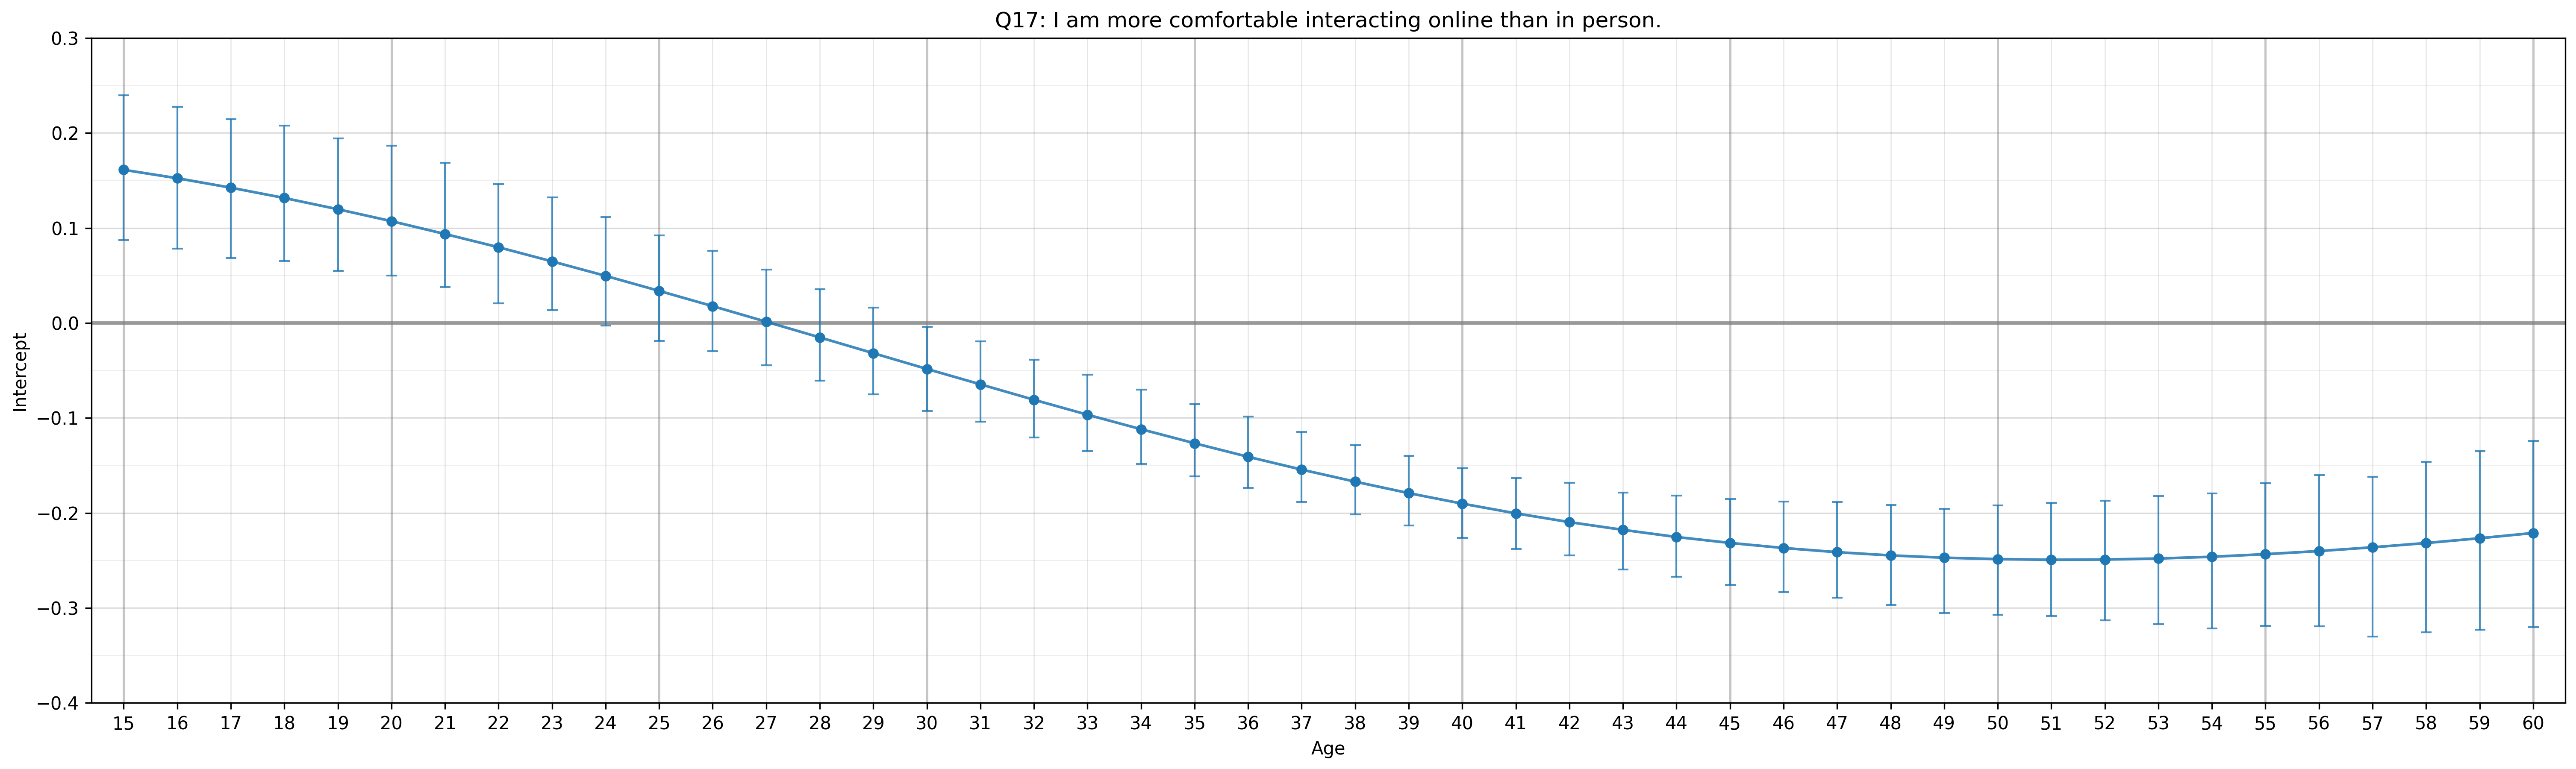
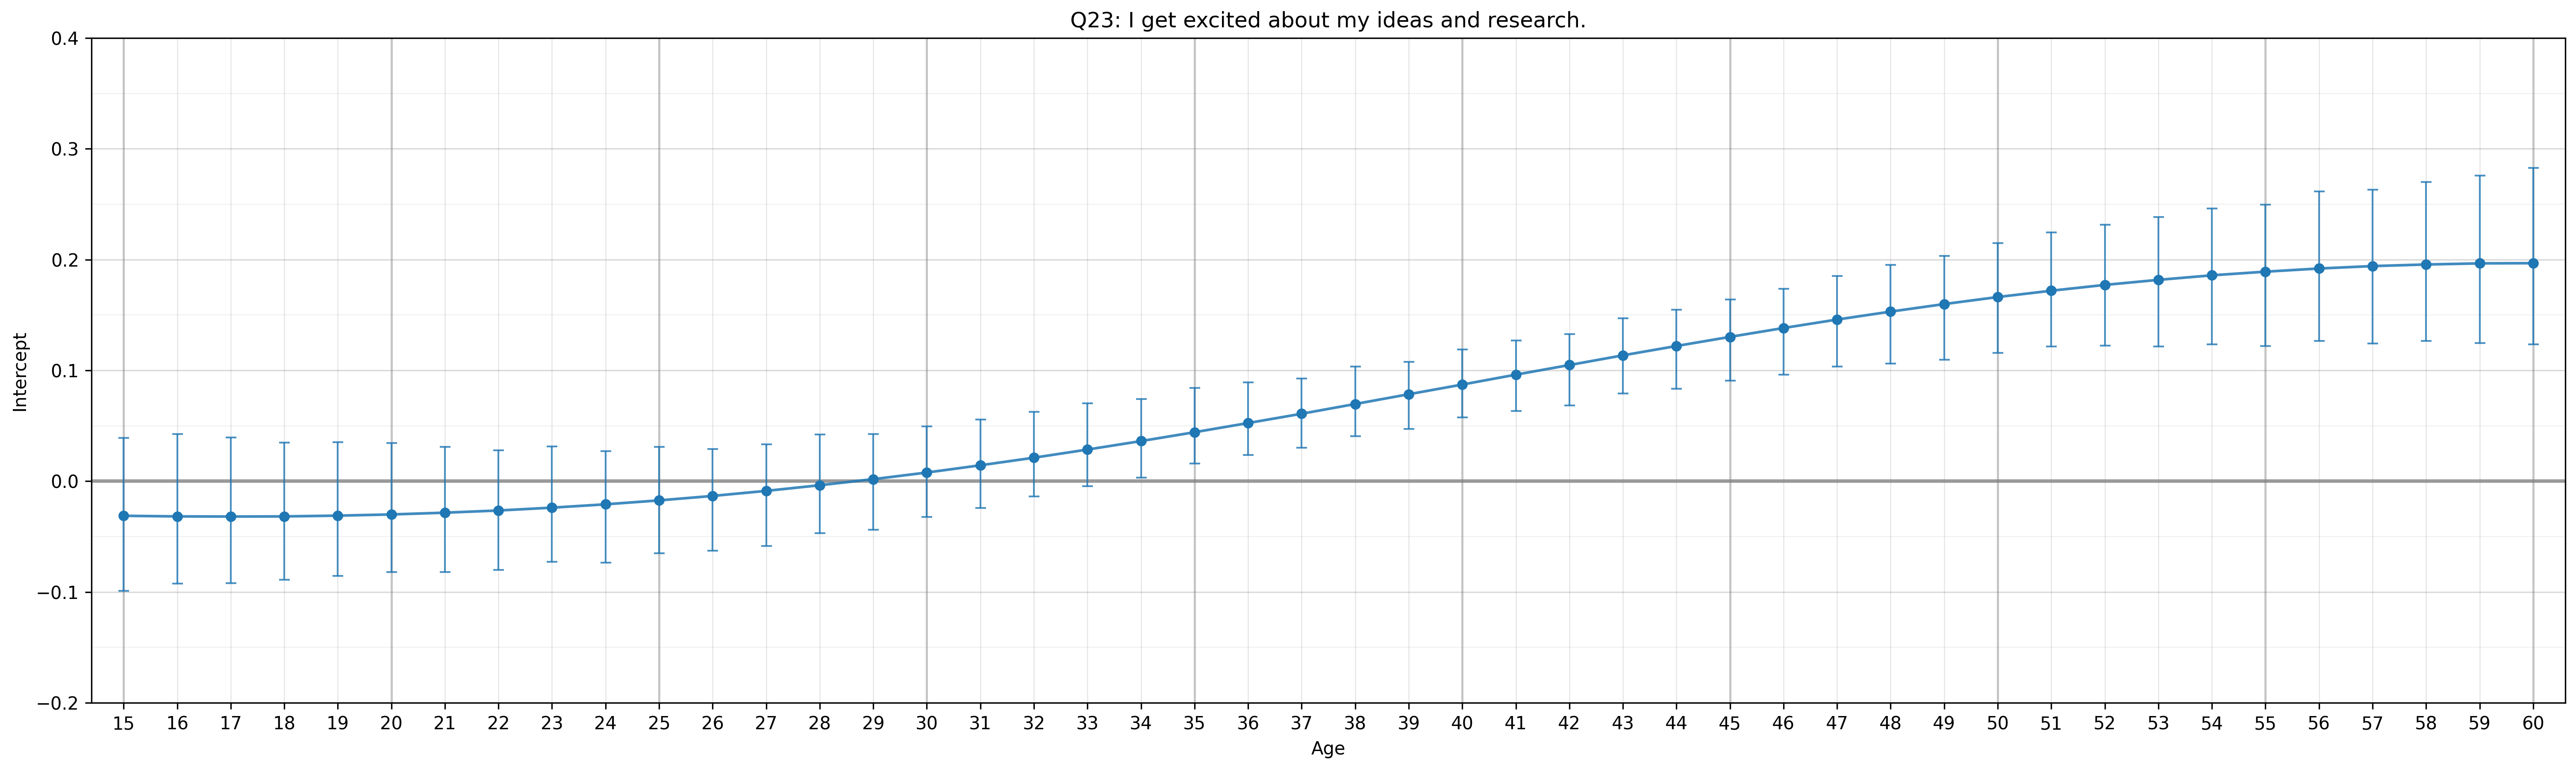
The following graphs show how item loadings vary by age. The number in parentheses indicates the item’s overall standardized loading.
Q1: I am interested in science. (0.48)
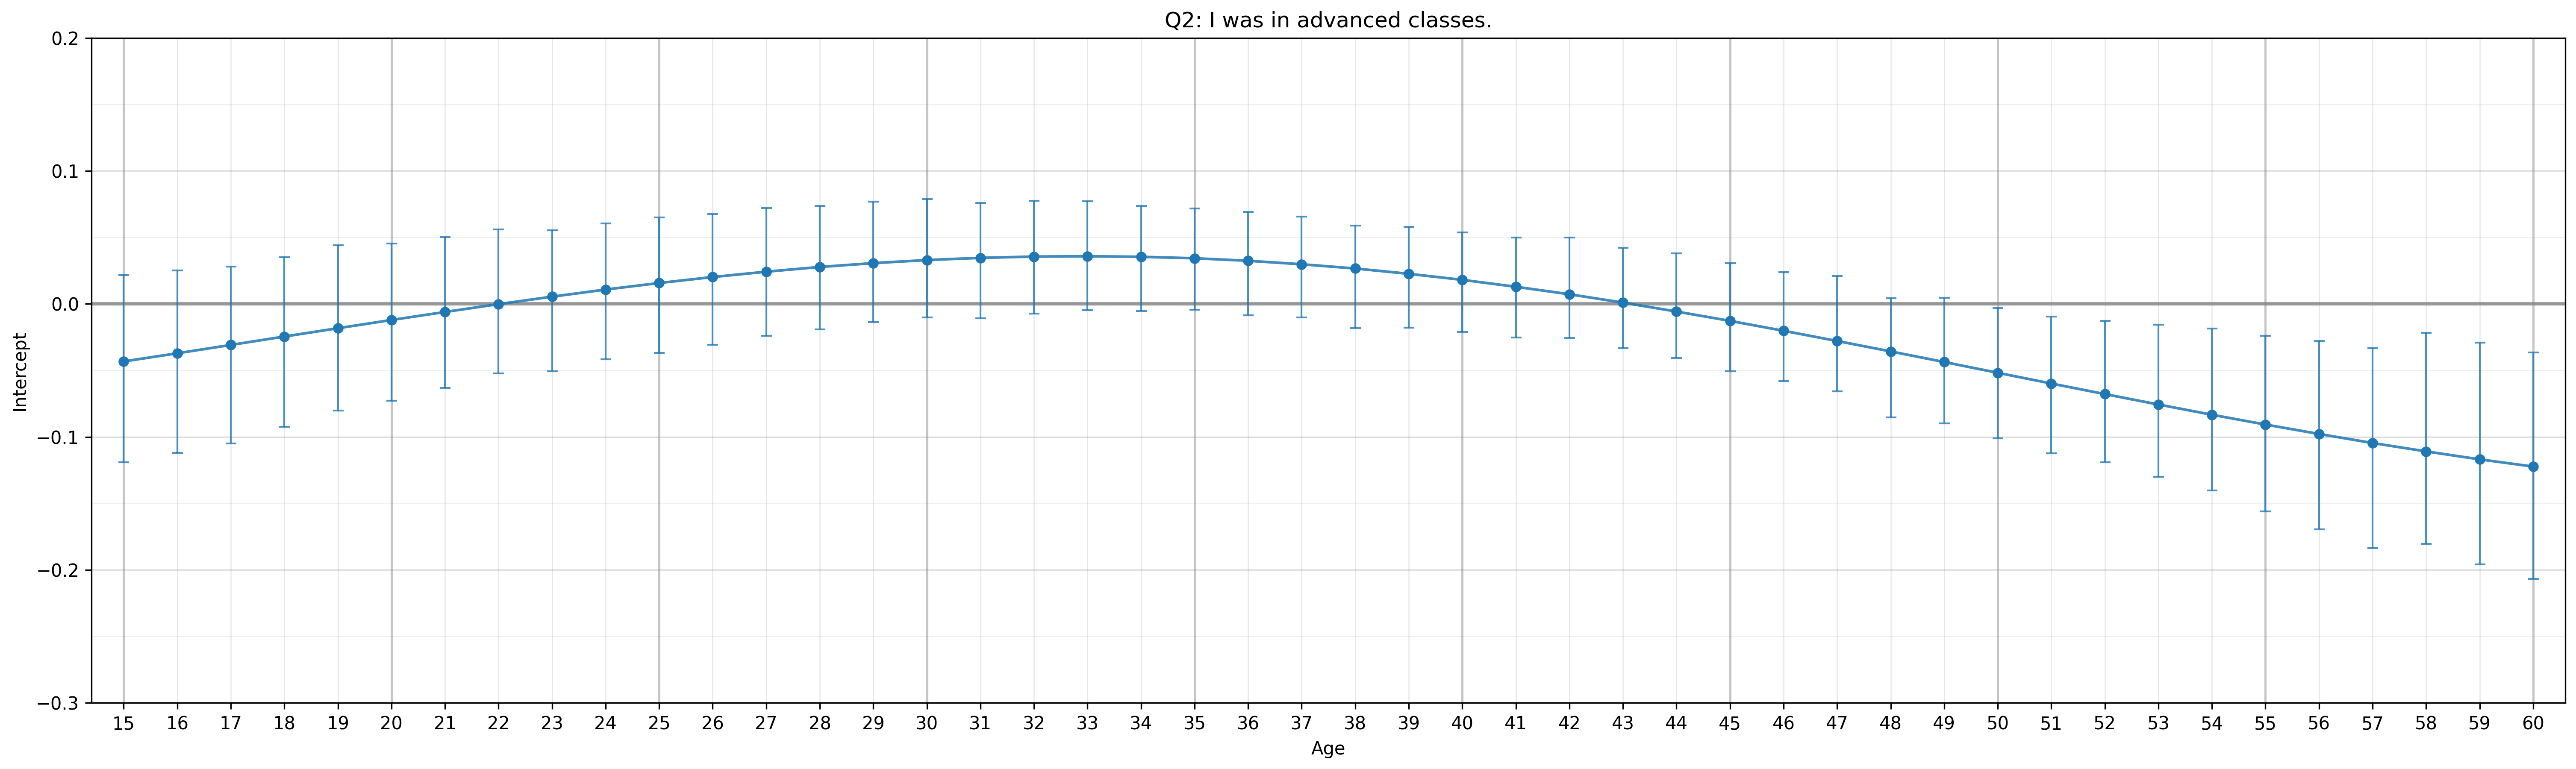
Q2: I was in advanced classes. (0.42)
Q3: I like to play RPGs. (Ex. D&D) (0.44)
Q4: My appearance is not as important as my intelligence. (0.50)
Q5: I collect books. (0.58)
Q6: I prefer academic success to social success. (0.54)
Q7: I watch science related shows. (0.43)
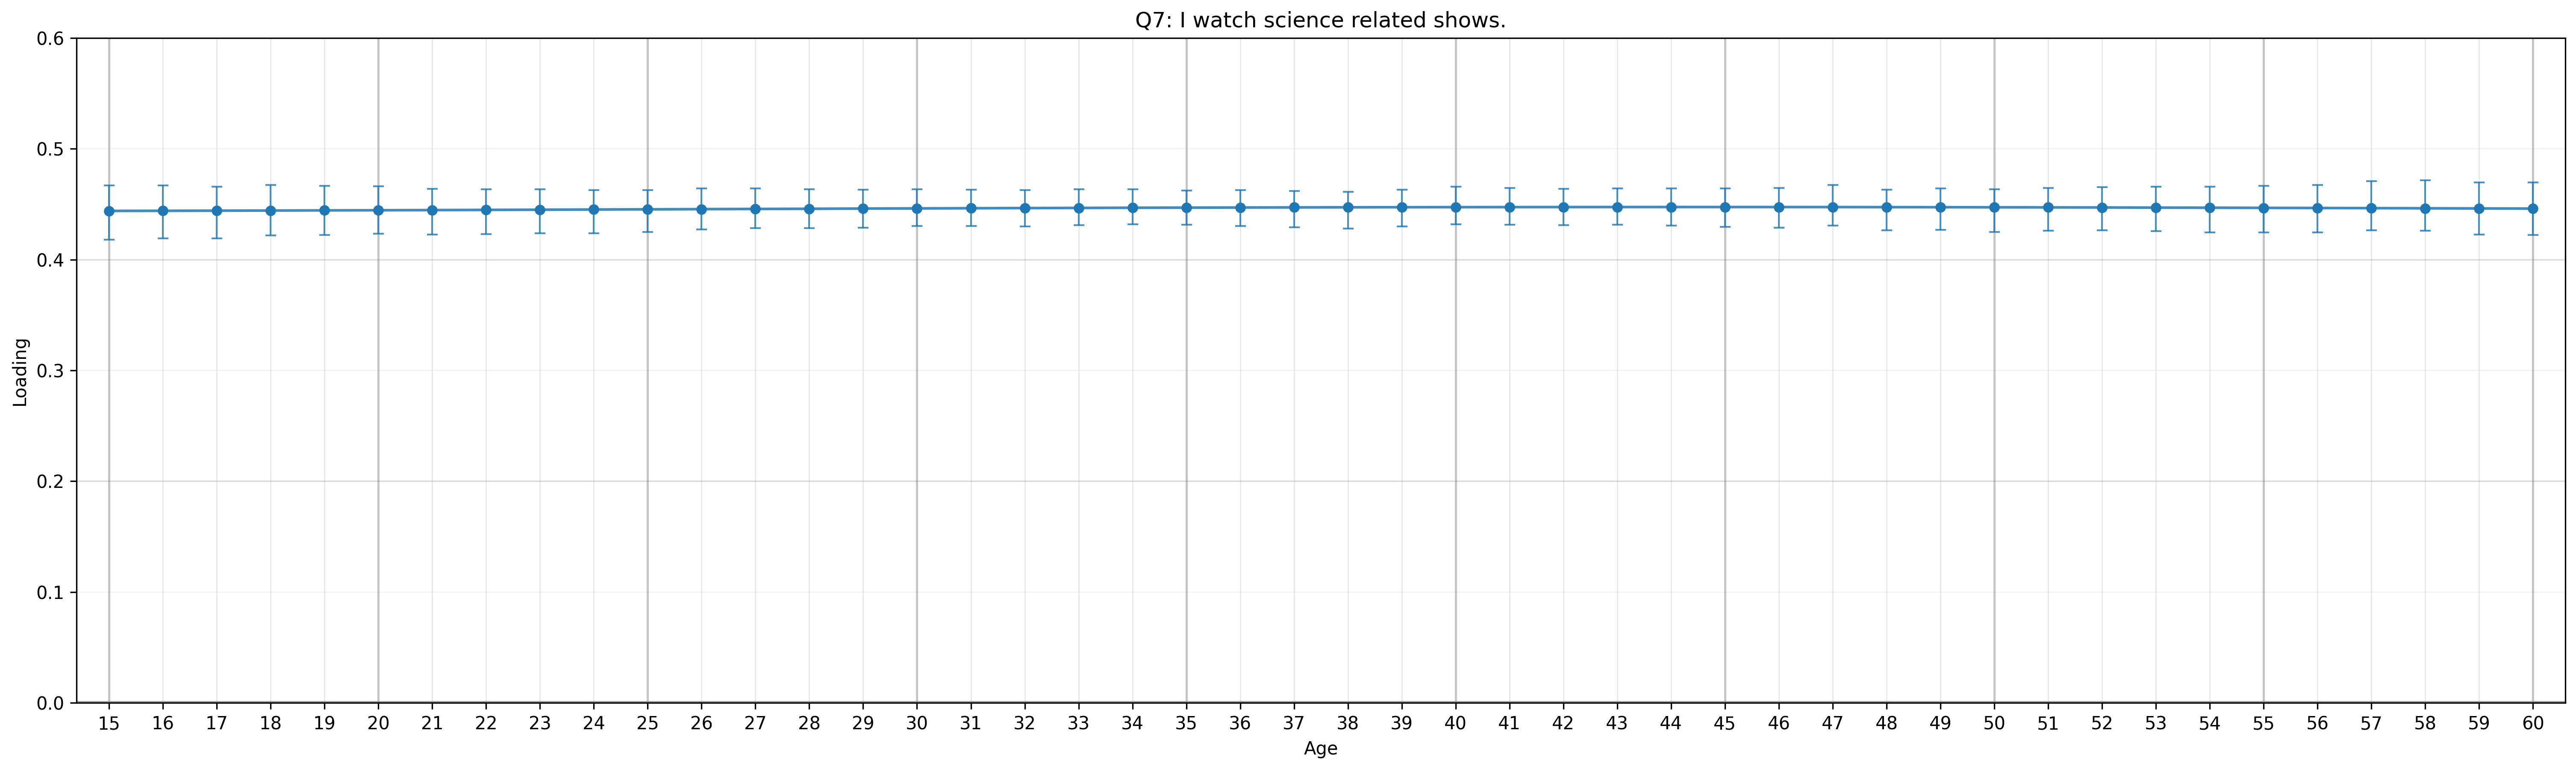
Q8: I spend recreational time researching topics others might find dry or overly rigorous. (0.48)
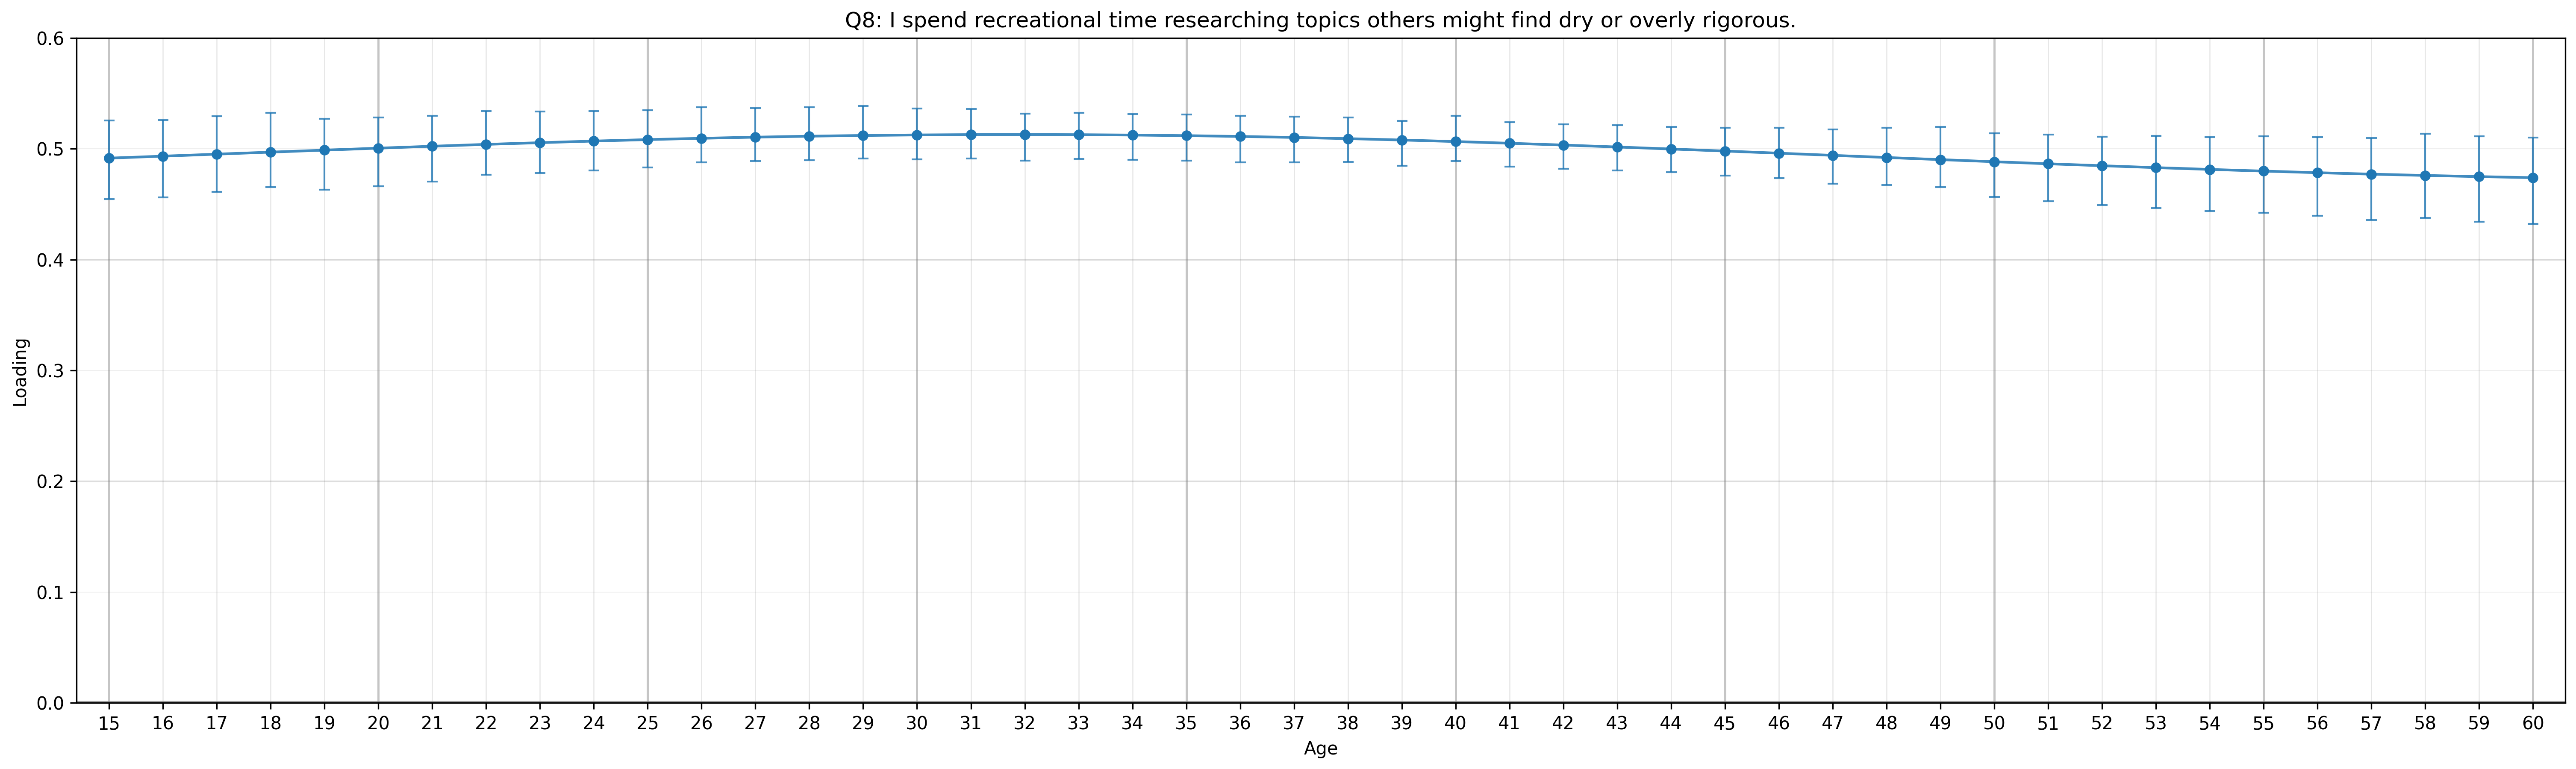
Q9: I like science fiction. (0.56)
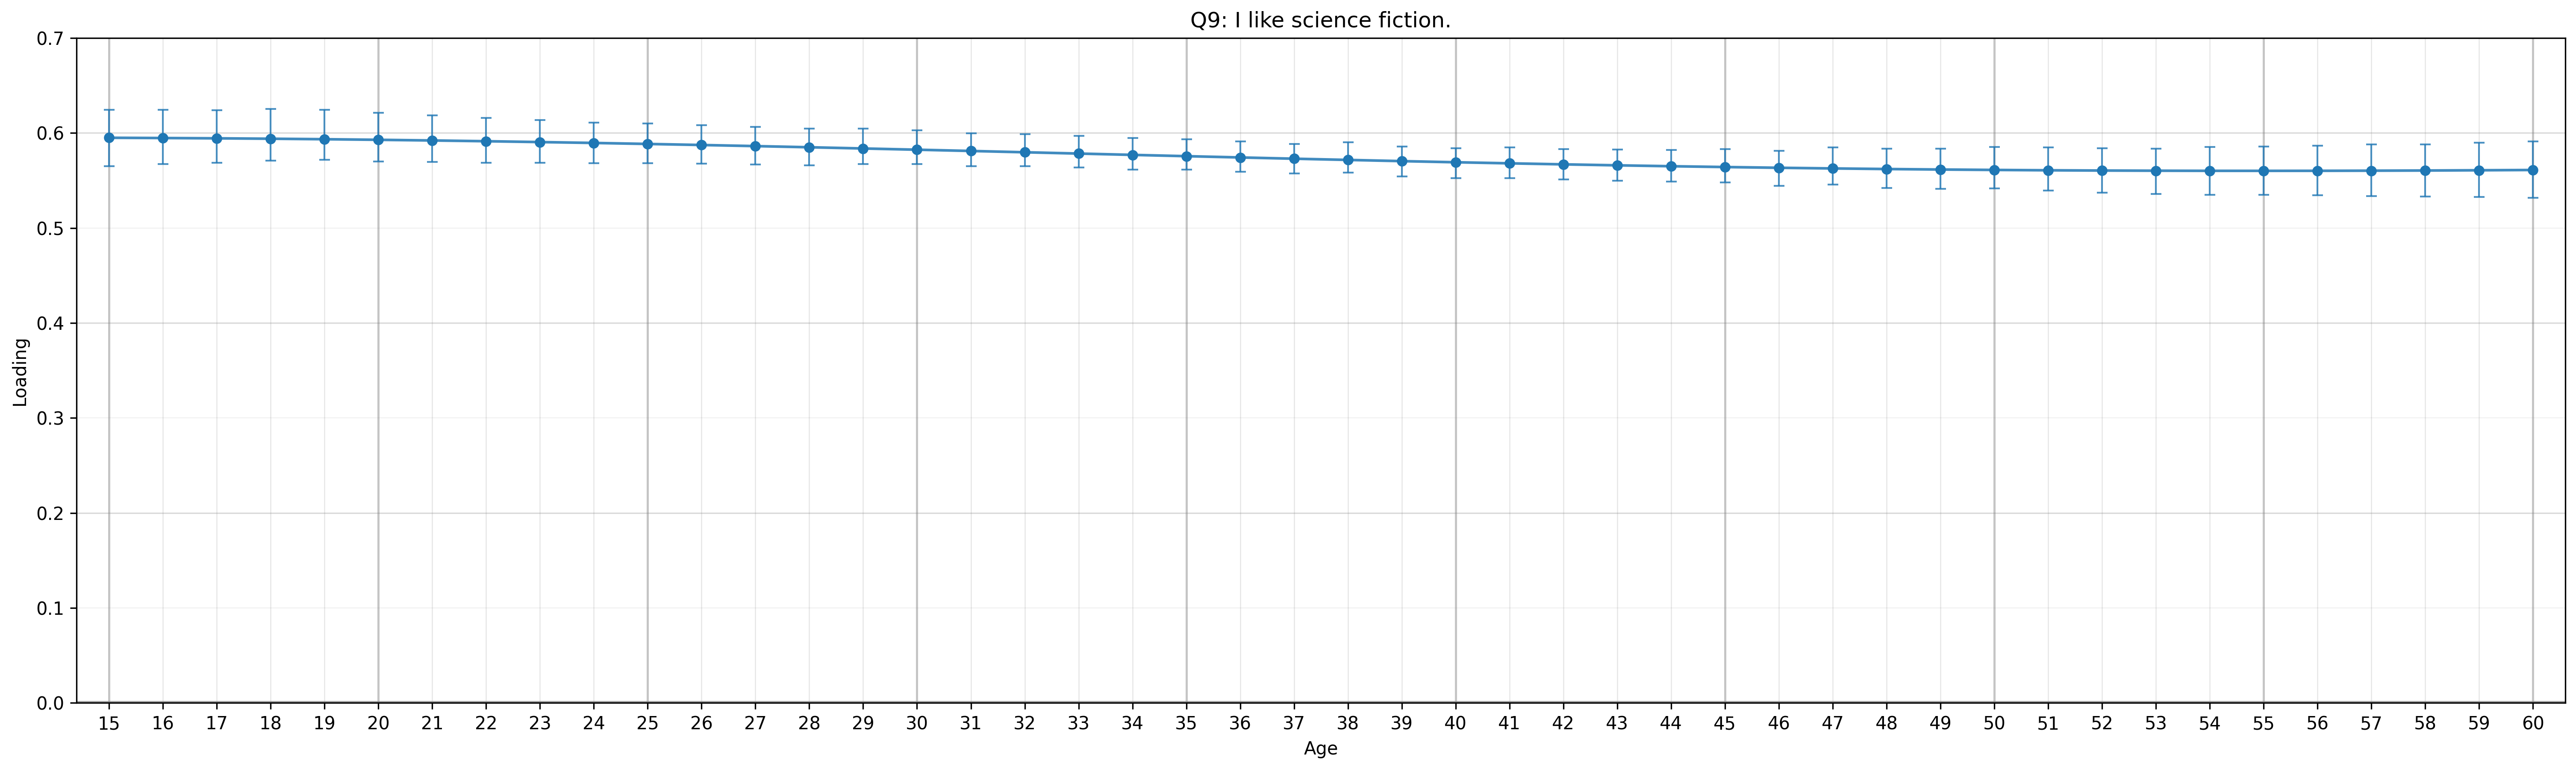
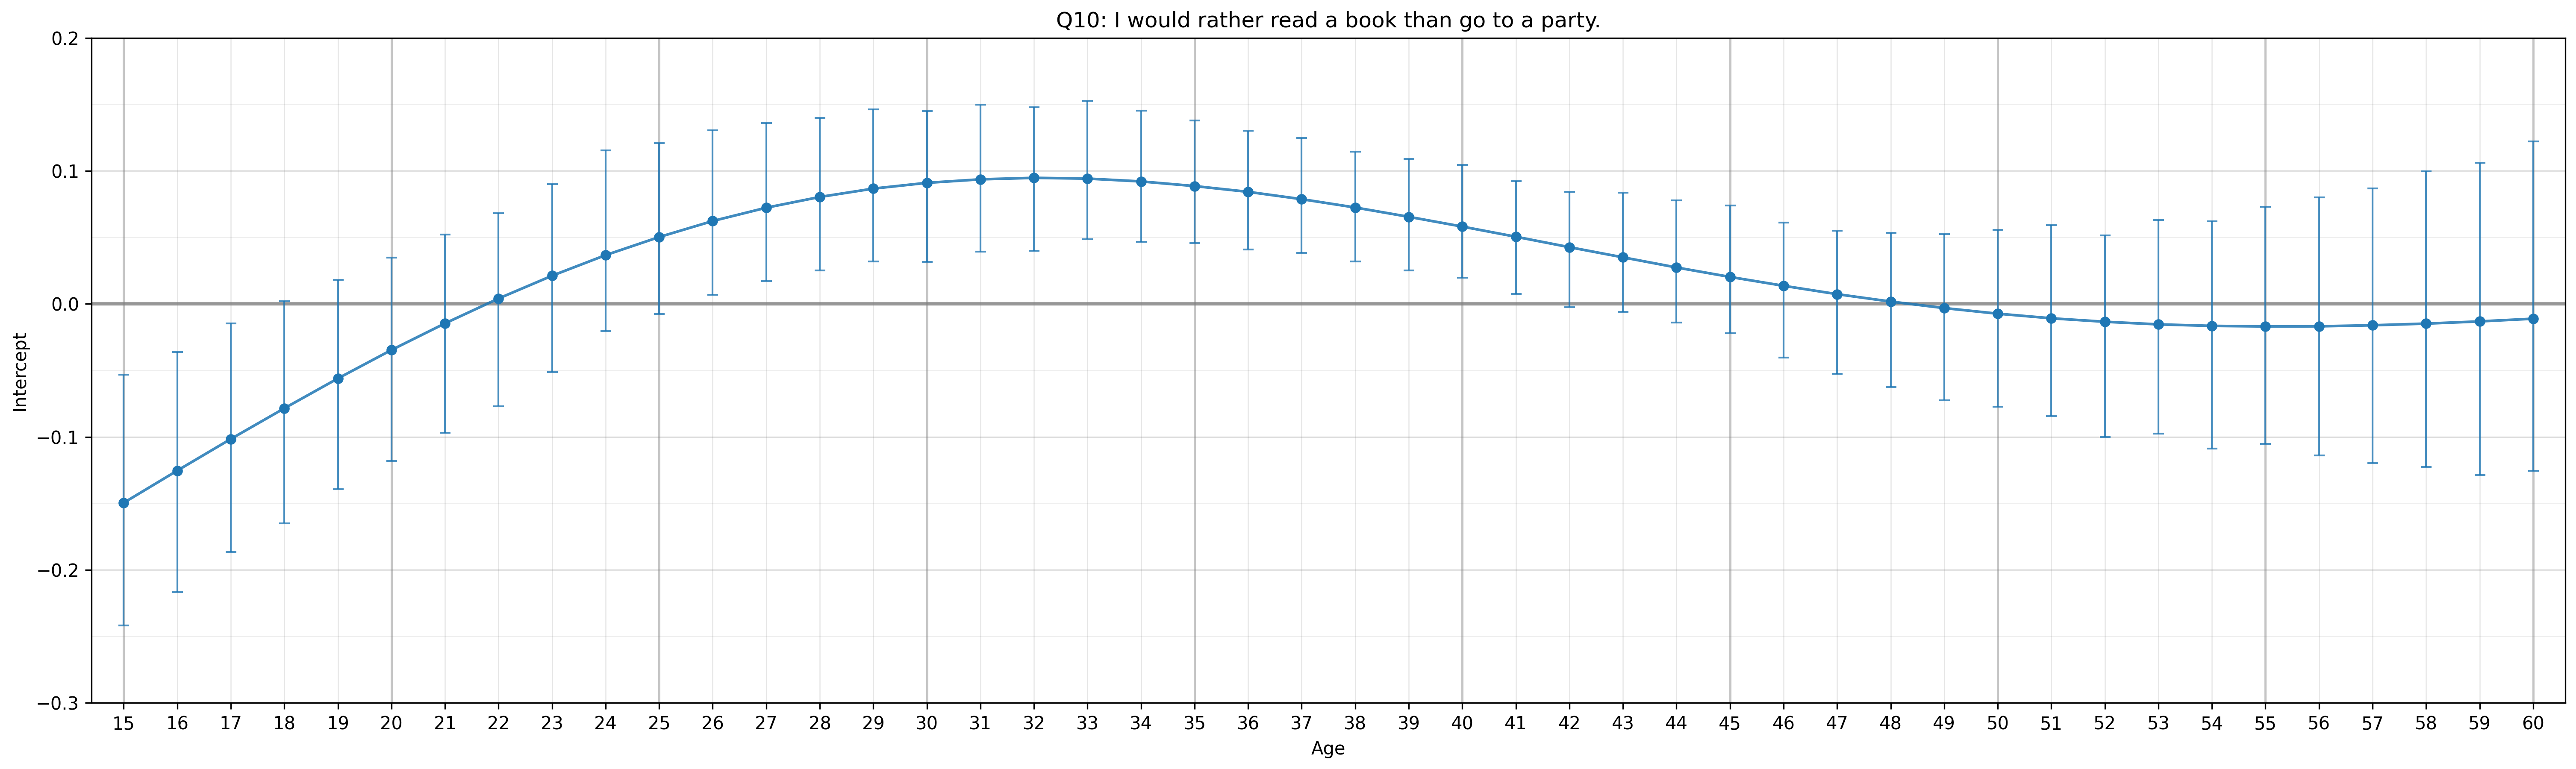
Q10: I would rather read a book than go to a party. (0.49)
Q11: I am more comfortable with my hobbies than I am with other people. (0.29)
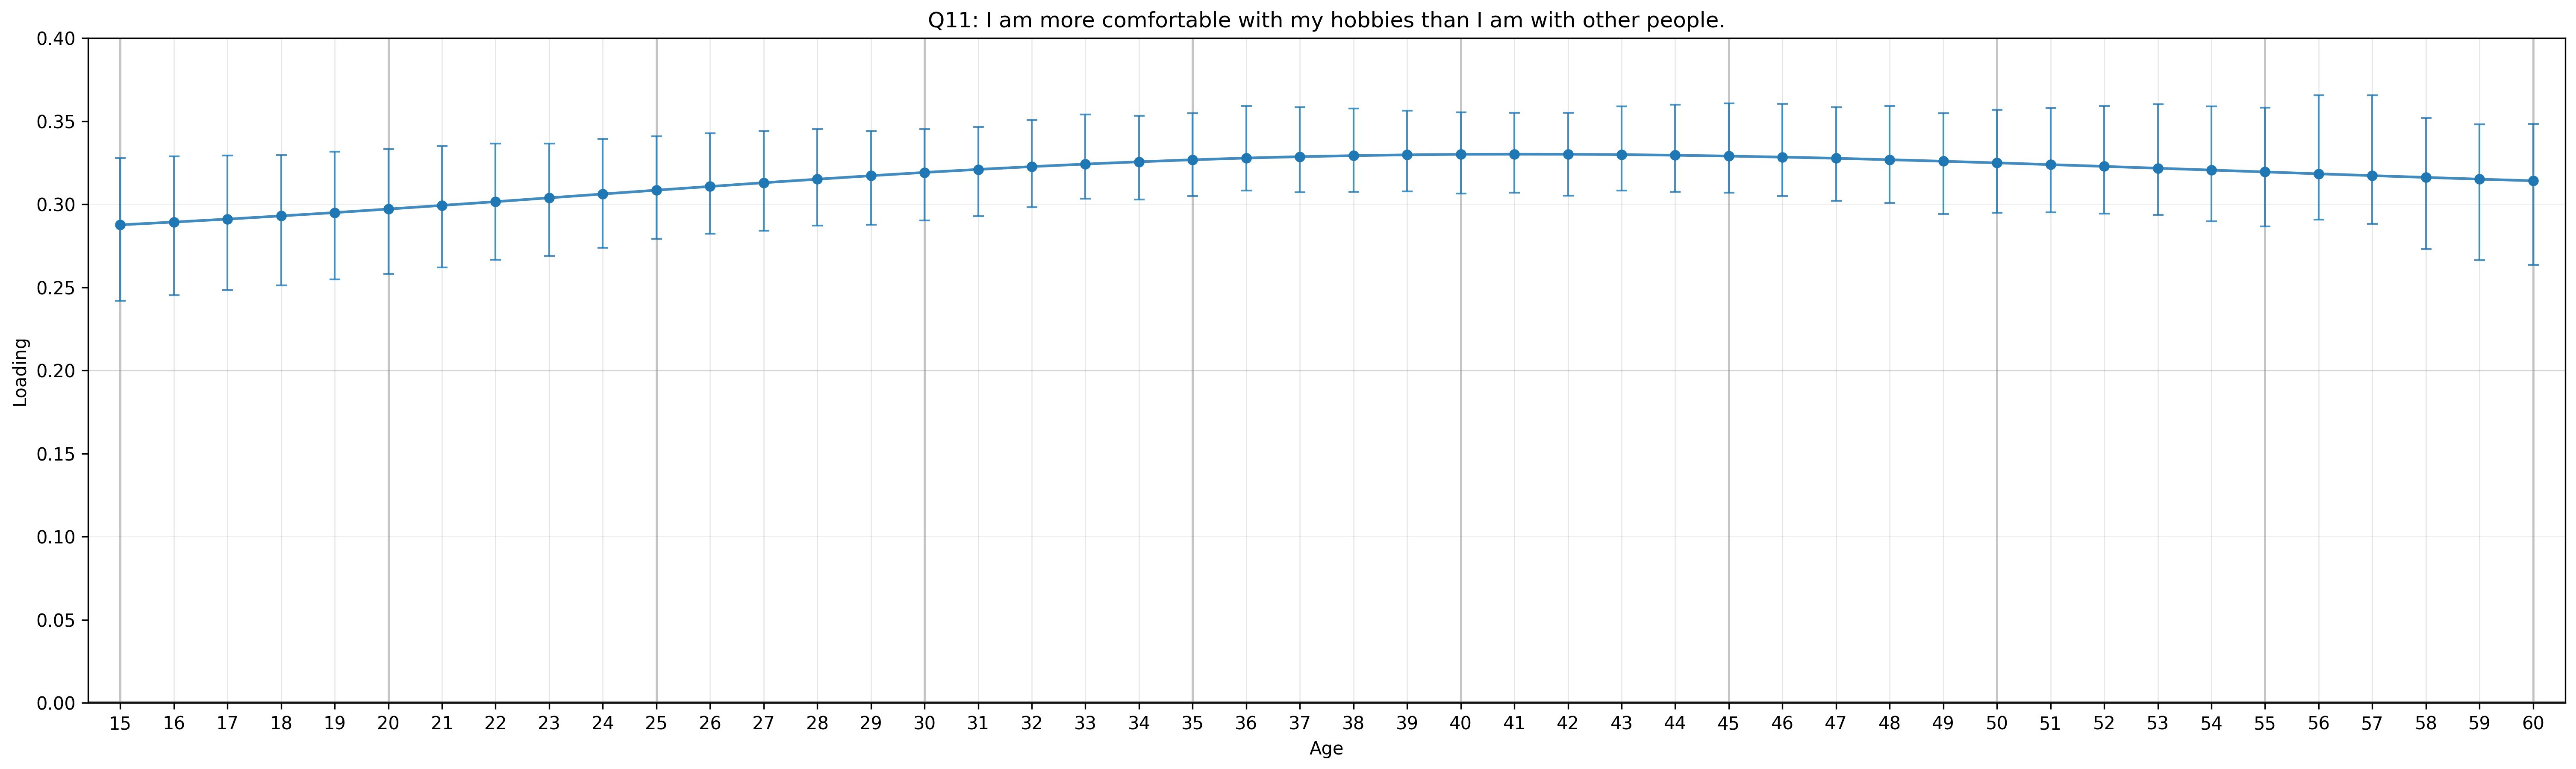
Q12: I spend more time at the library than any other public place. (0.47)
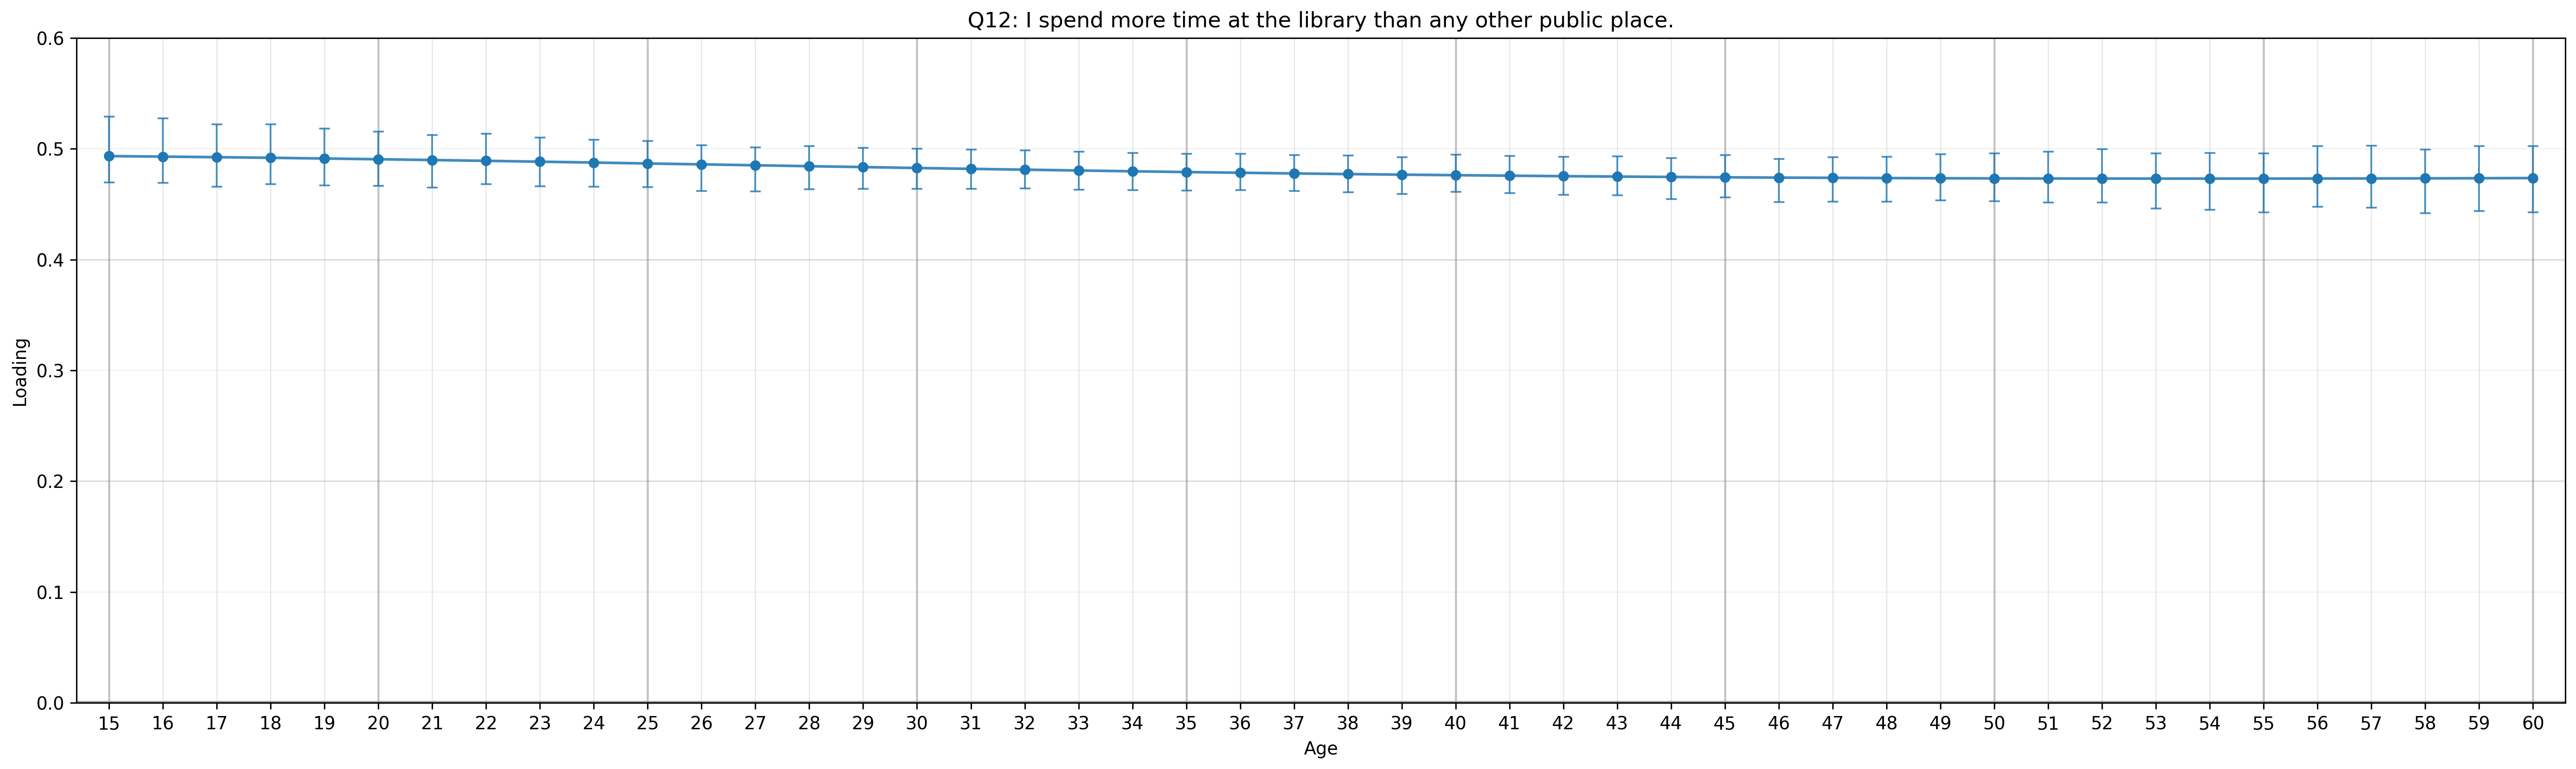
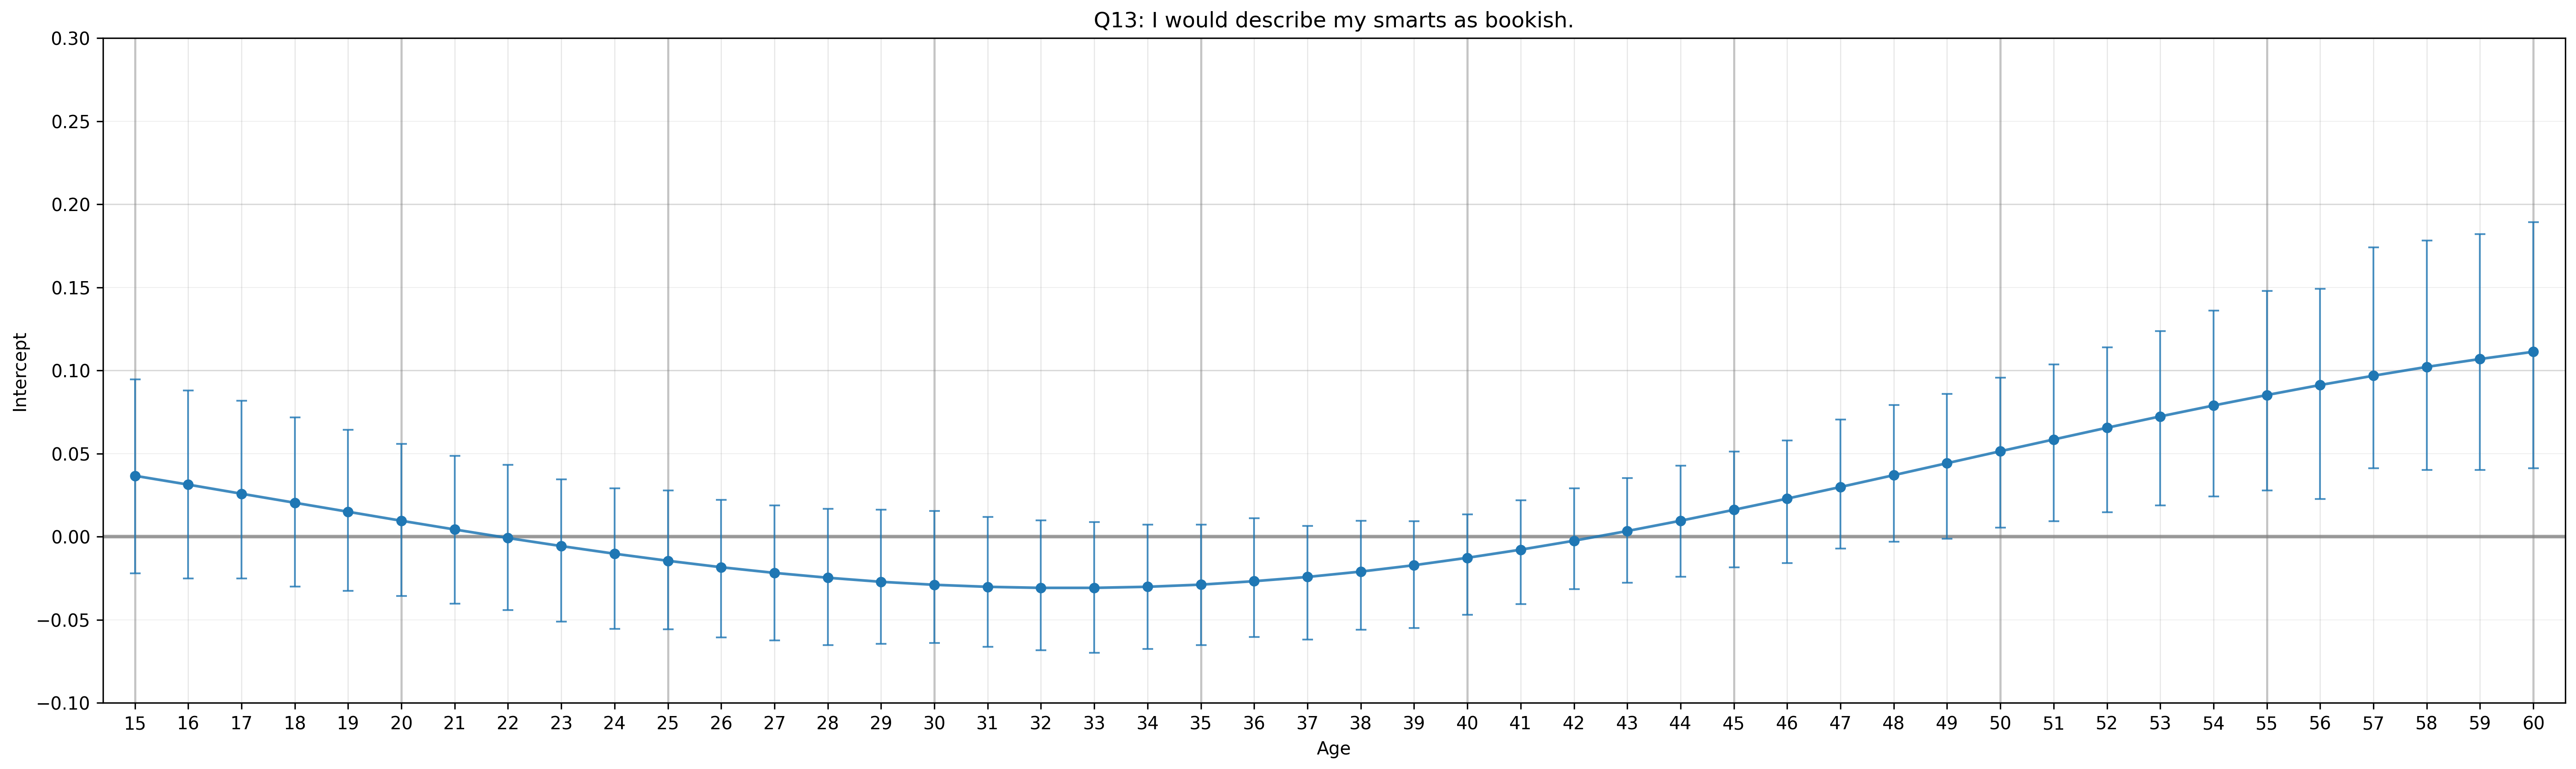
Q13: I would describe my smarts as bookish. (0.56)
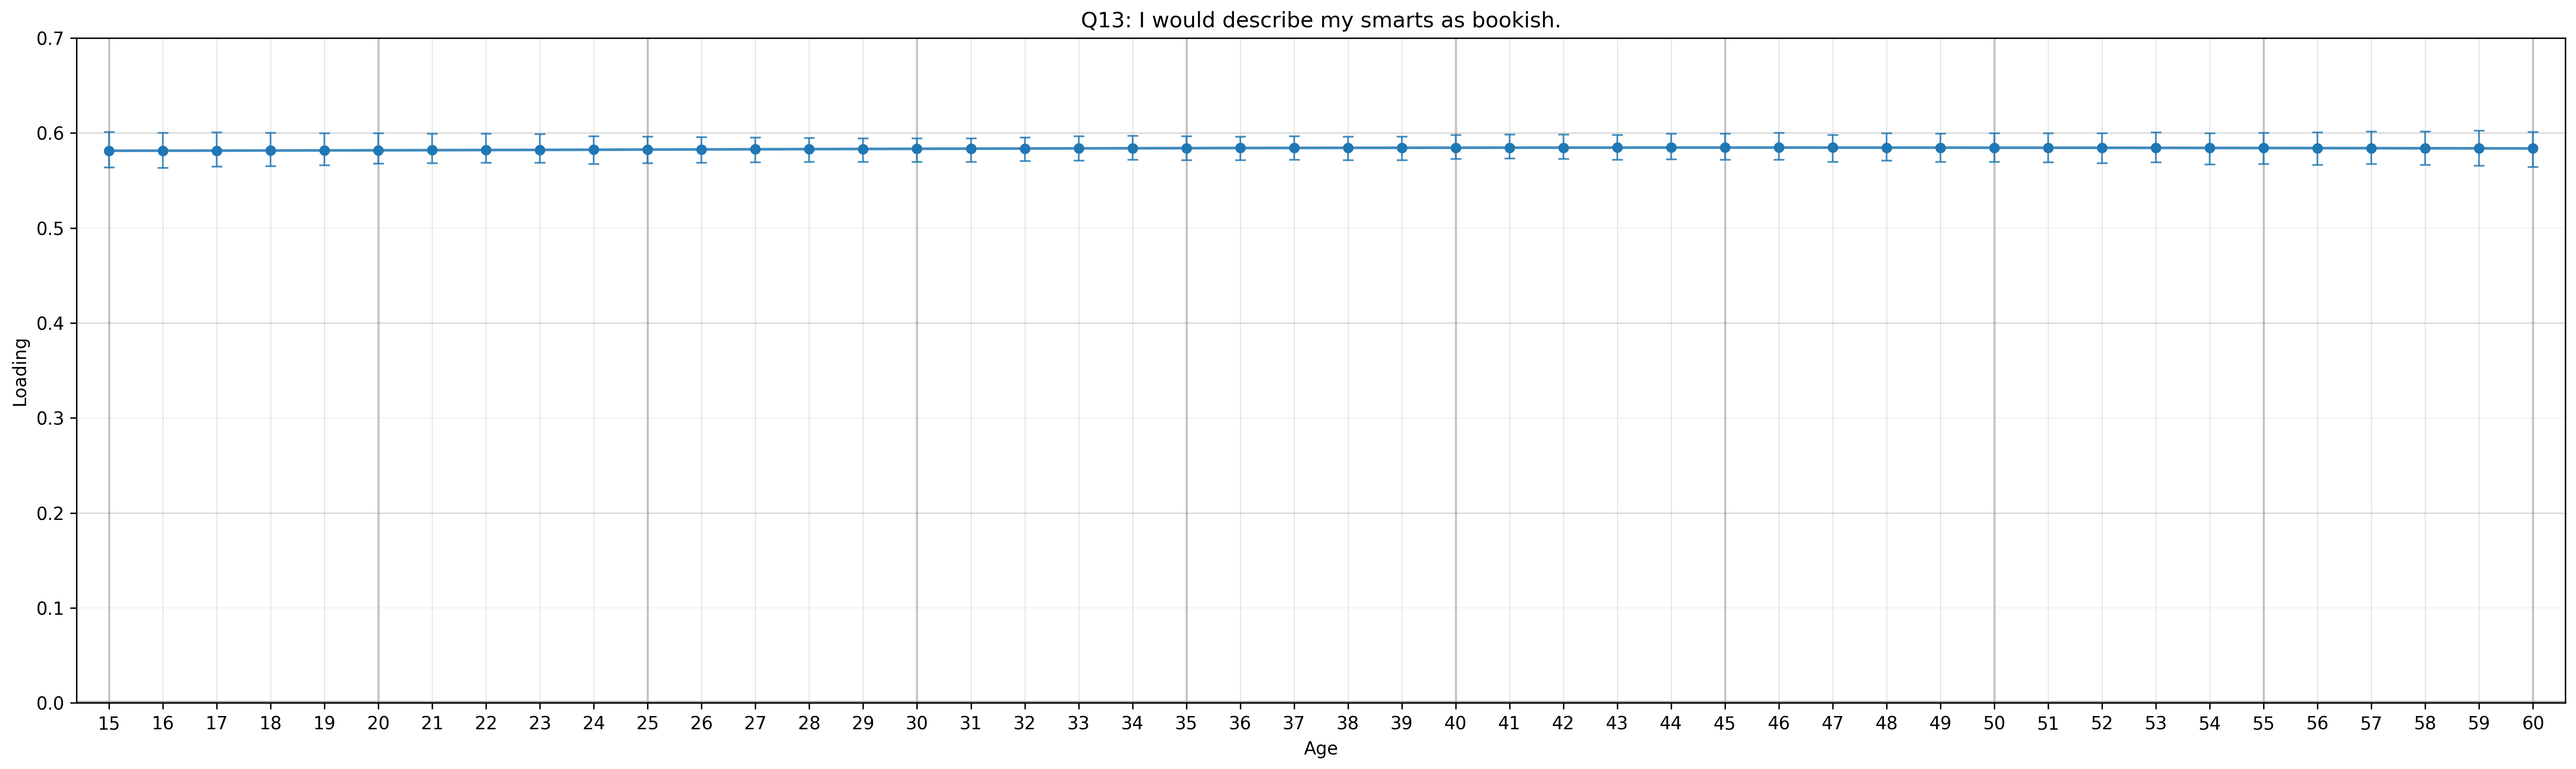
Q14: I like to read technology news reports. (0.47)
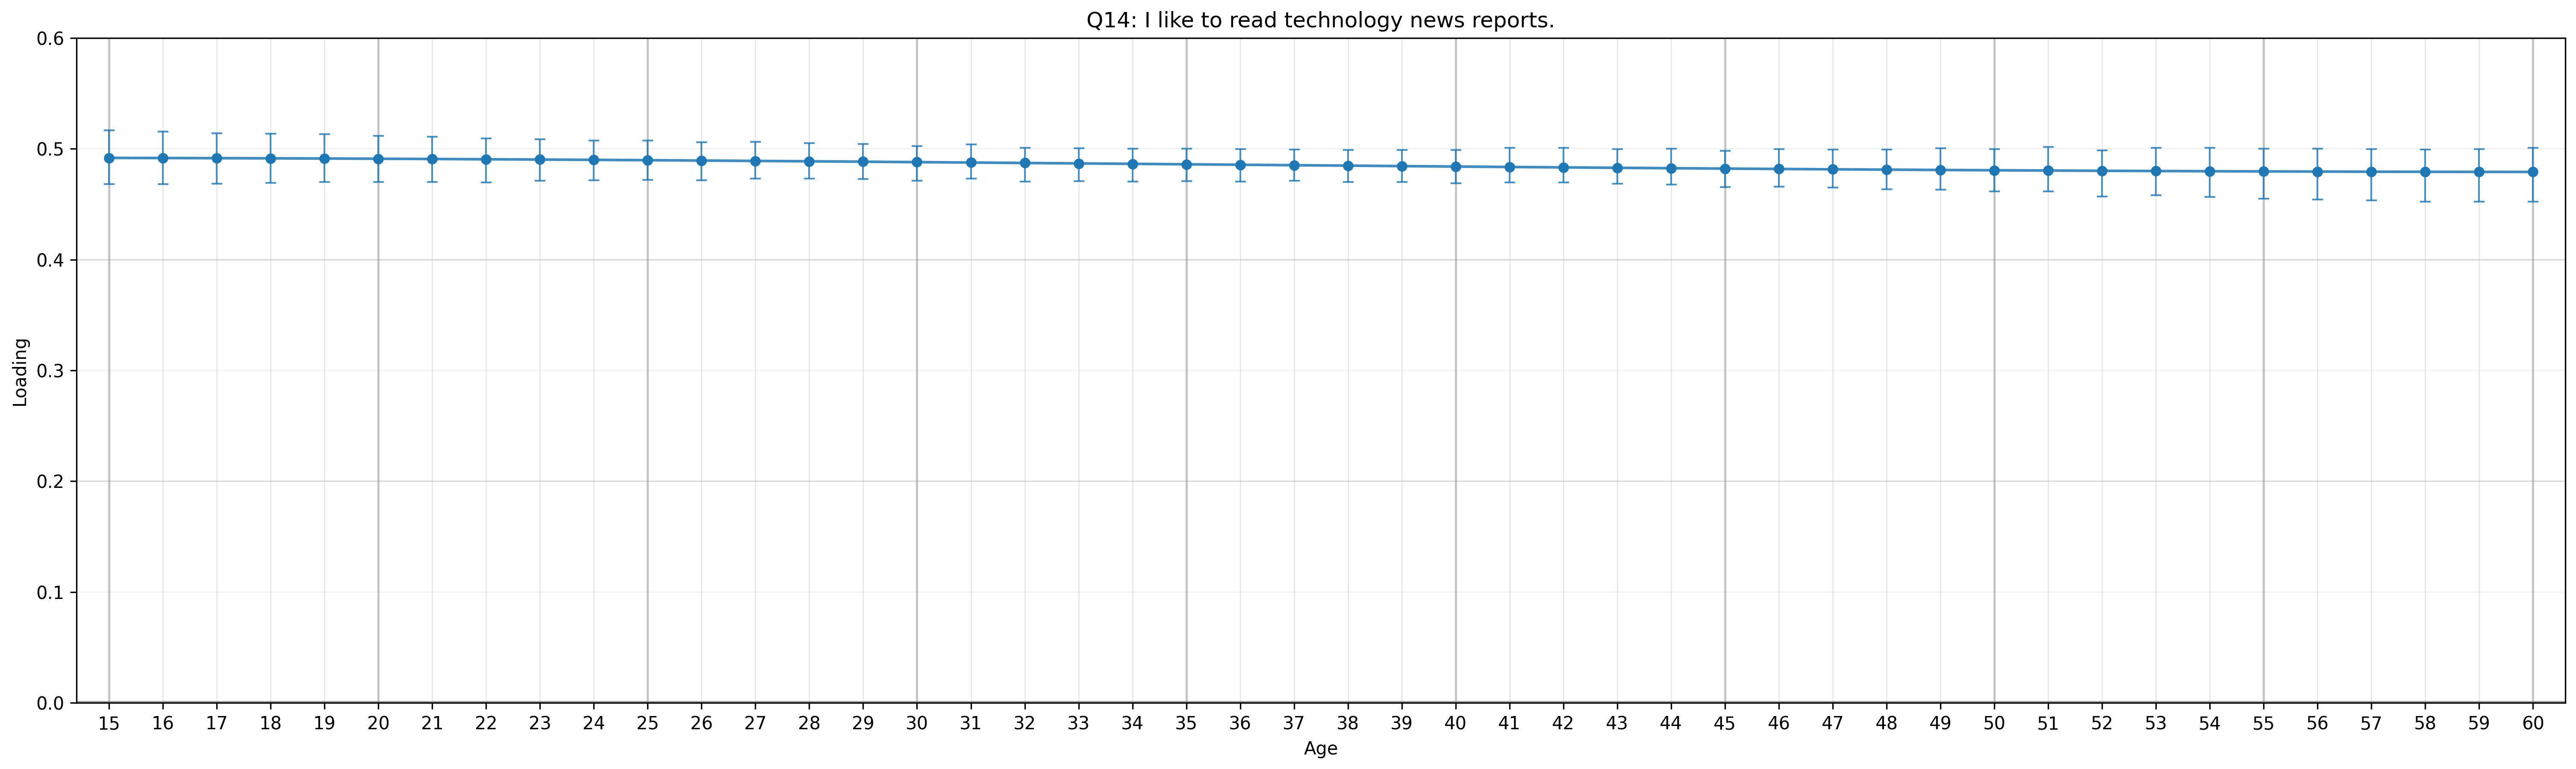
Q15: I have started writing a novel. (0.28)
Q16: I gravitate towards introspection. (0.39)
Q17: I am more comfortable interacting online than in person. (0.54)
Q18: I love to read challenging material. (0.30)
Q19: I have played a lot of video games. (0.22)
Q20: I was a very odd child. (0.50)
Q21: I sometimes prefer fictional people to real ones. (0.35)
Q22: I enjoy learning more than I need to. (0.42)
Q23: I get excited about my ideas and research. (0.47)
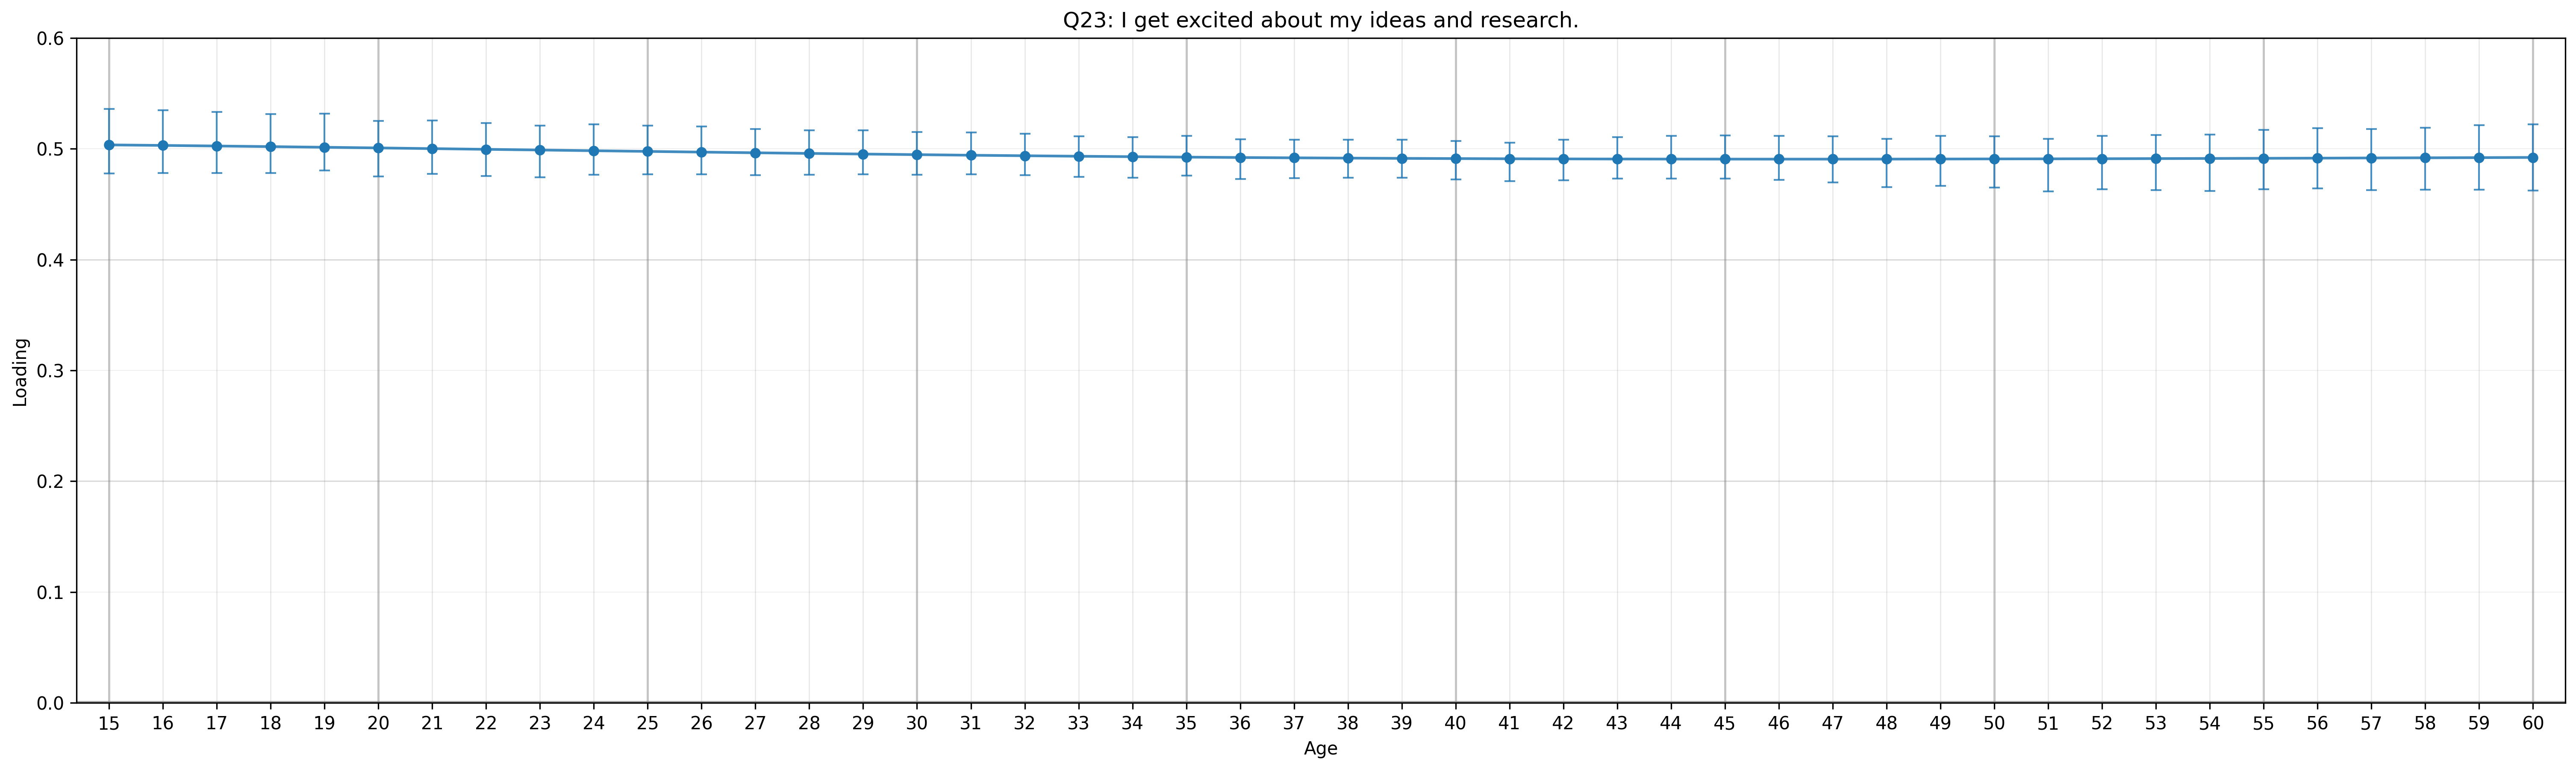
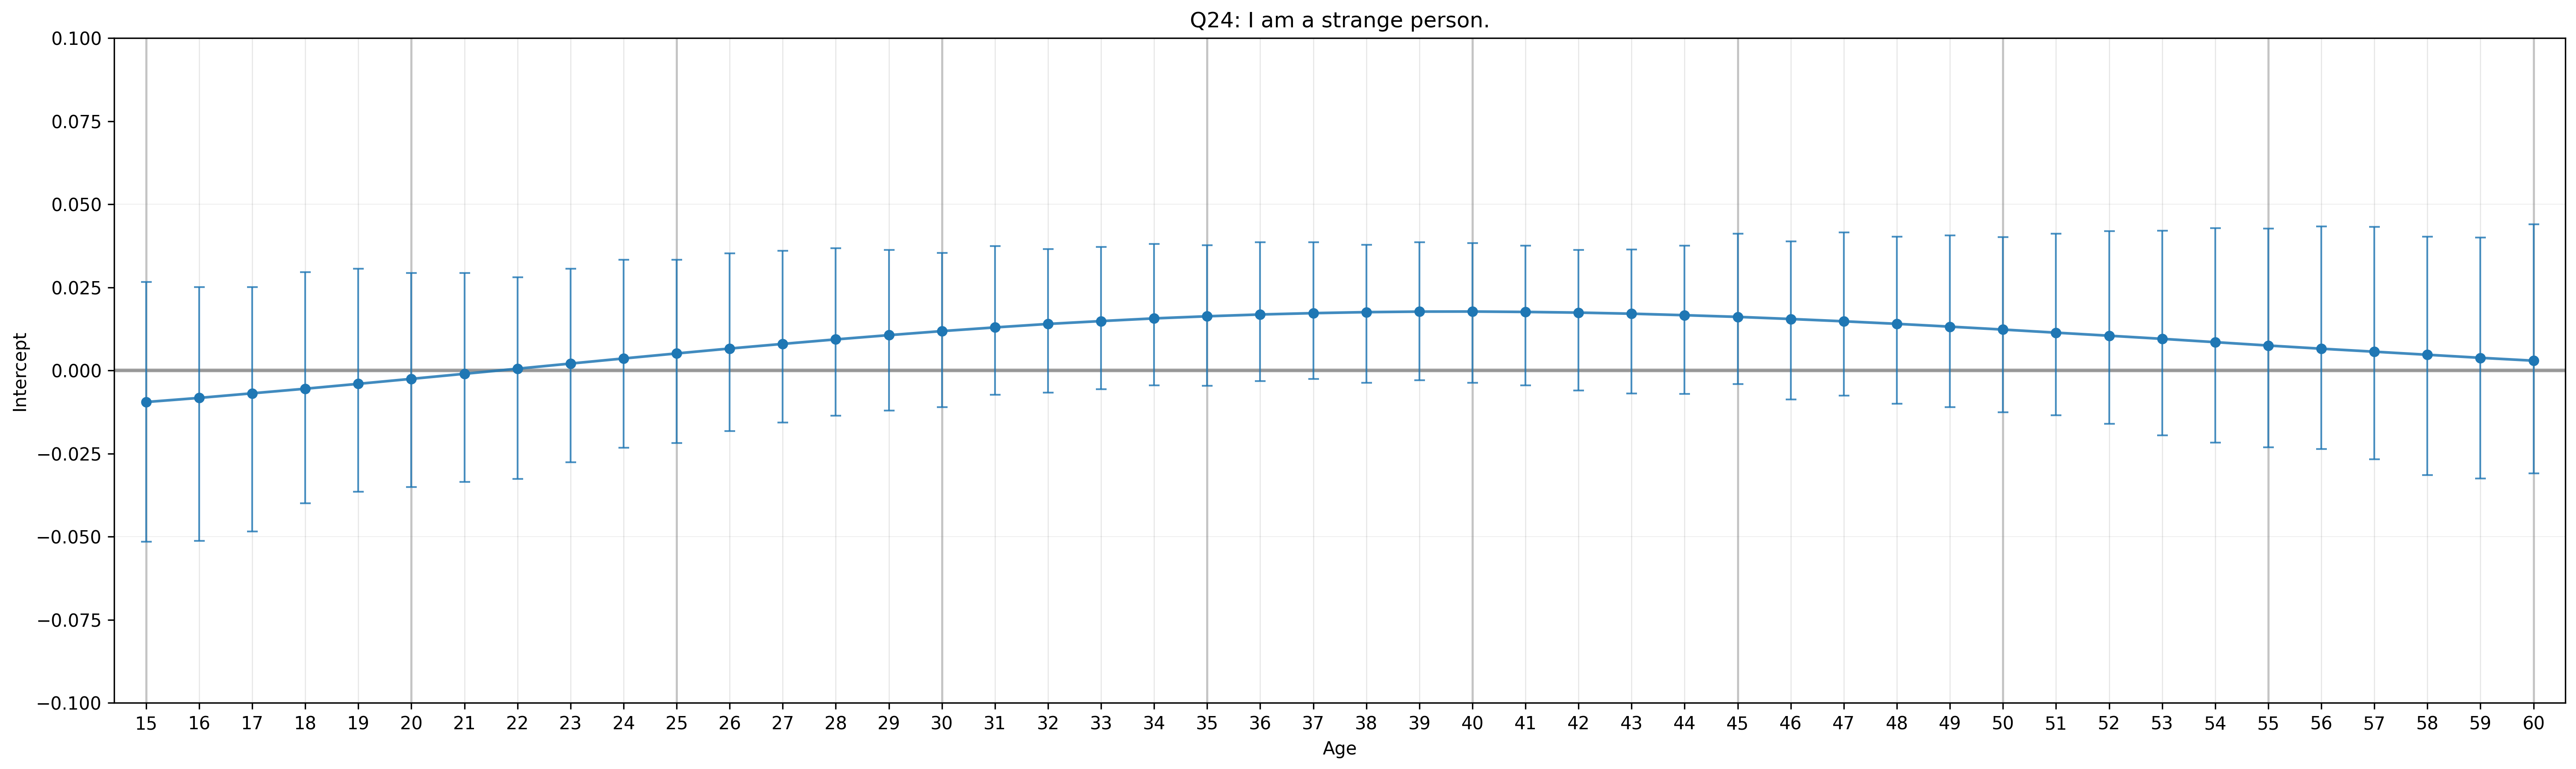
Q24: I am a strange person. (0.55)
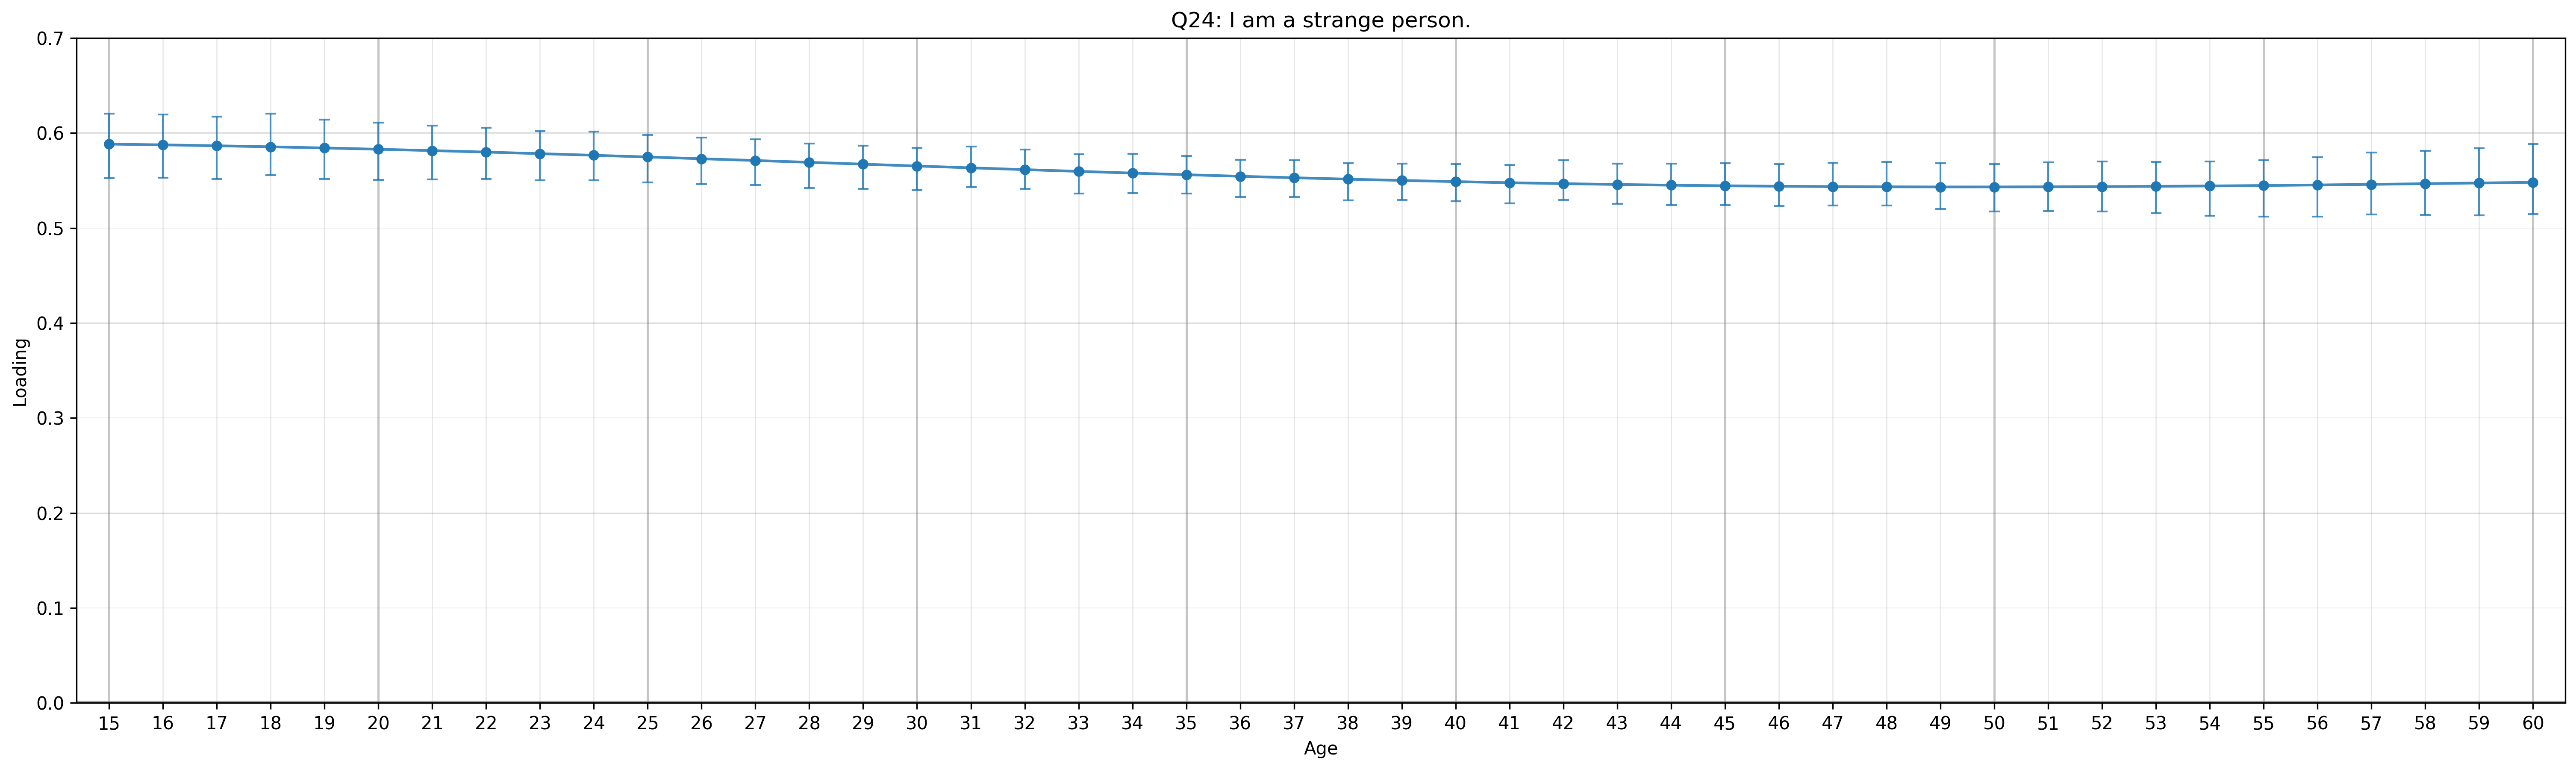
Q25: I care about super heroes. (0.38)
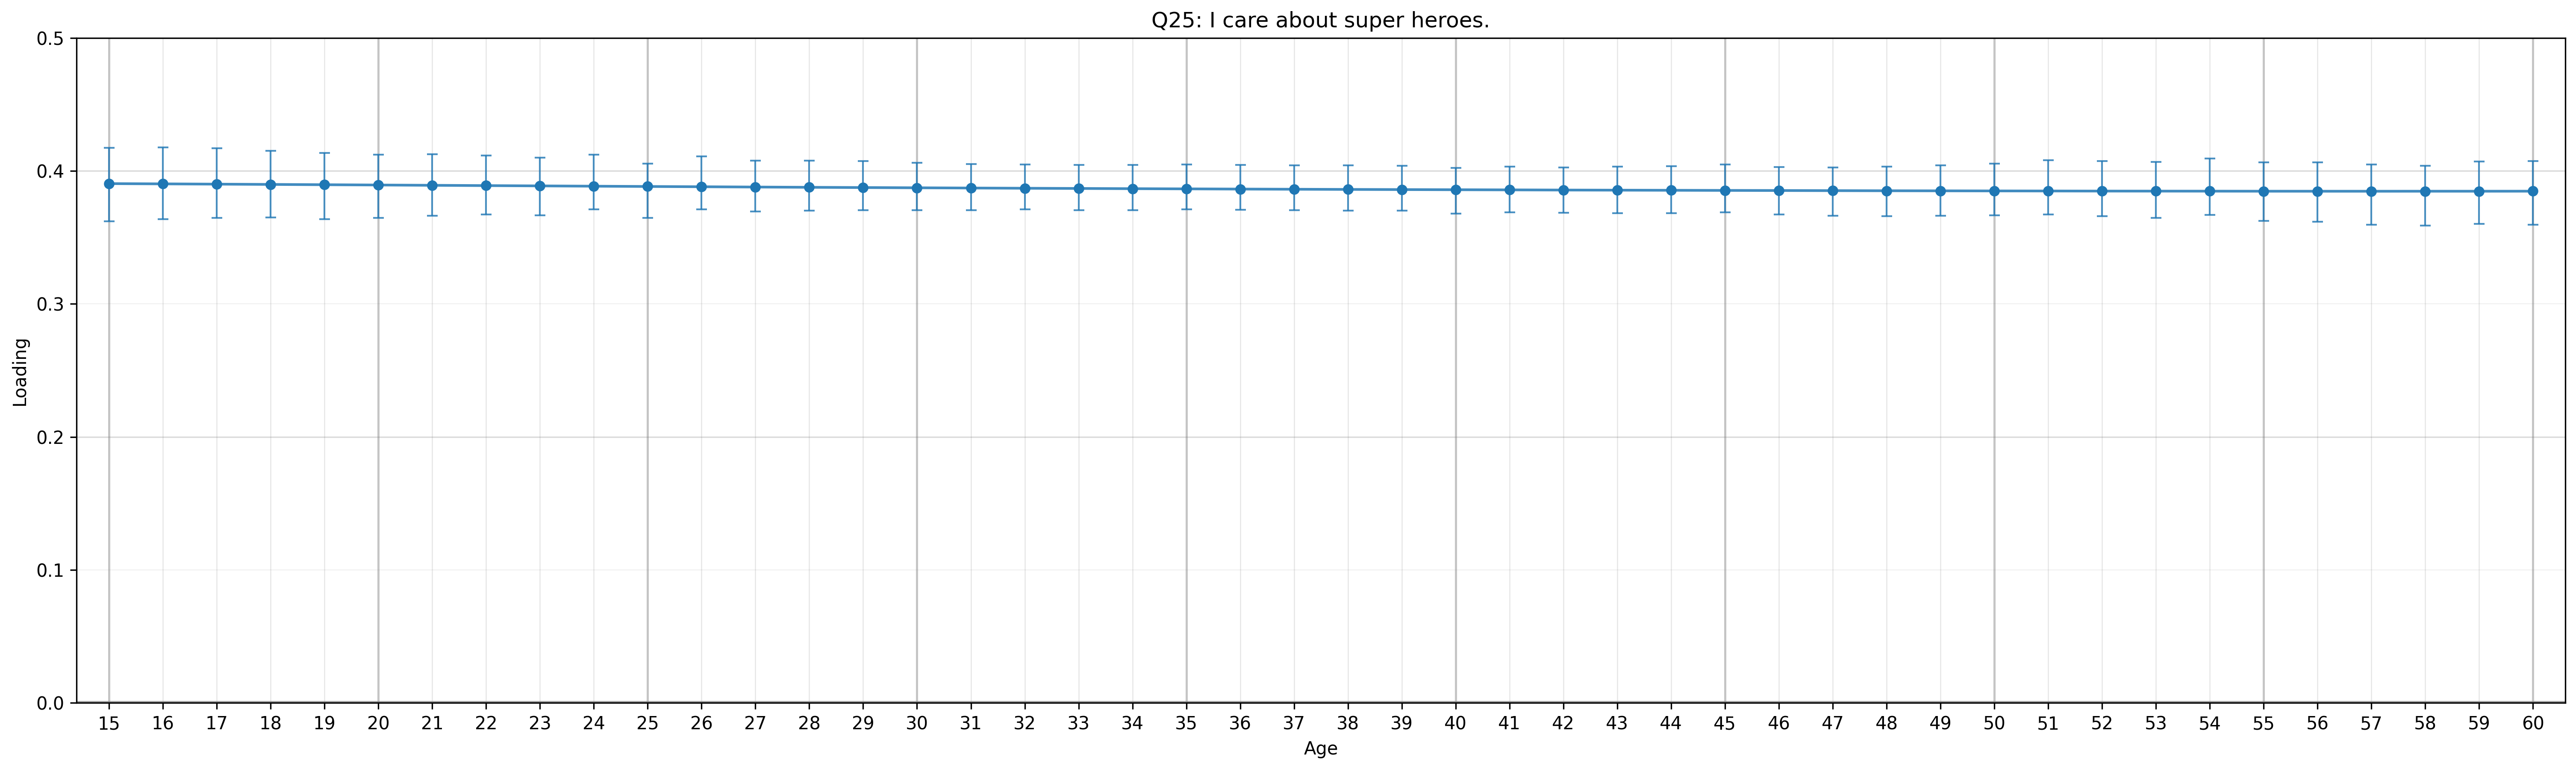
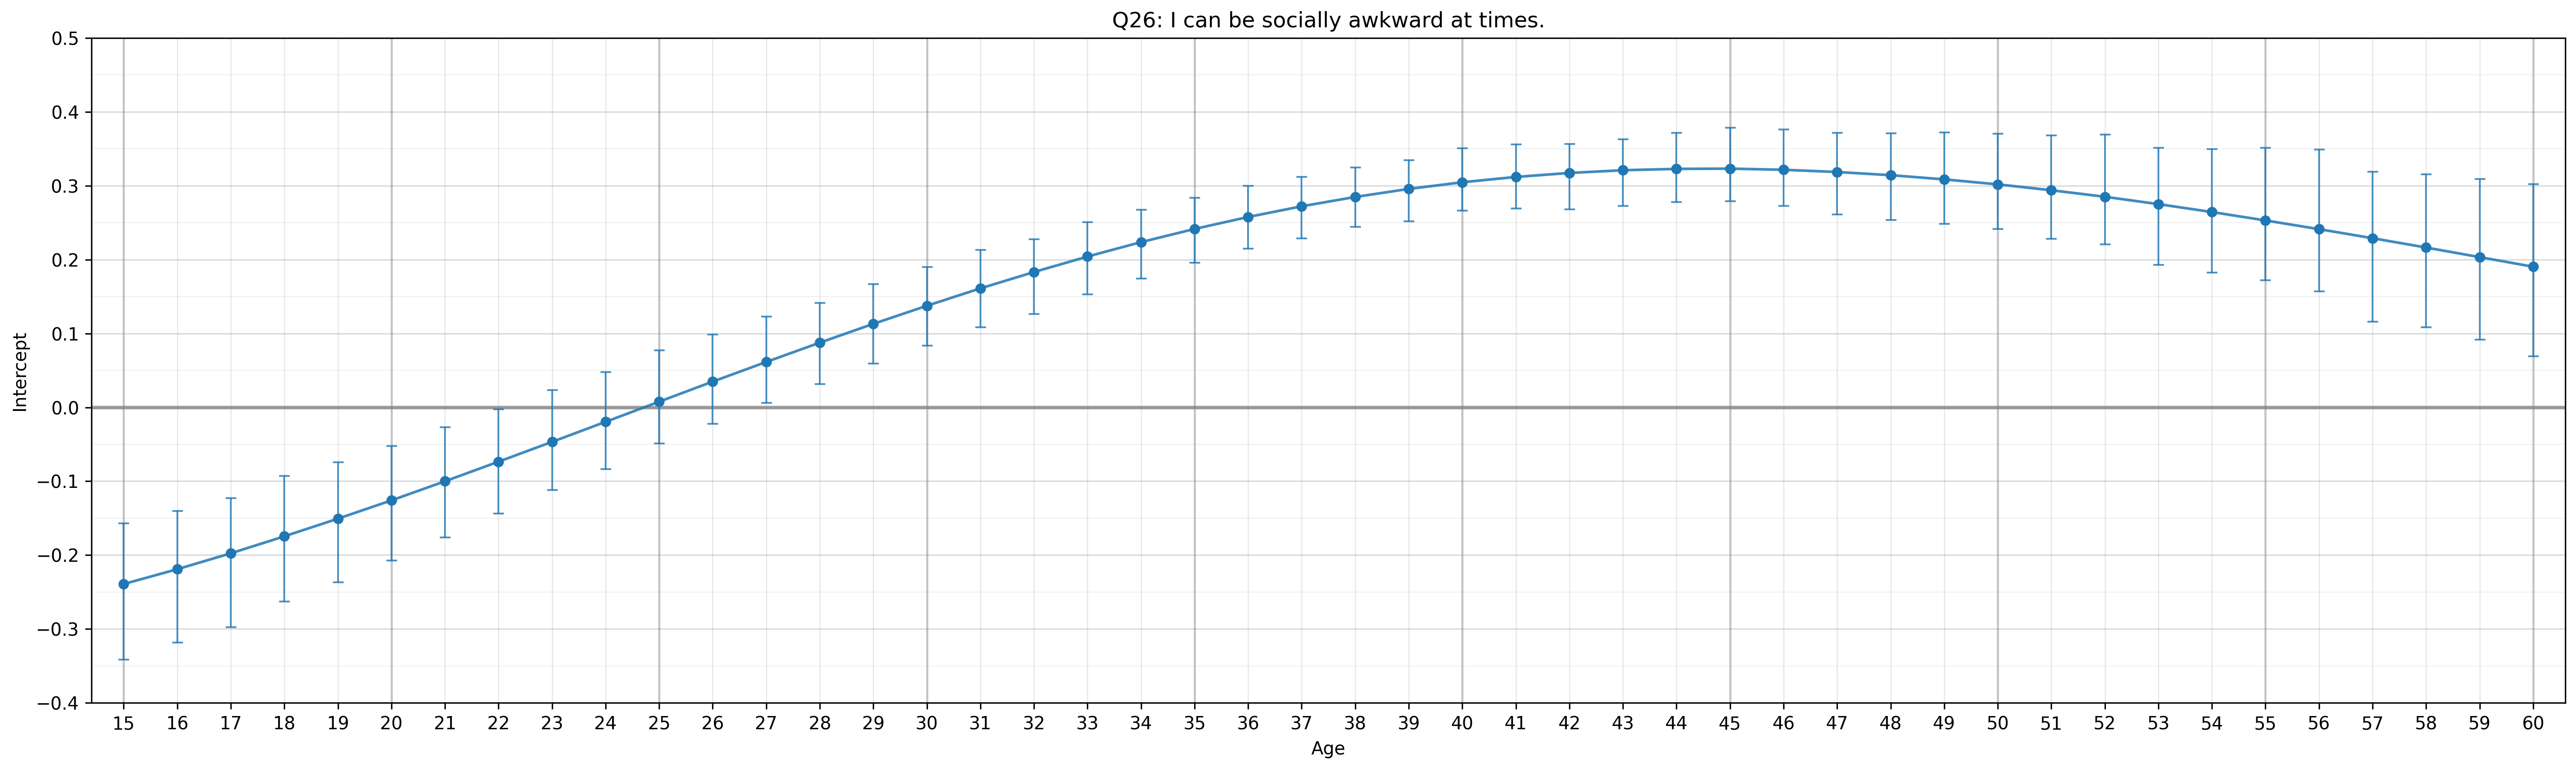
Q26: I can be socially awkward at times. (0.57)
Intercepts by Age
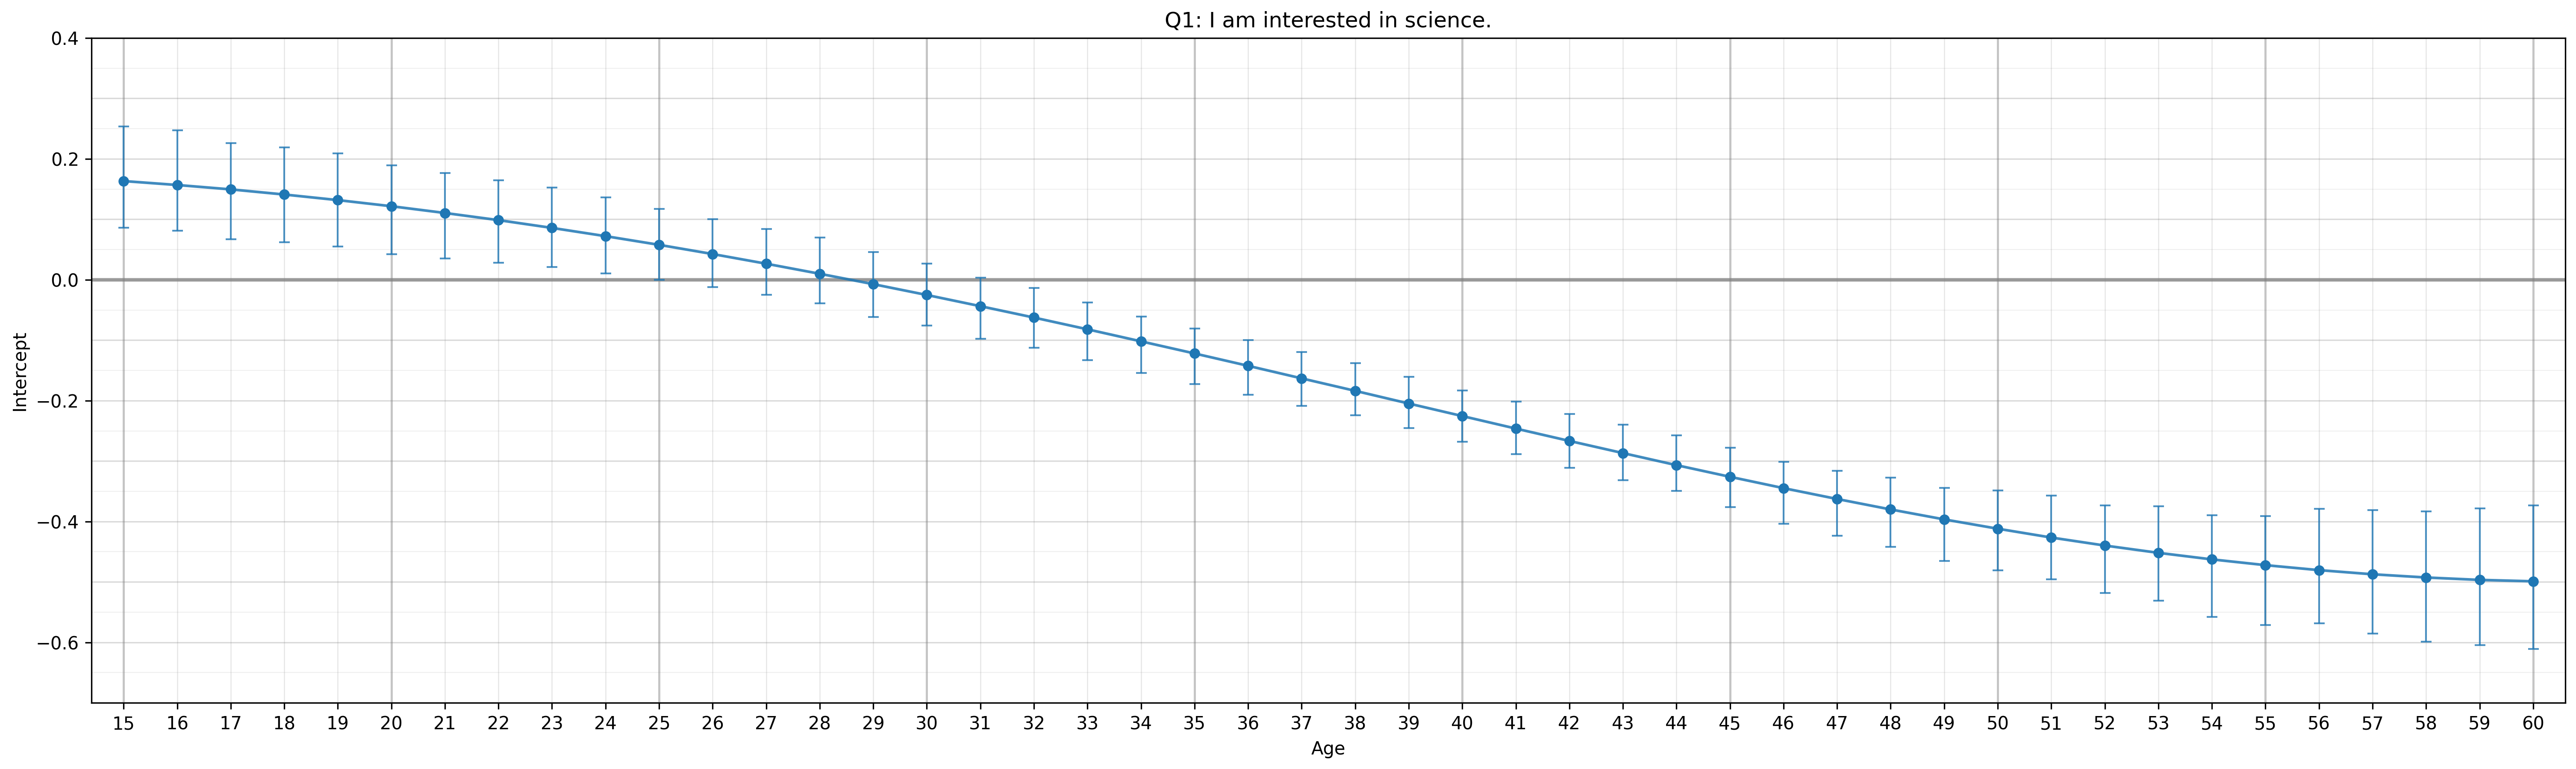
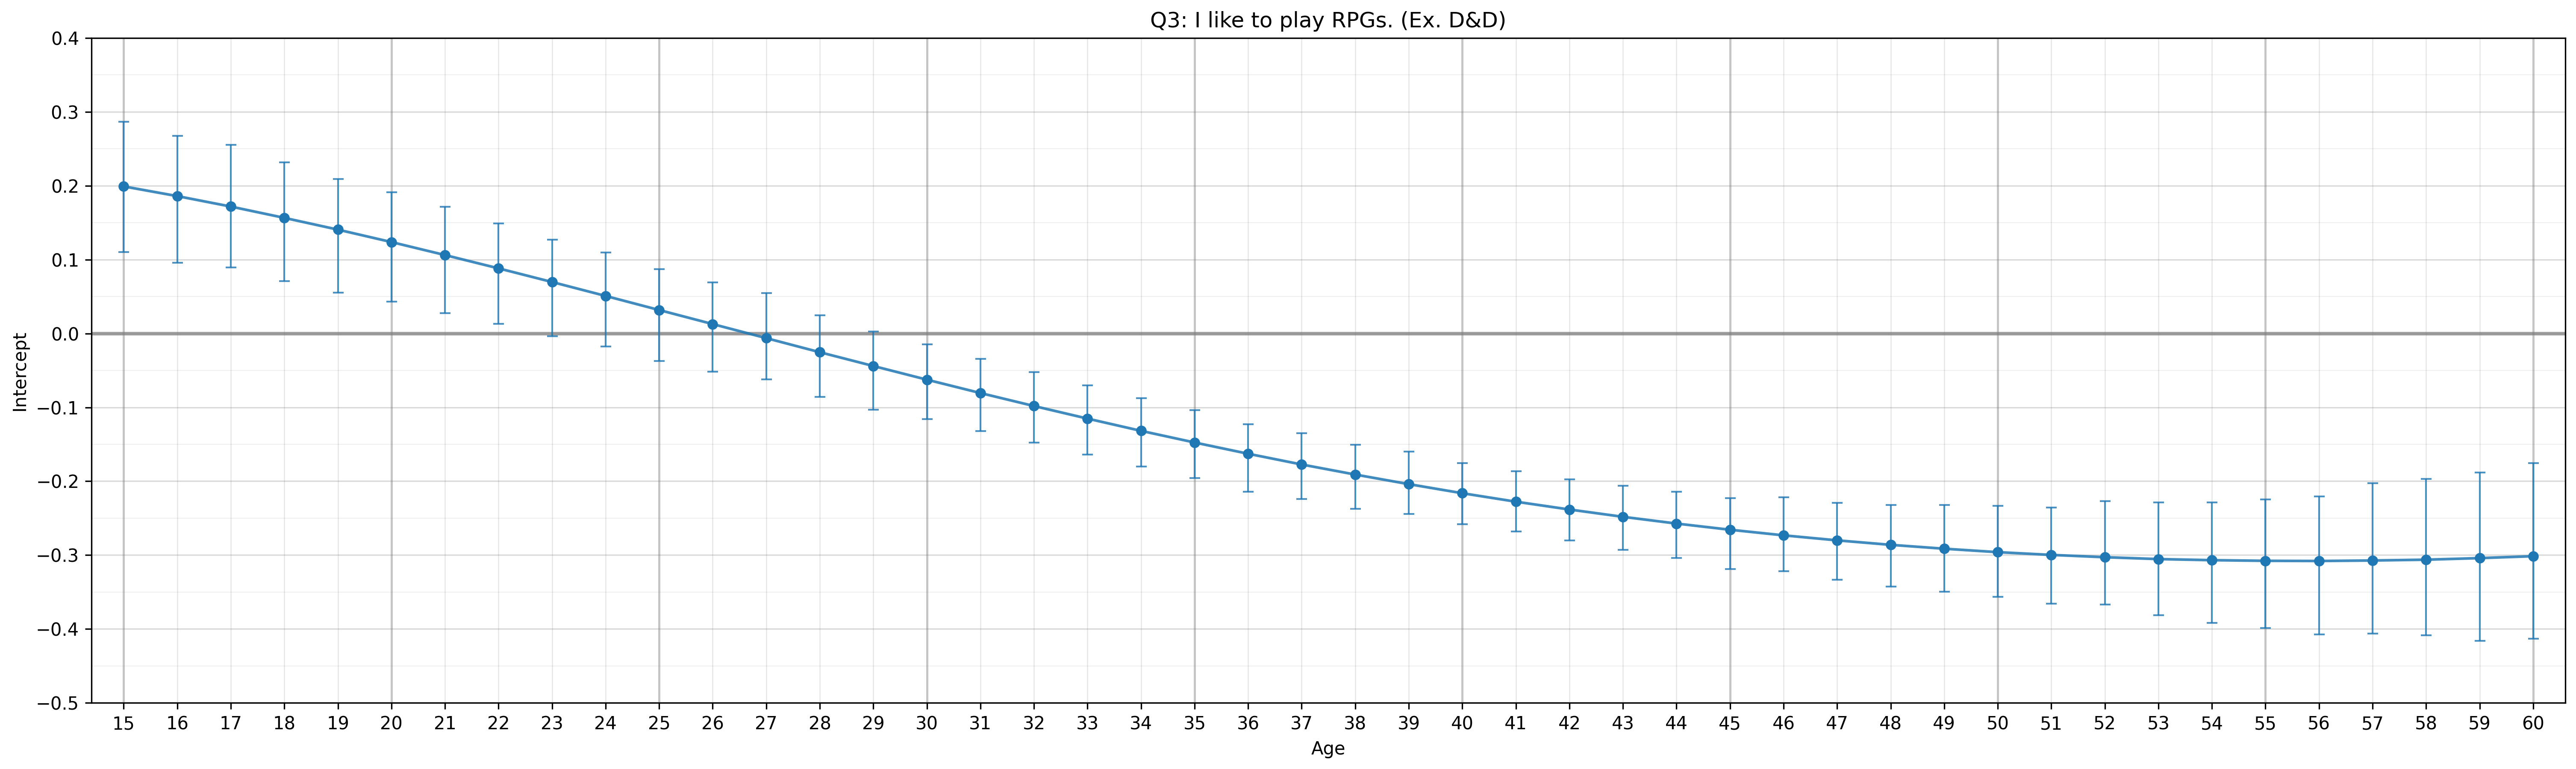
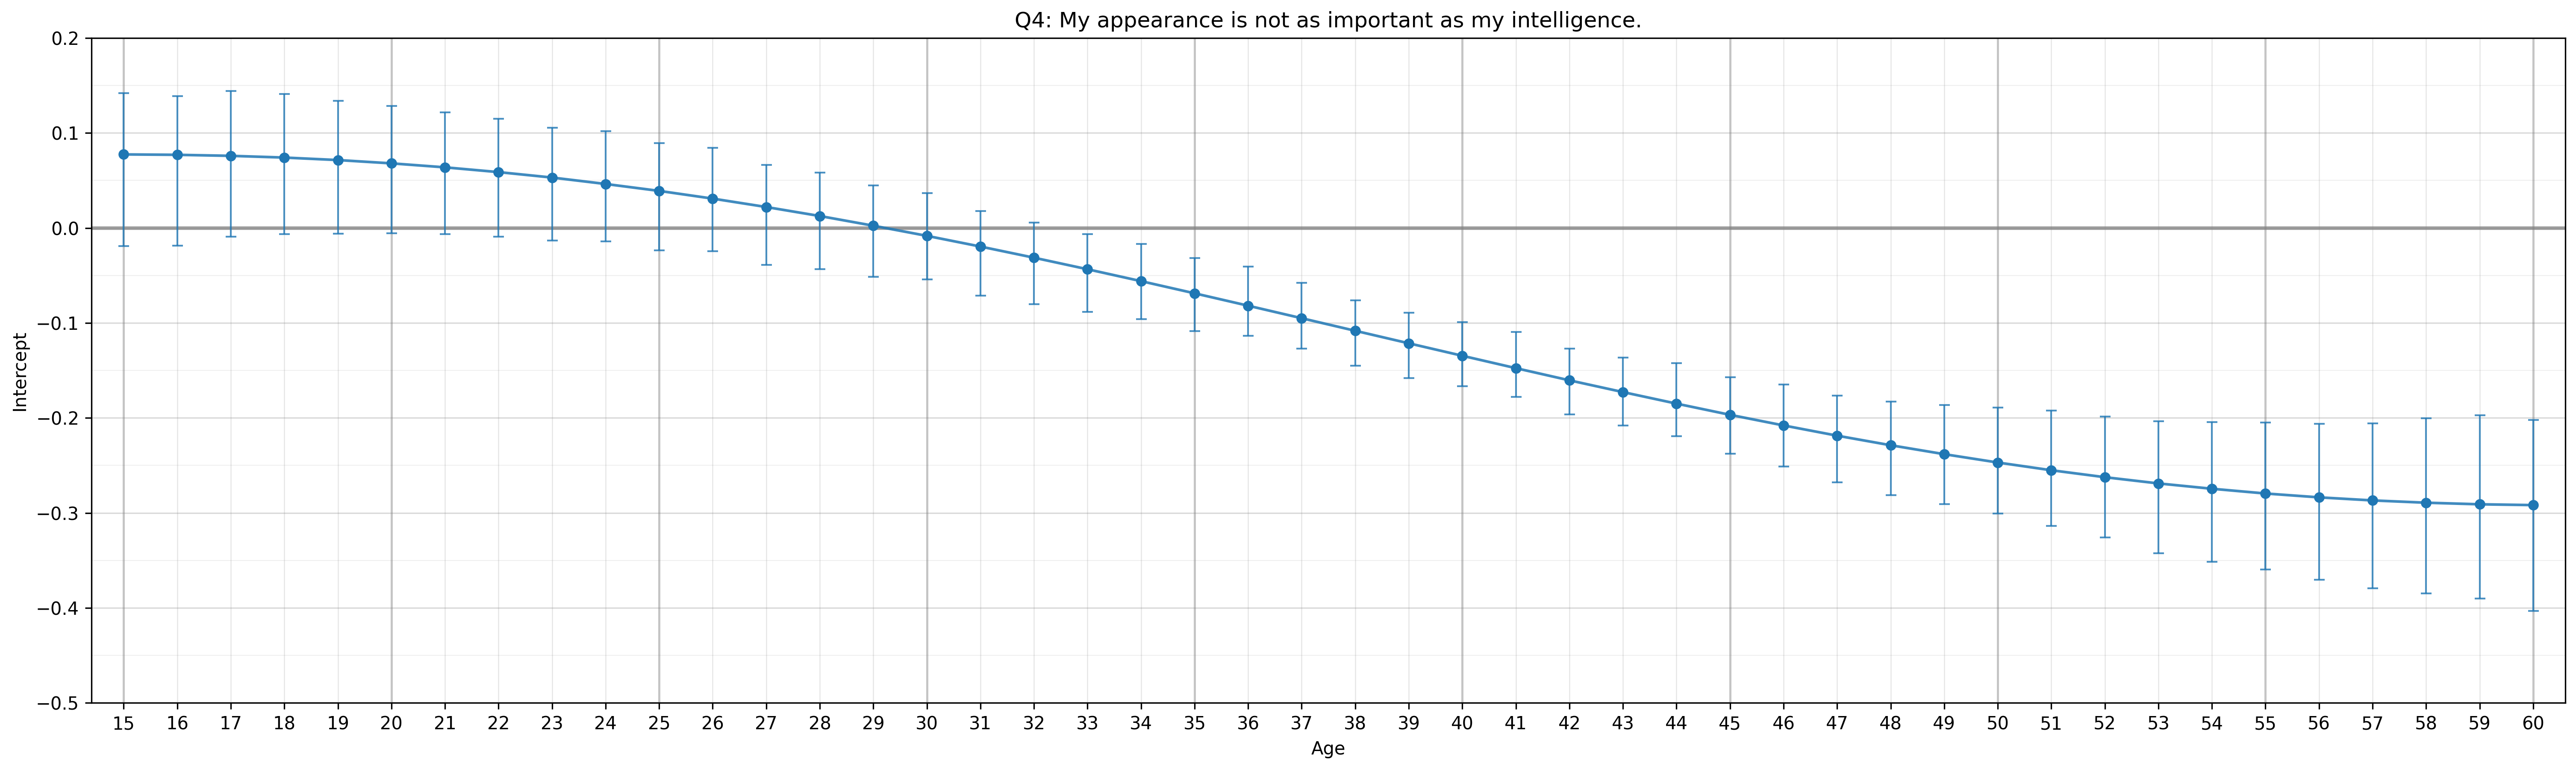
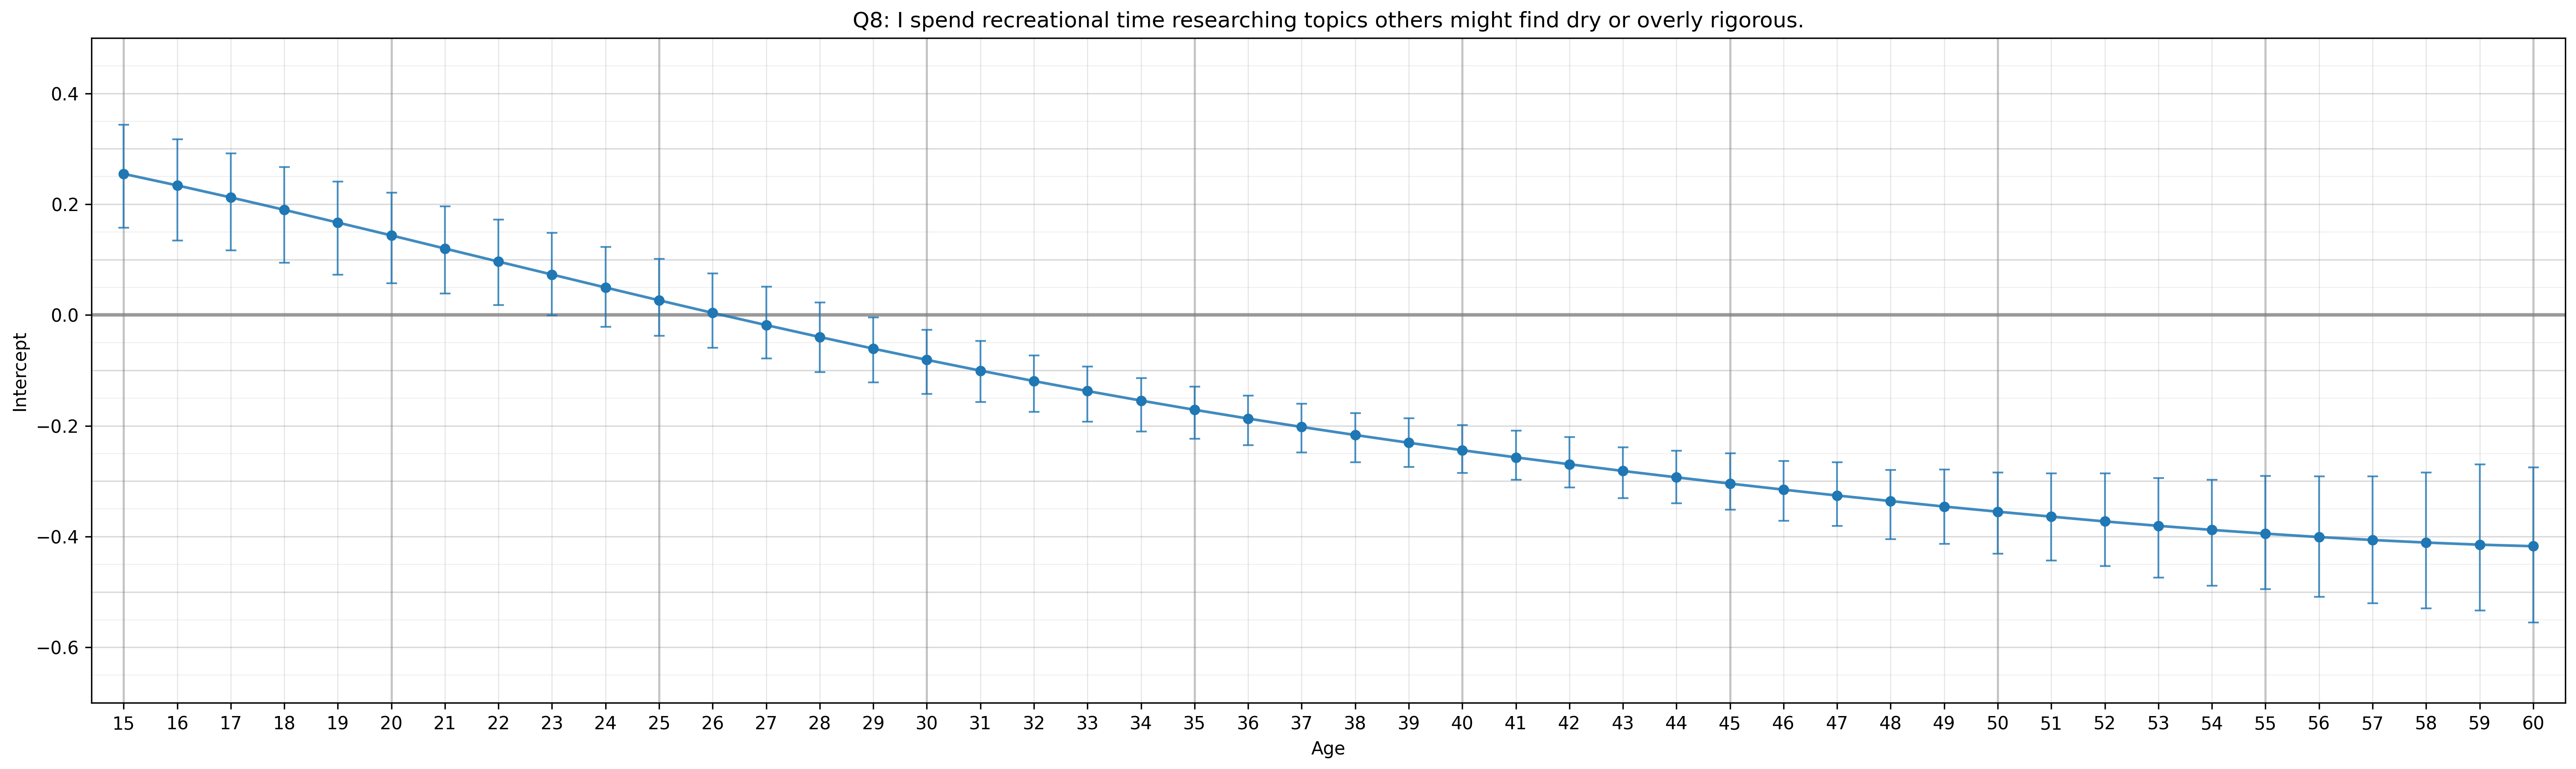
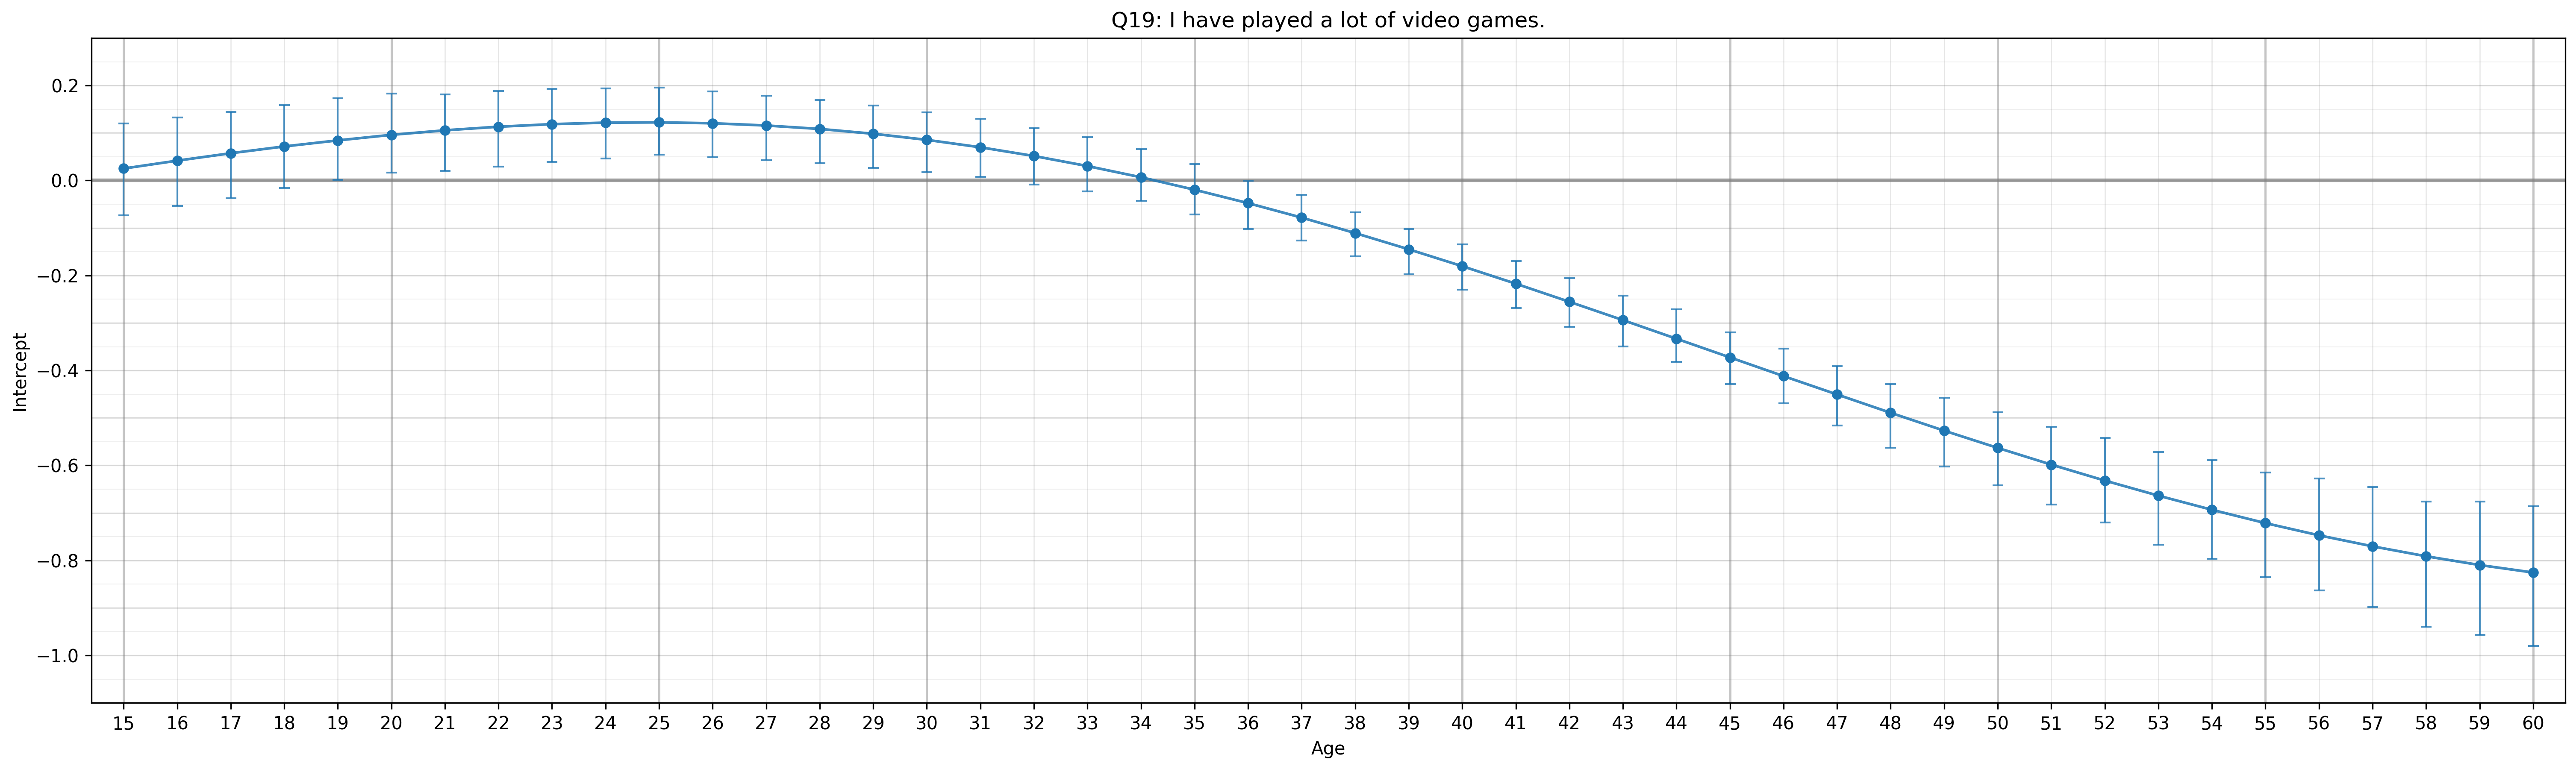
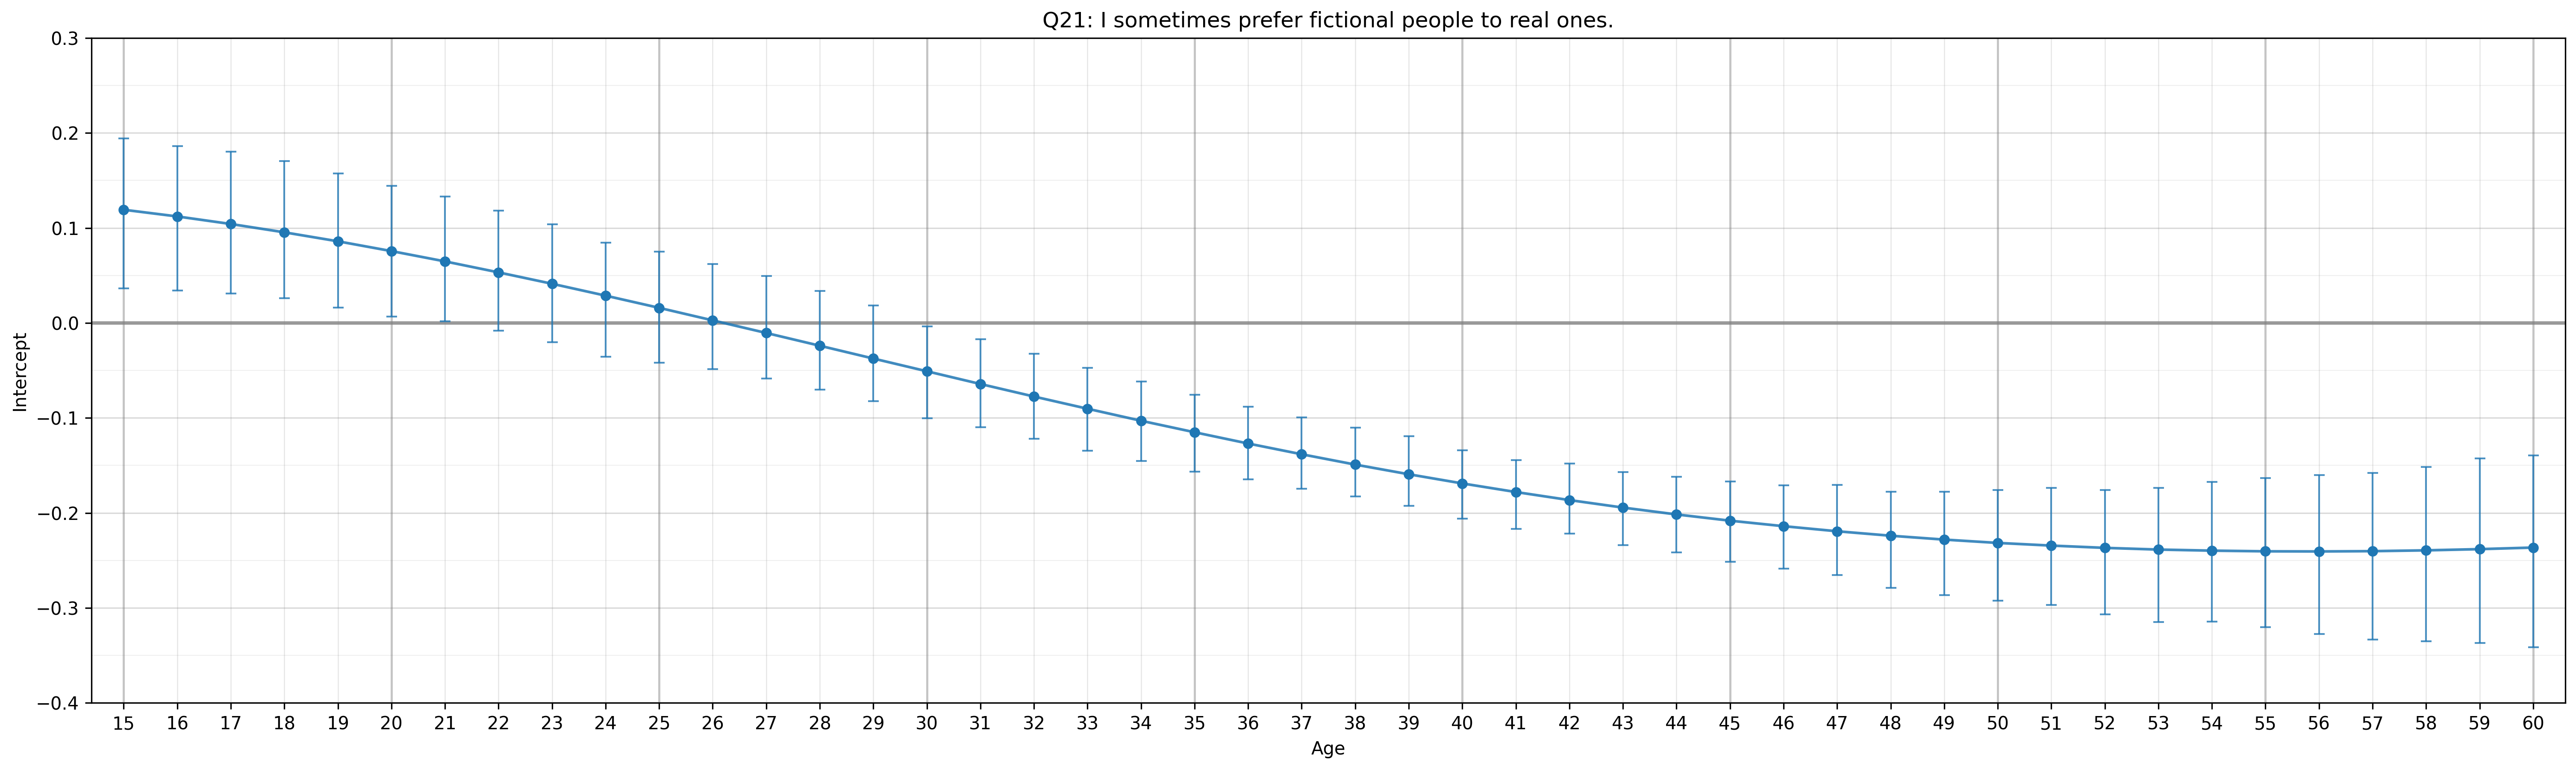
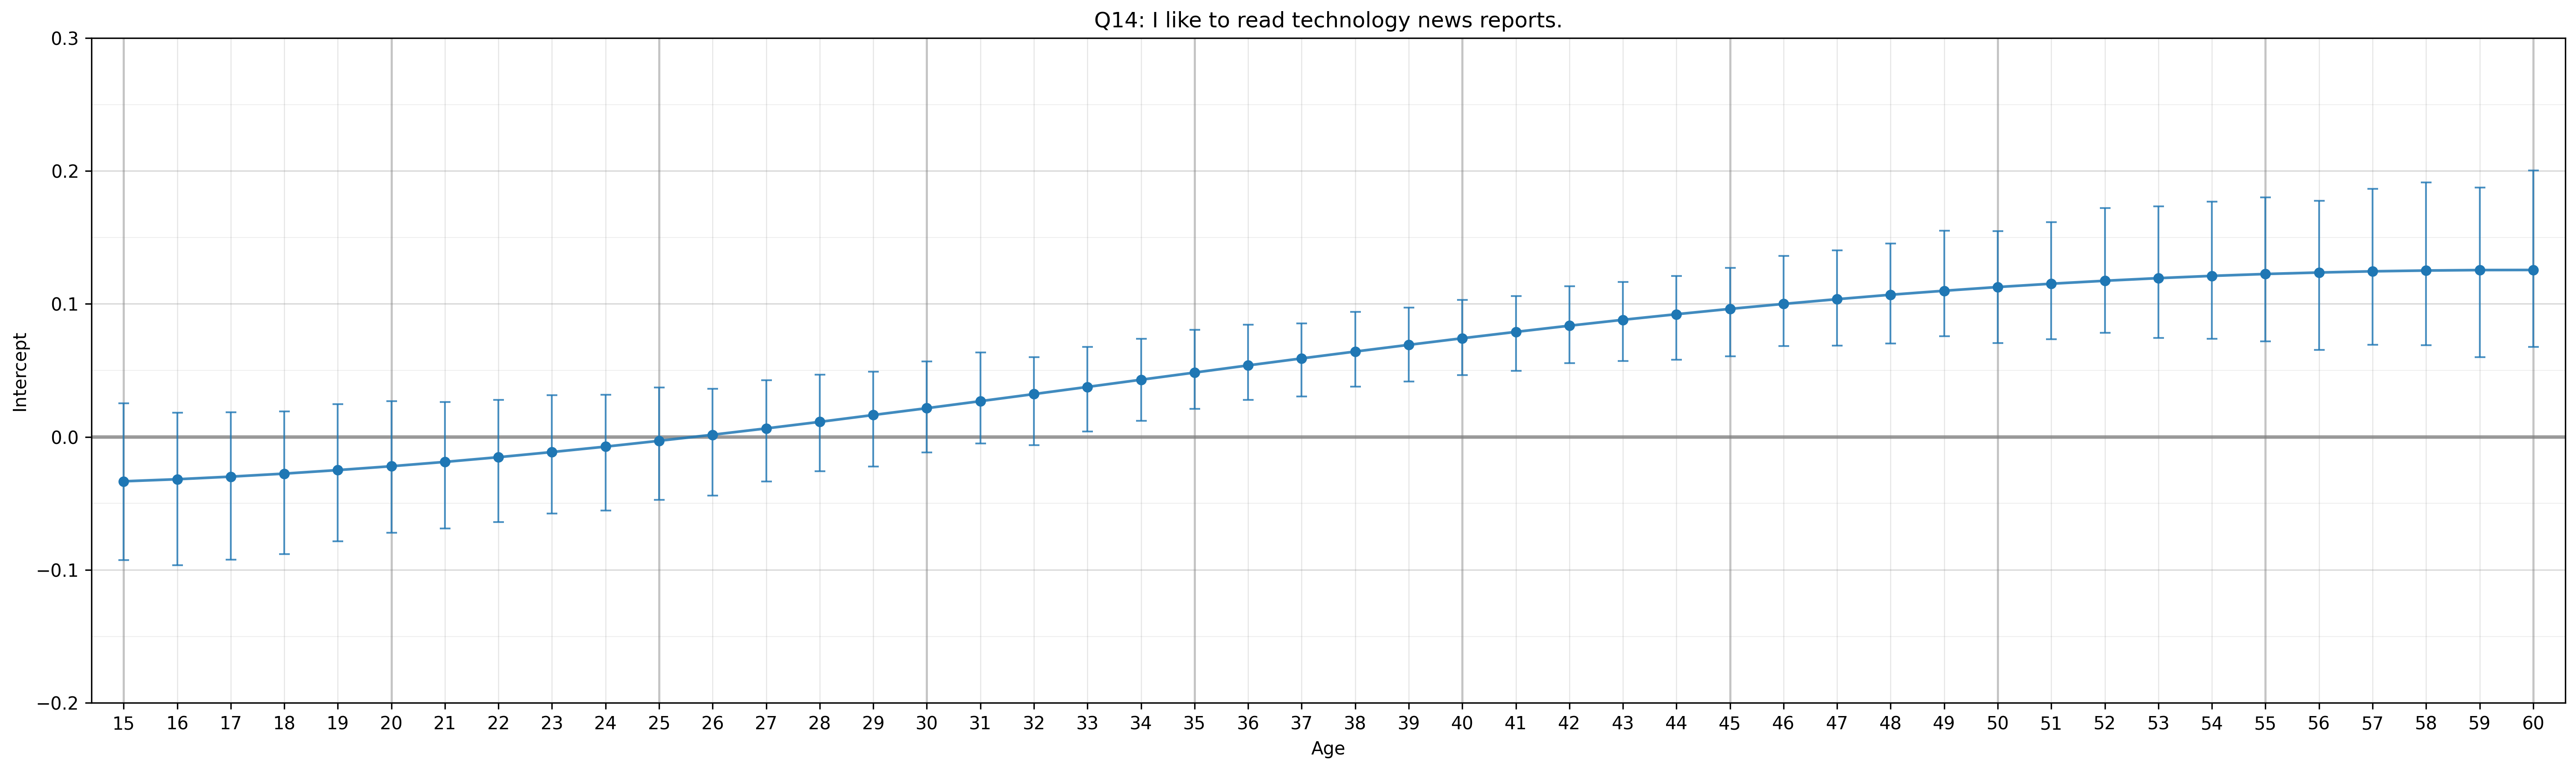
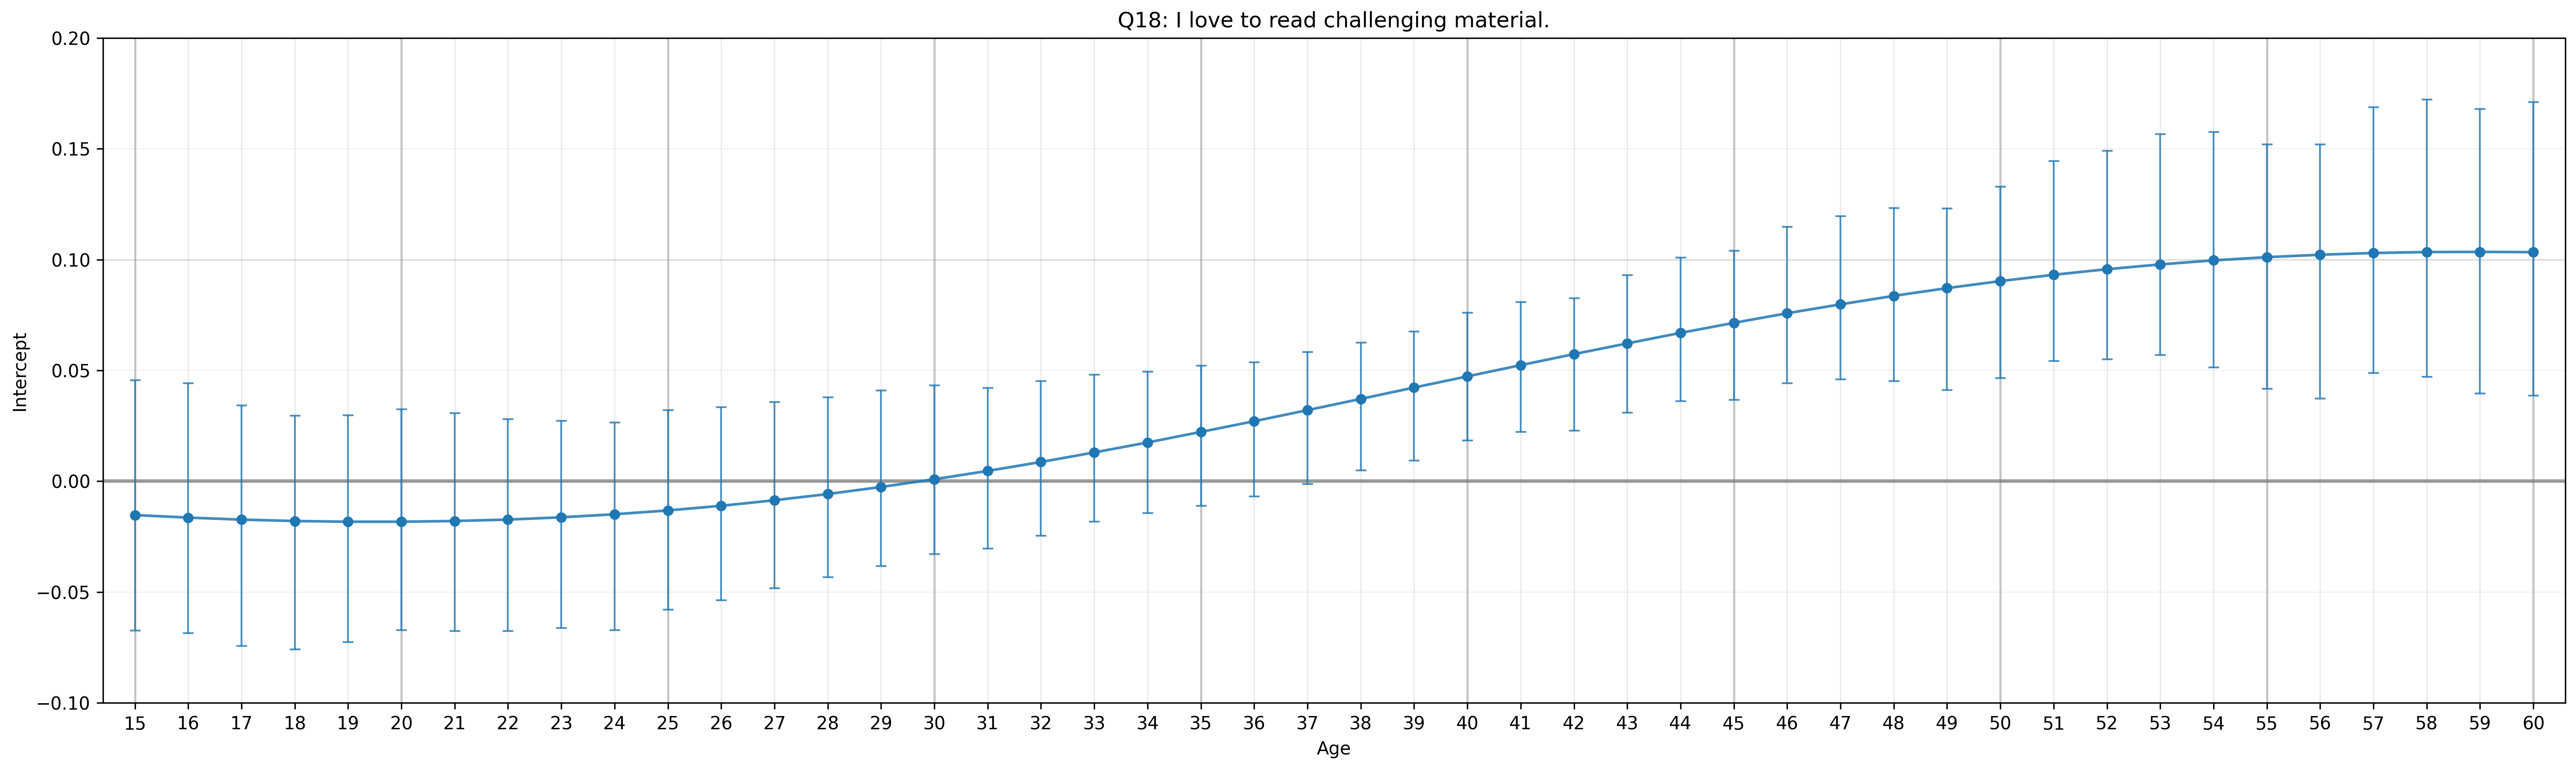
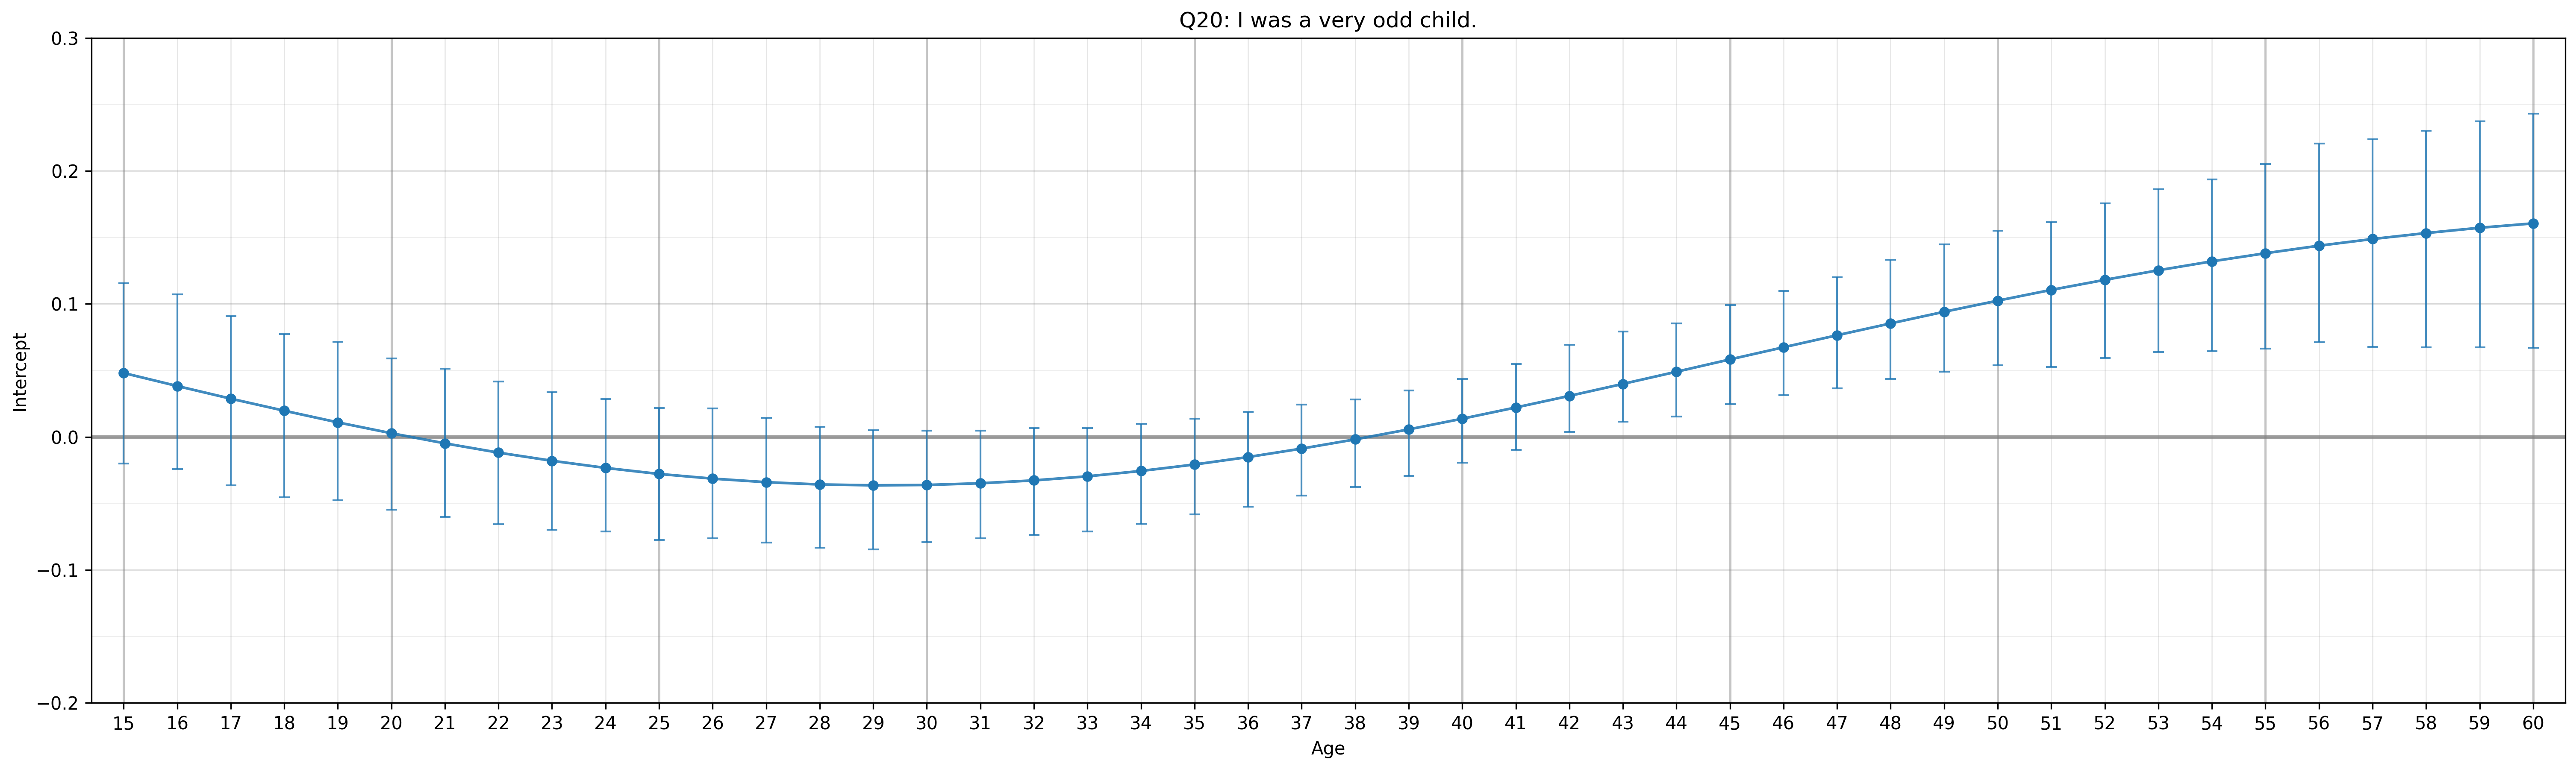
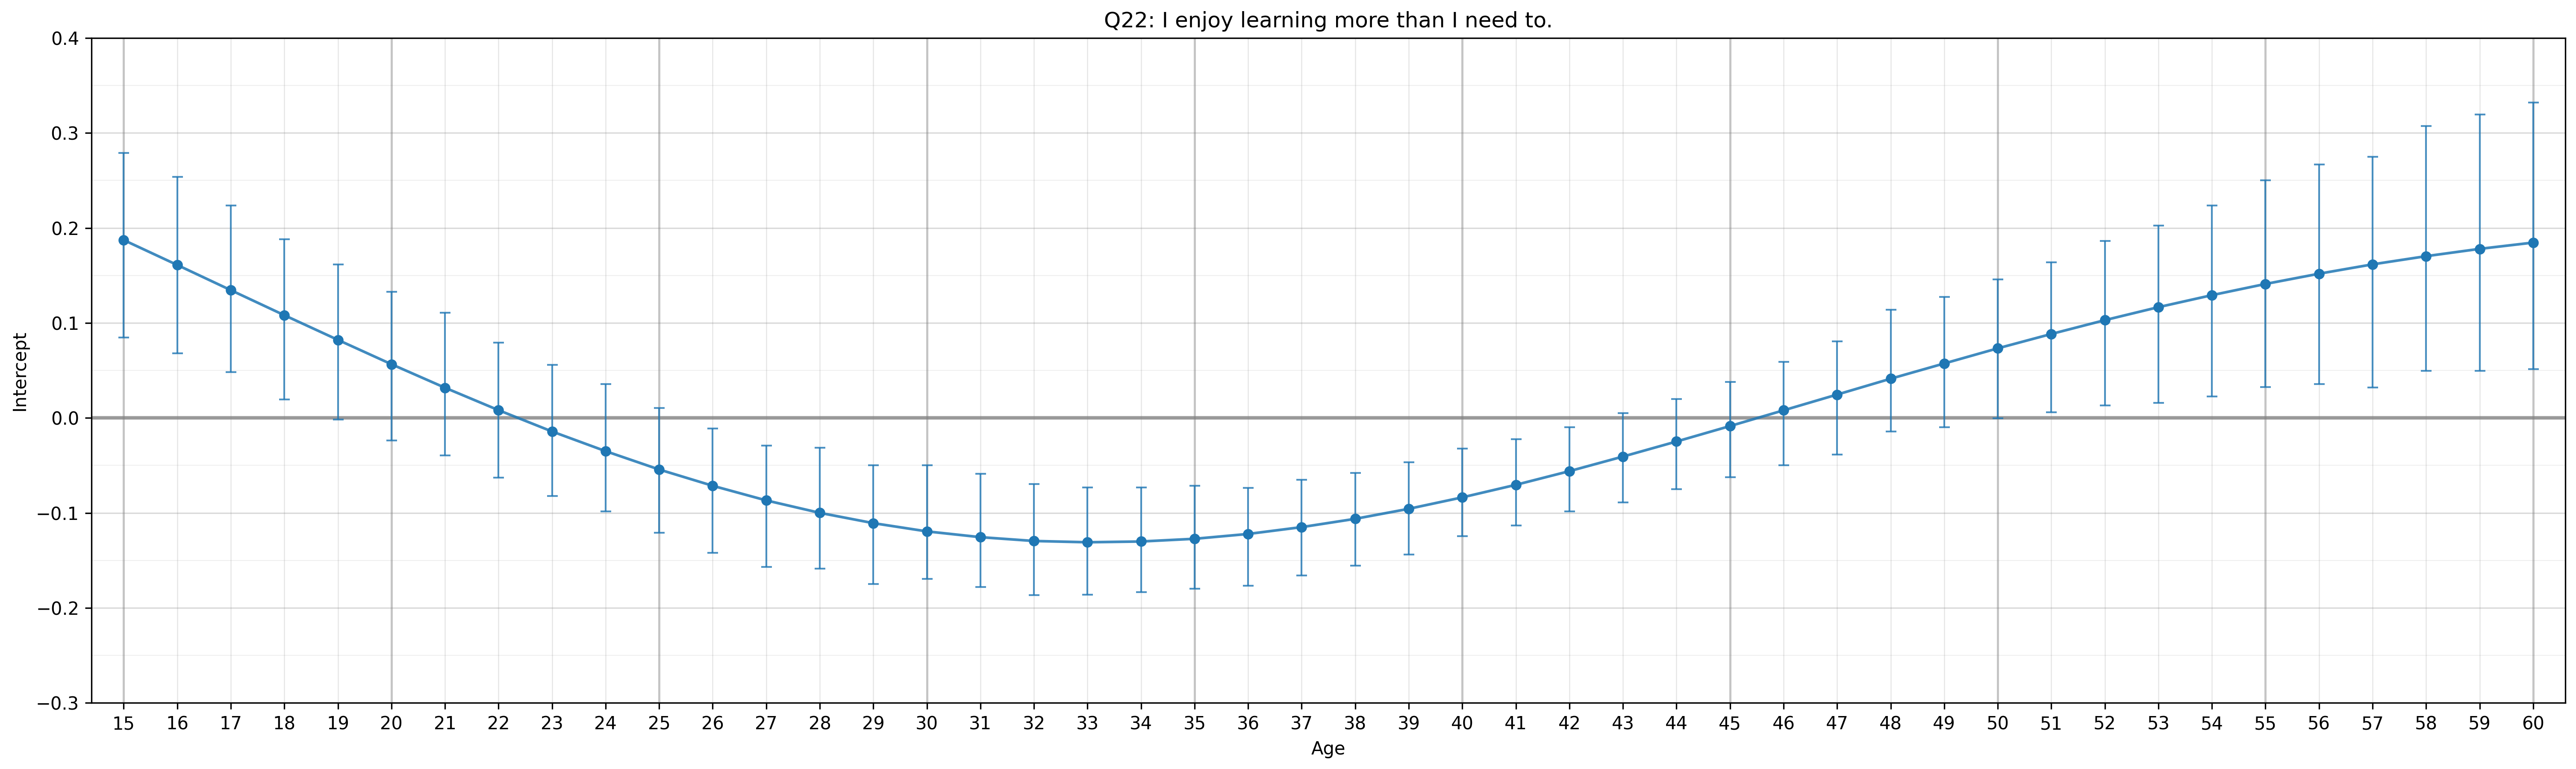
Items biased towards younger people
Q1: I am interested in science.
Q3: I like to play RPGs. (Ex. D&D)
Q4: My appearance is not as important as my intelligence.
Q8: I spend recreational time researching topics others might find dry or overly rigorous.
Q11: I am more comfortable with my hobbies than I am with other people.
Q15: I have started writing a novel.
Q16: I gravitate towards introspection.
Q17: I am more comfortable interacting online than in person.
Q19: I have played a lot of video games.
Q21: I sometimes prefer fictional people to real ones.
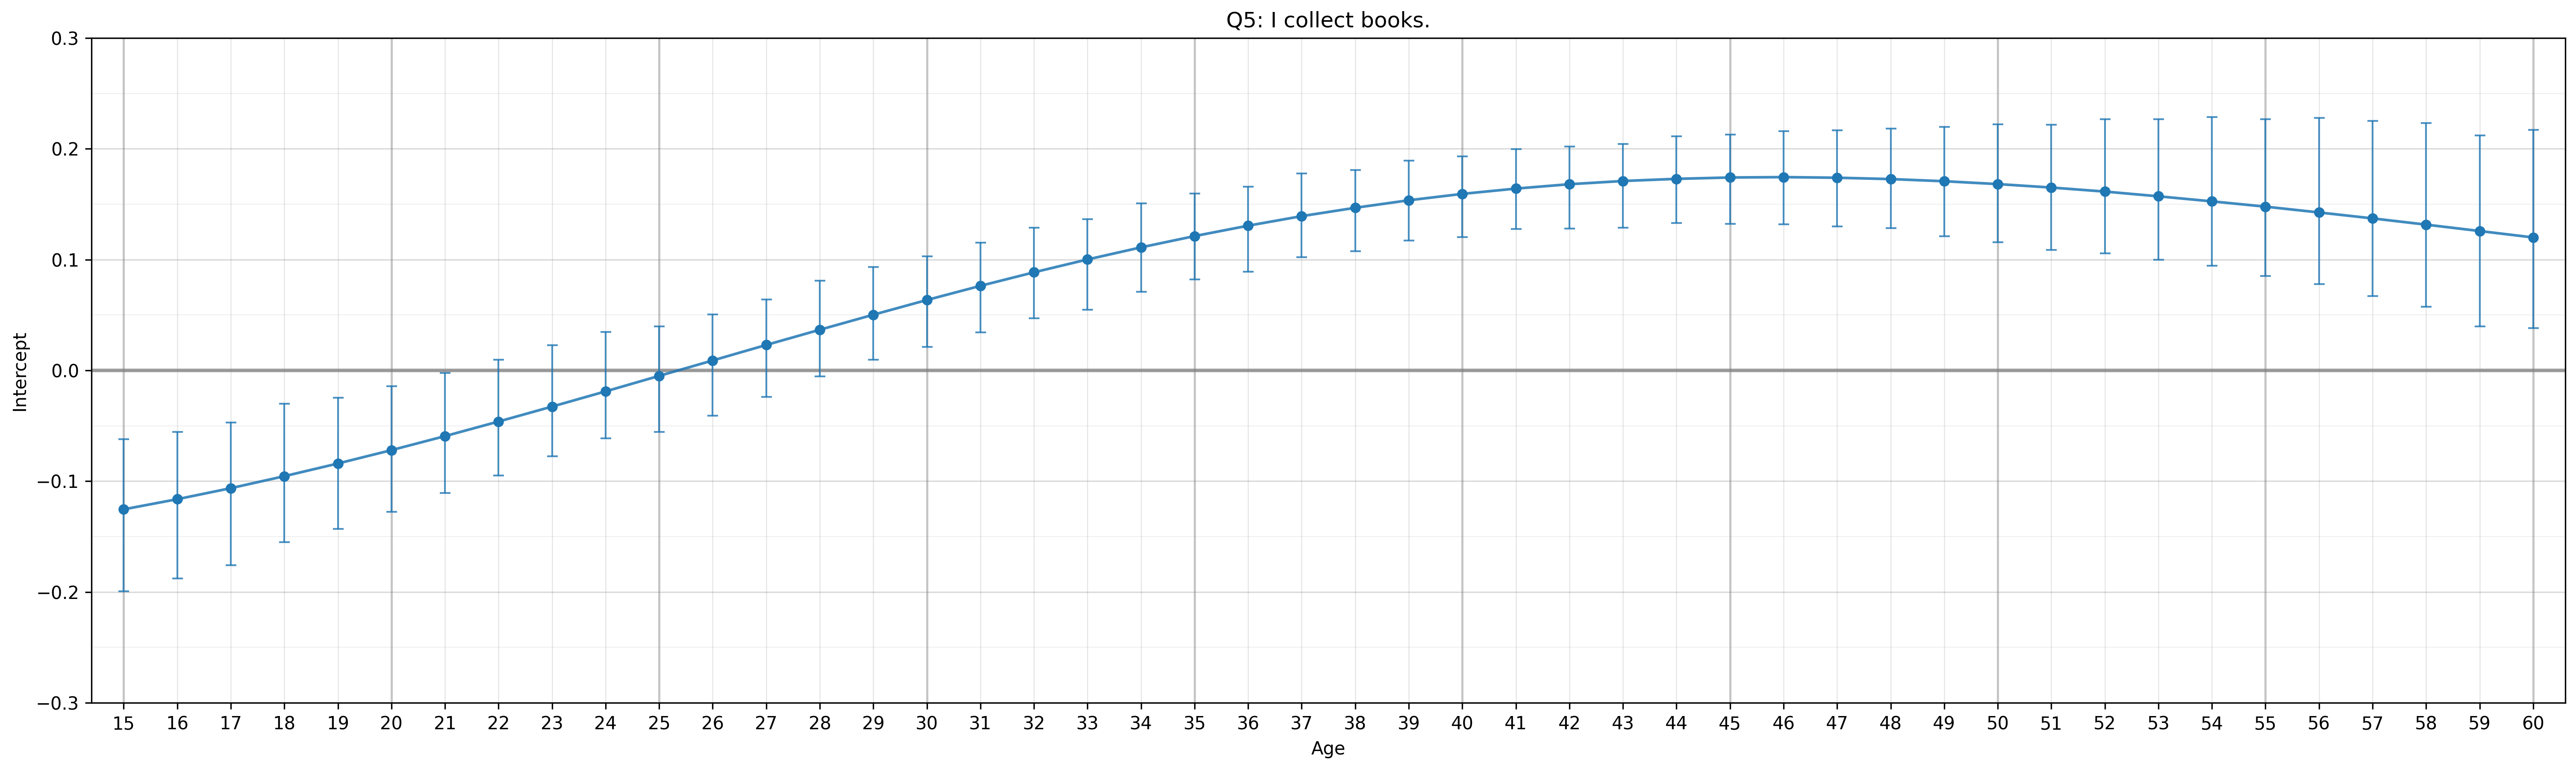
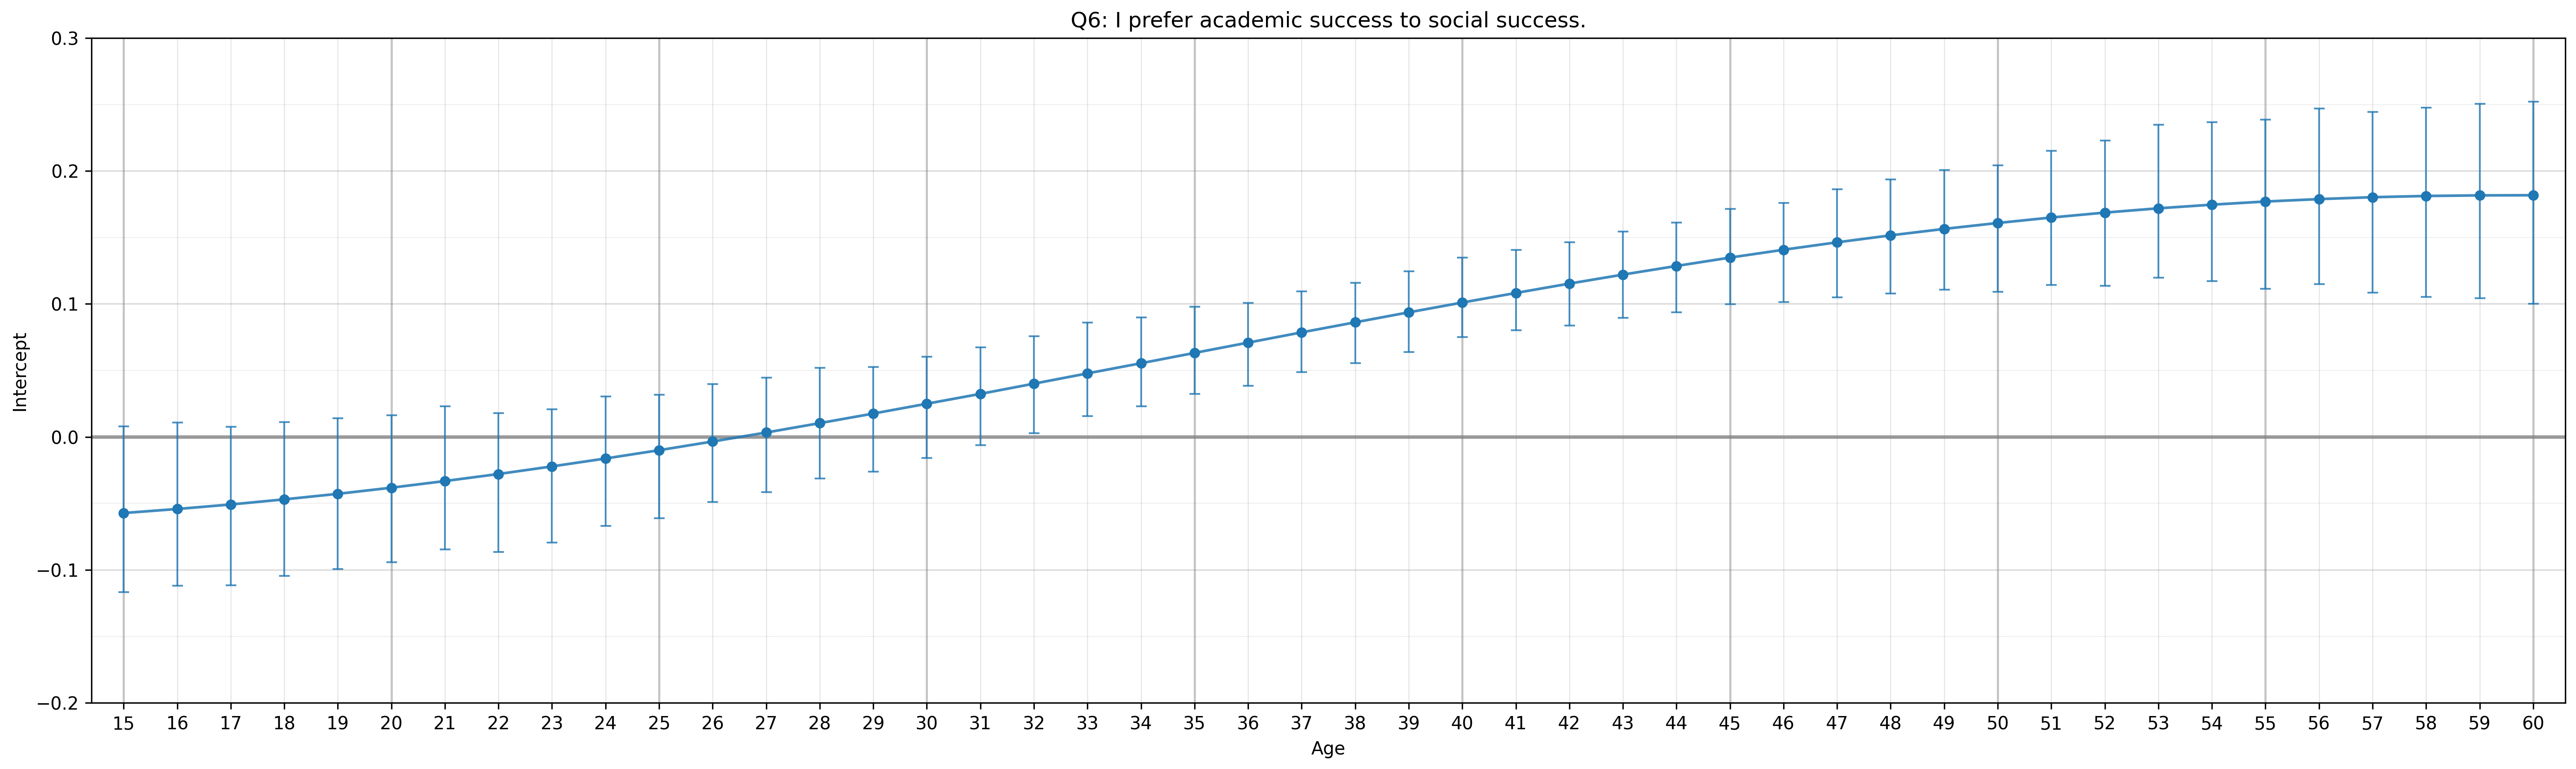
Items biased towards older people
Q5: I collect books.
Q6: I prefer academic success to social success.
Q7: I watch science related shows.
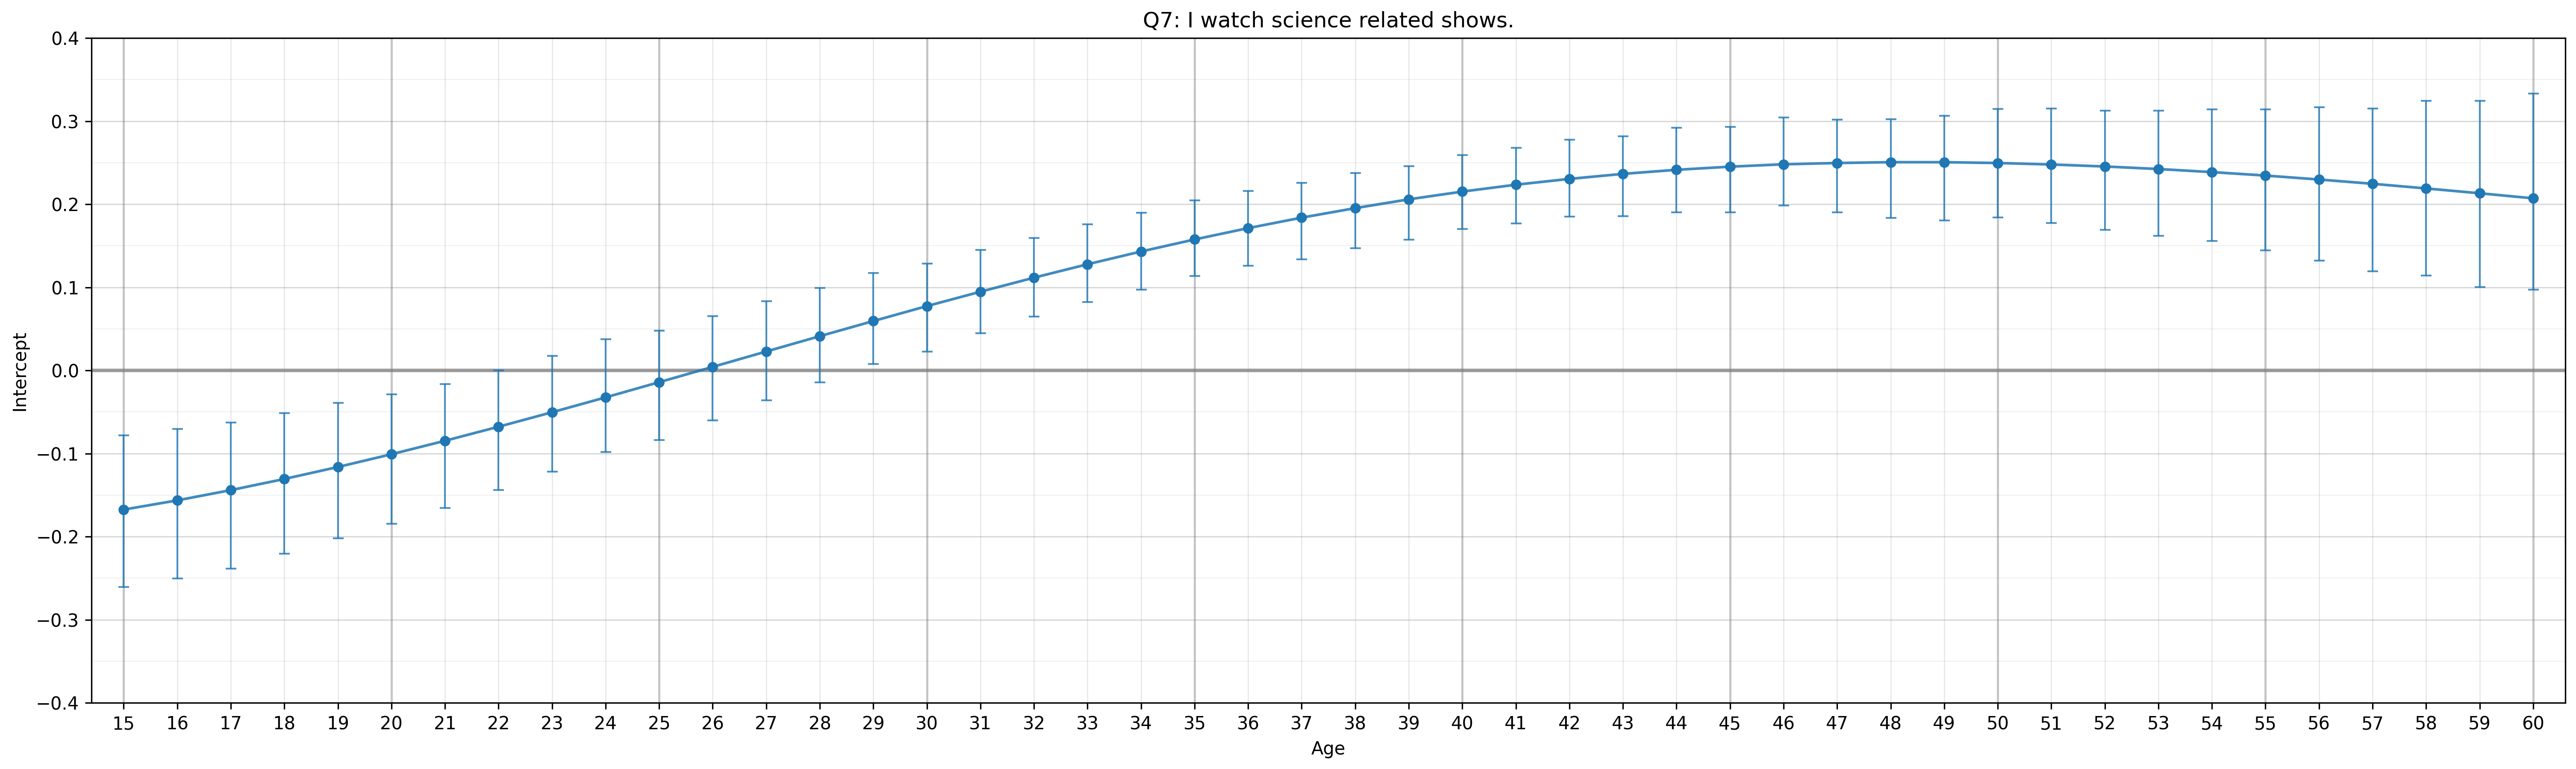
Q9: I like science fiction.
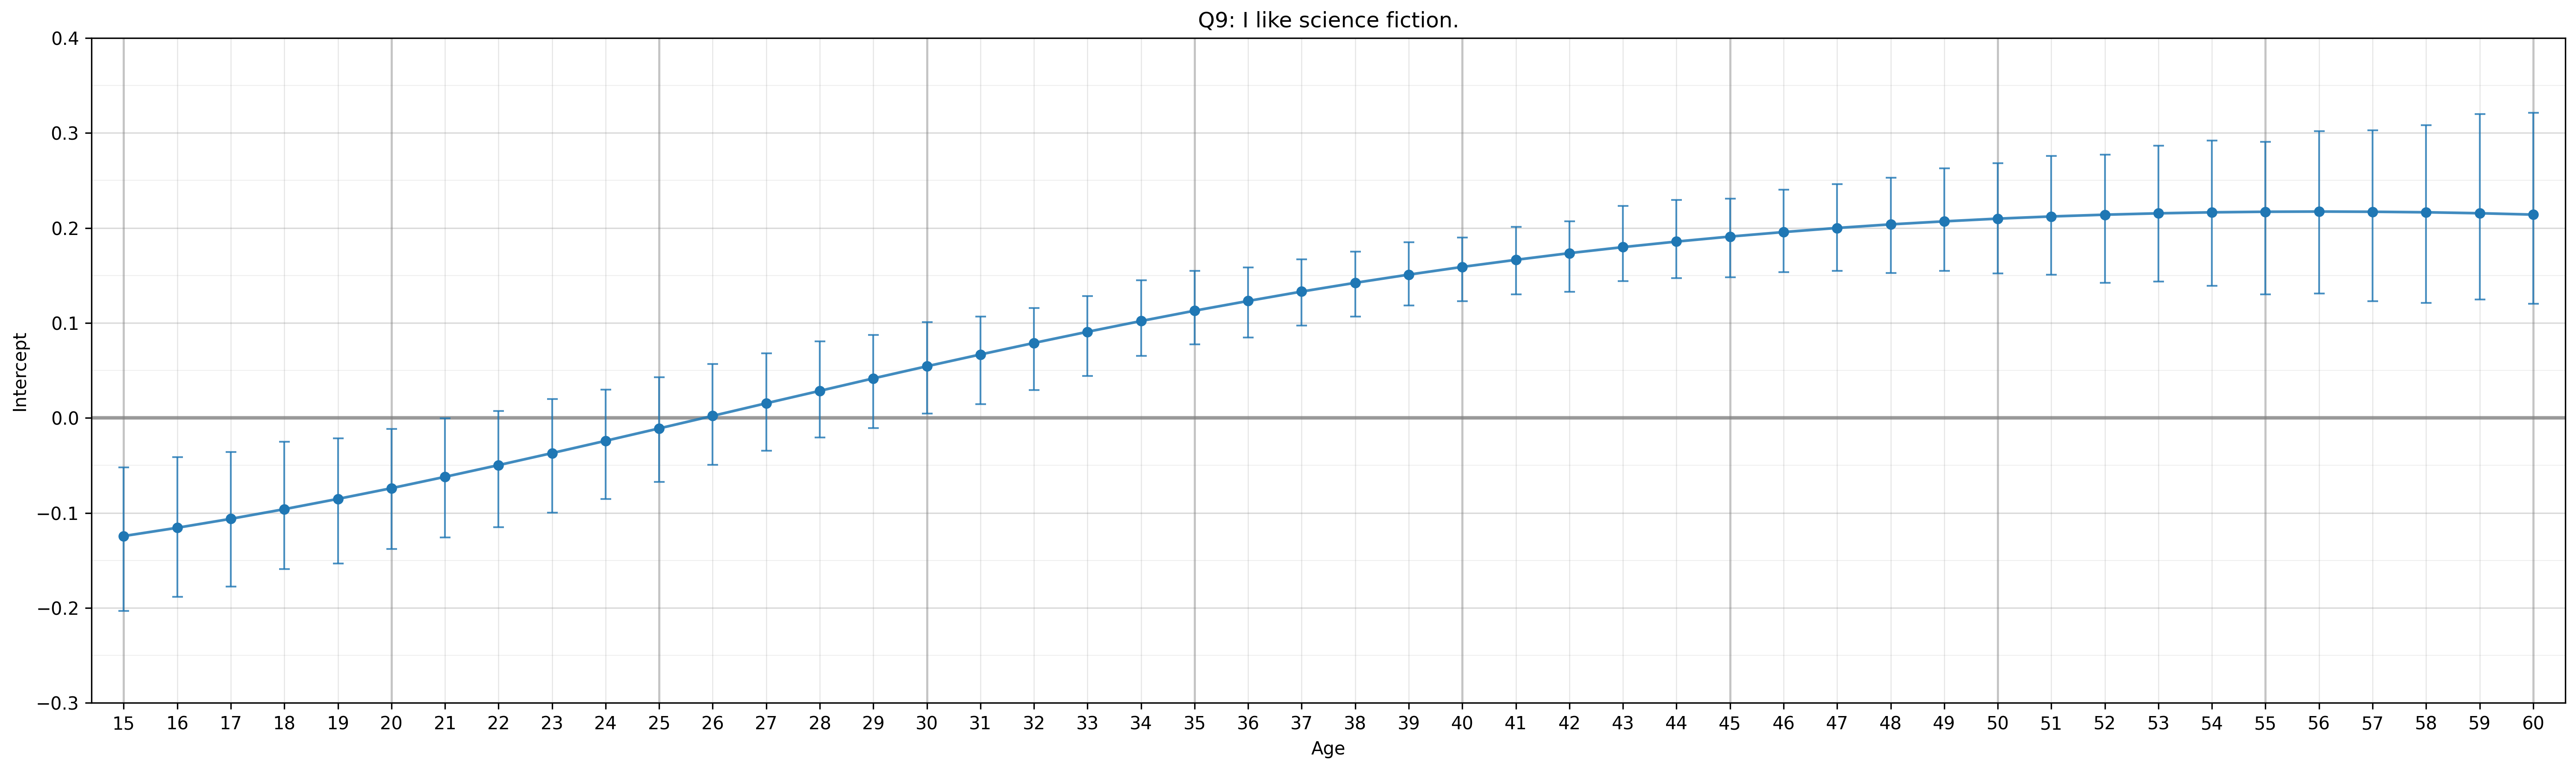
Q12: I spend more time at the library than any other public place.
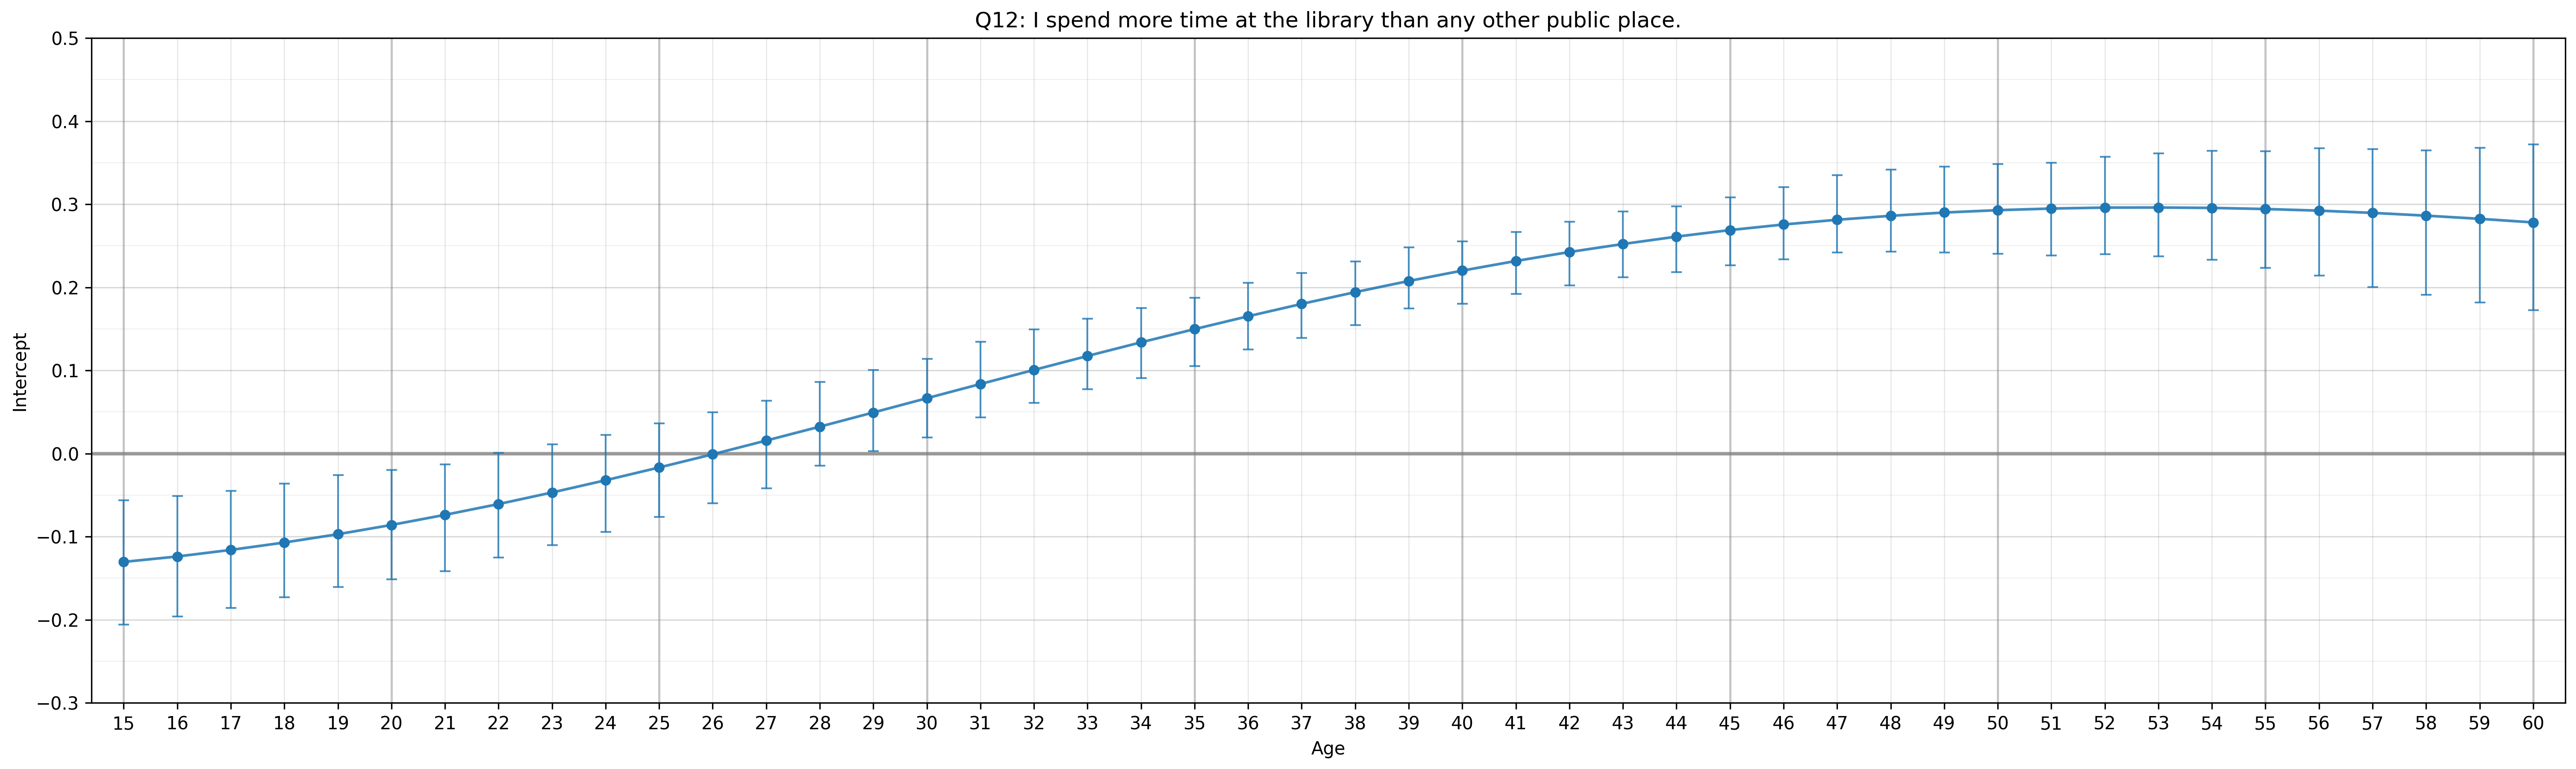
Q25: I care about super heroes.
Q26: I can be socially awkward at times.
Other items
Q2: I was in advanced classes.
Q10: I would rather read a book than go to a party.
Q13: I would describe my smarts as bookish.
Q14: I like to read technology news reports.
Q18: I love to read challenging material.
Q20: I was a very odd child.
Q22: I enjoy learning more than I need to.
Q23: I get excited about my ideas and research.
Q24: I am a strange person.
-
Basically, whether the items display bias. ↩
-
He labels various traits based on how strongly he believes they correlate with nerdiness, popularity, and education. He then subtracts the popularity vector from the education vector, creating a measure of the extent to which a trait is associated more with education than popularity. The resulting measure correlates 0.90 with the degree to which a trait is associated with nerdiness. ↩