Evaluating My Movie Recommendation System
I built a movie recommendation system. I’d like to know things about it. What do my ratings look like? How accurate is the recsys? How accurate could it be? How does it compare to external rating sites? Are newer movies better or worse for me? Let’s see.
What My Ratings Look Like
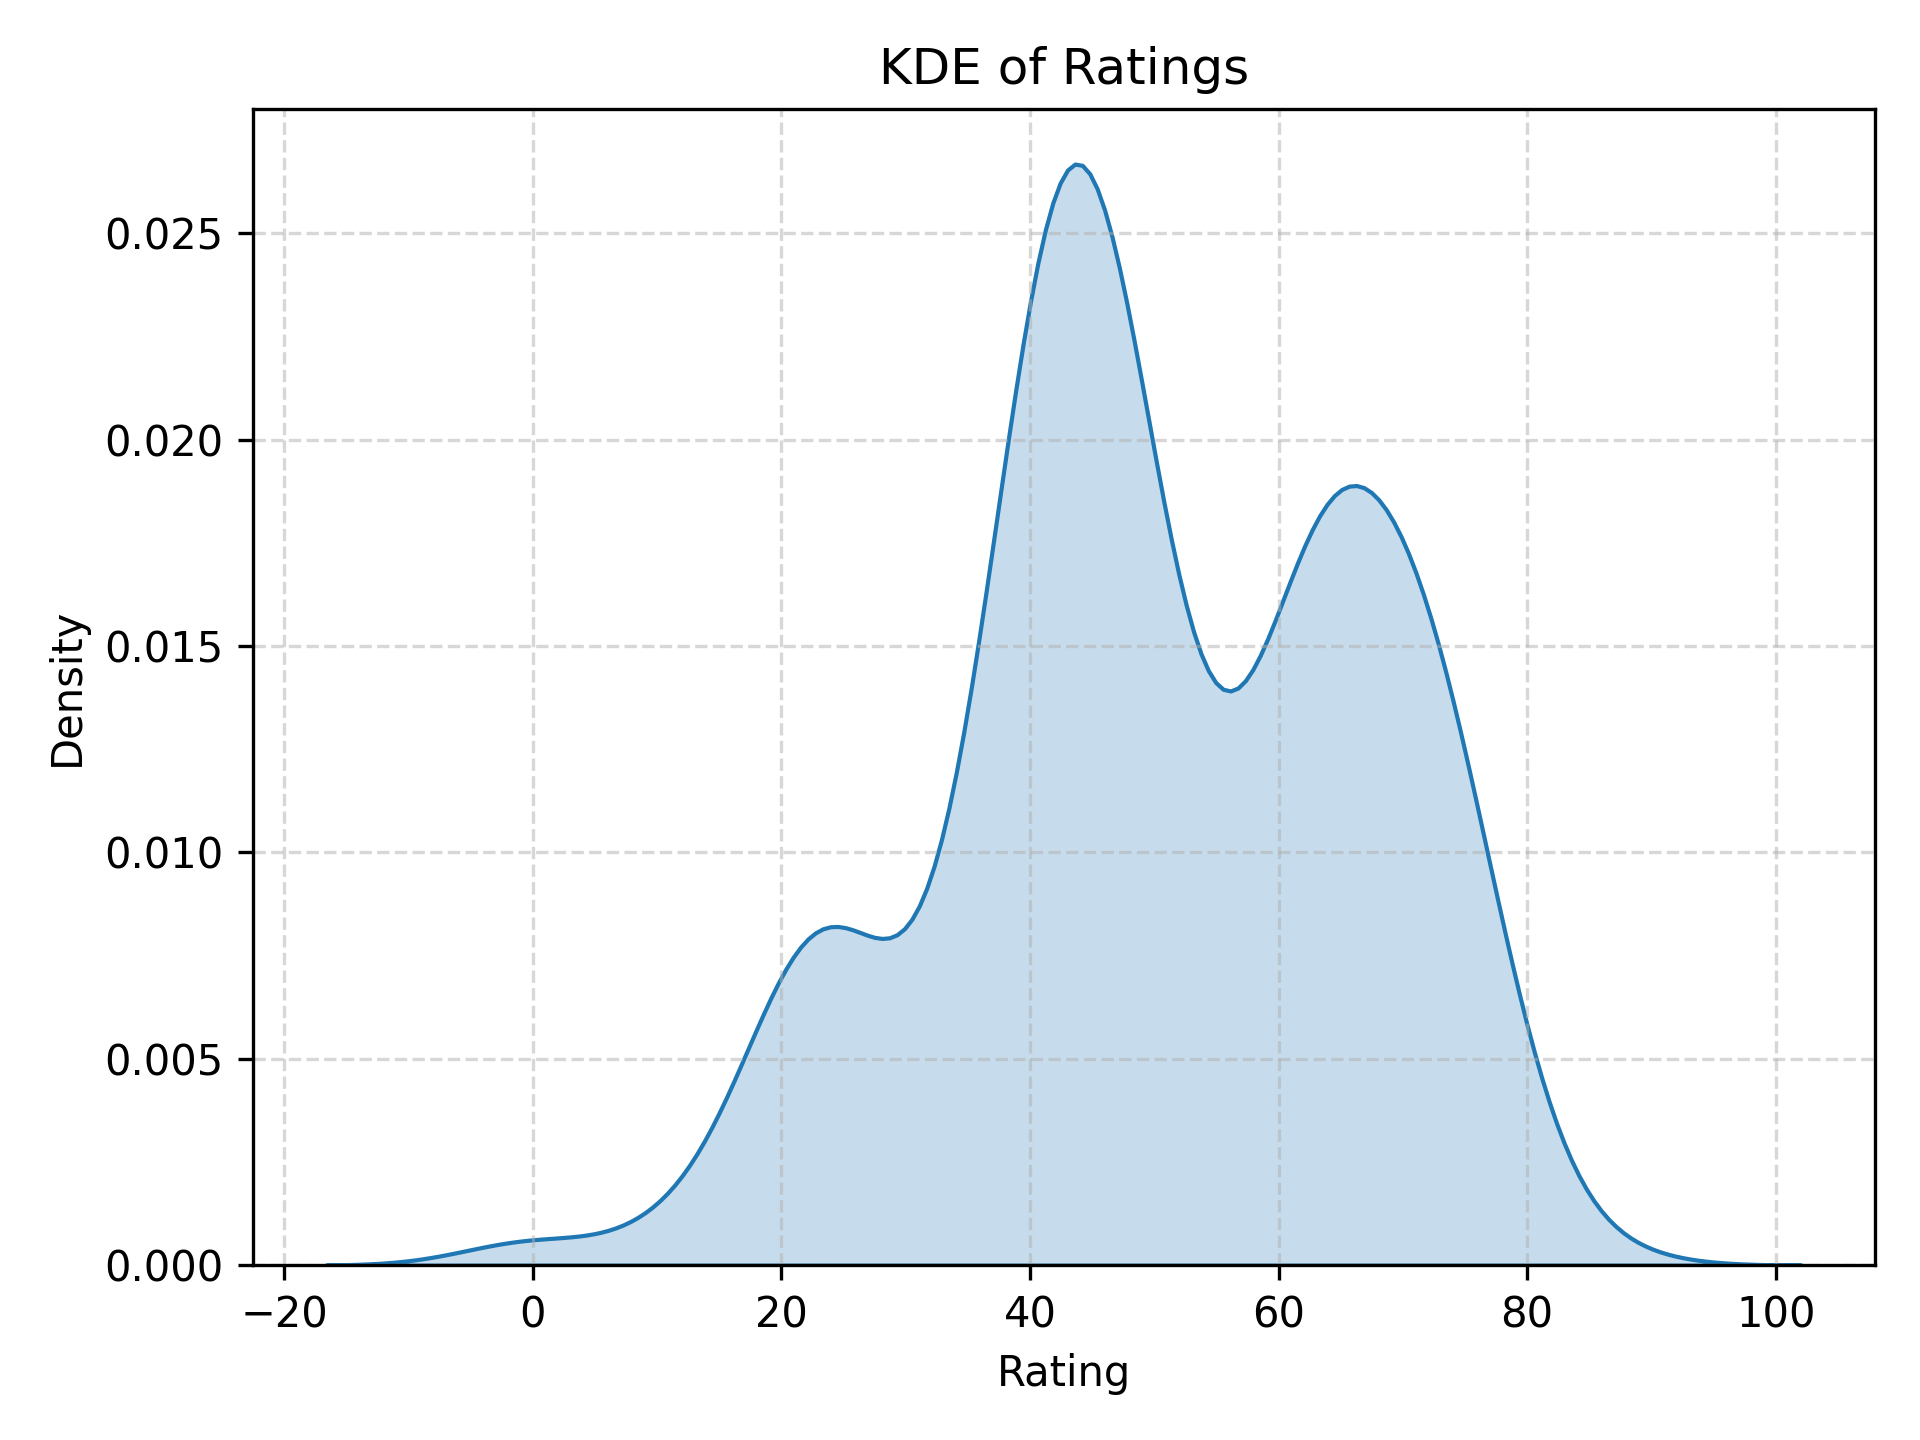
By design, my movie ratings have a mean of 50 and a standard deviation of $50/3 \approx 16.6$. Weirdly, the distribution seems to be trimodal. I’m not sure why this is. Maybe I instinctively sort movies into “good”, “mid”, and “terrible”.
There are two negative outliers: Trash Humpers (2009) and Metropia (2009). They were so bad that, to be honest, I didn’t watch more than a couple of minutes. I didn’t watch them expecting them to be good; I just wanted to see whether my recsys was accurate on the lower end in addition to the upper end. My verdict: it was.
How Much Data Does the Recsys Need?
So, how accurate is the recsys?
It doesn’t seem to matter very much which prediction model I use. I’ve tried ridge regression, elastic net, Bayesian linear regression, ridge regression with interactions, and Gaussian processes; the cross-validated correlations between predicted and actual ratings usually end up between 0.60 and 0.65.
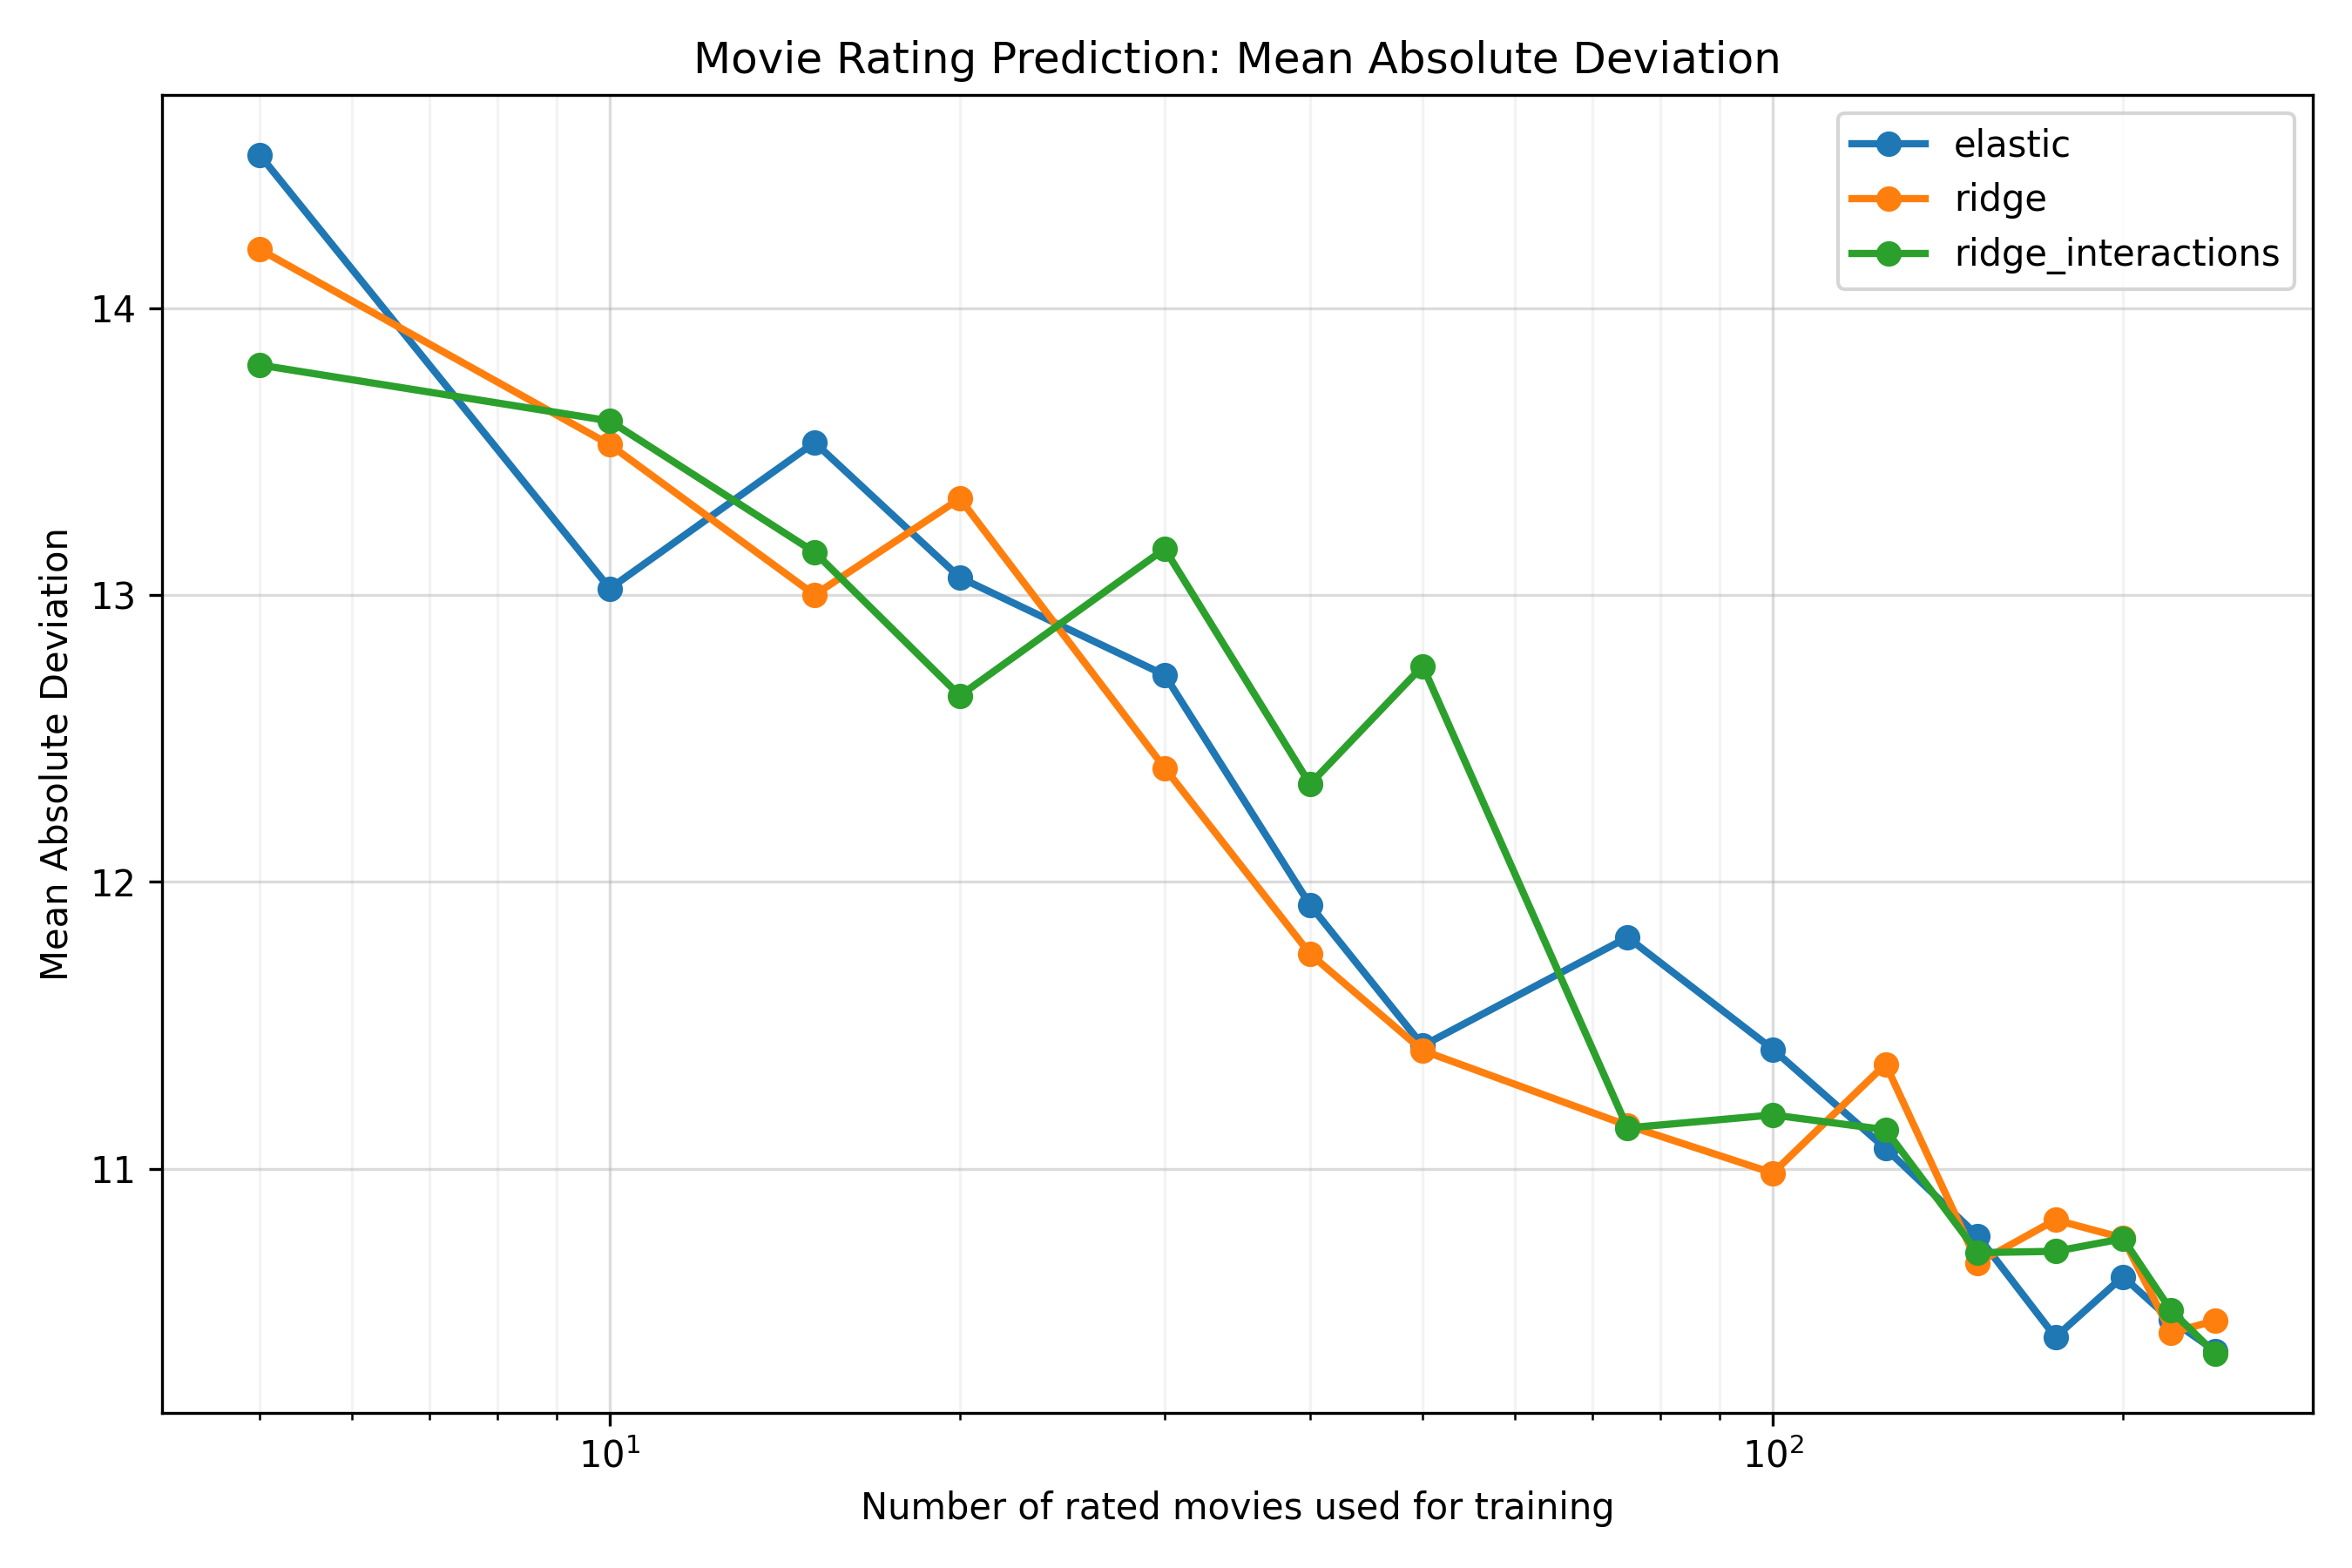
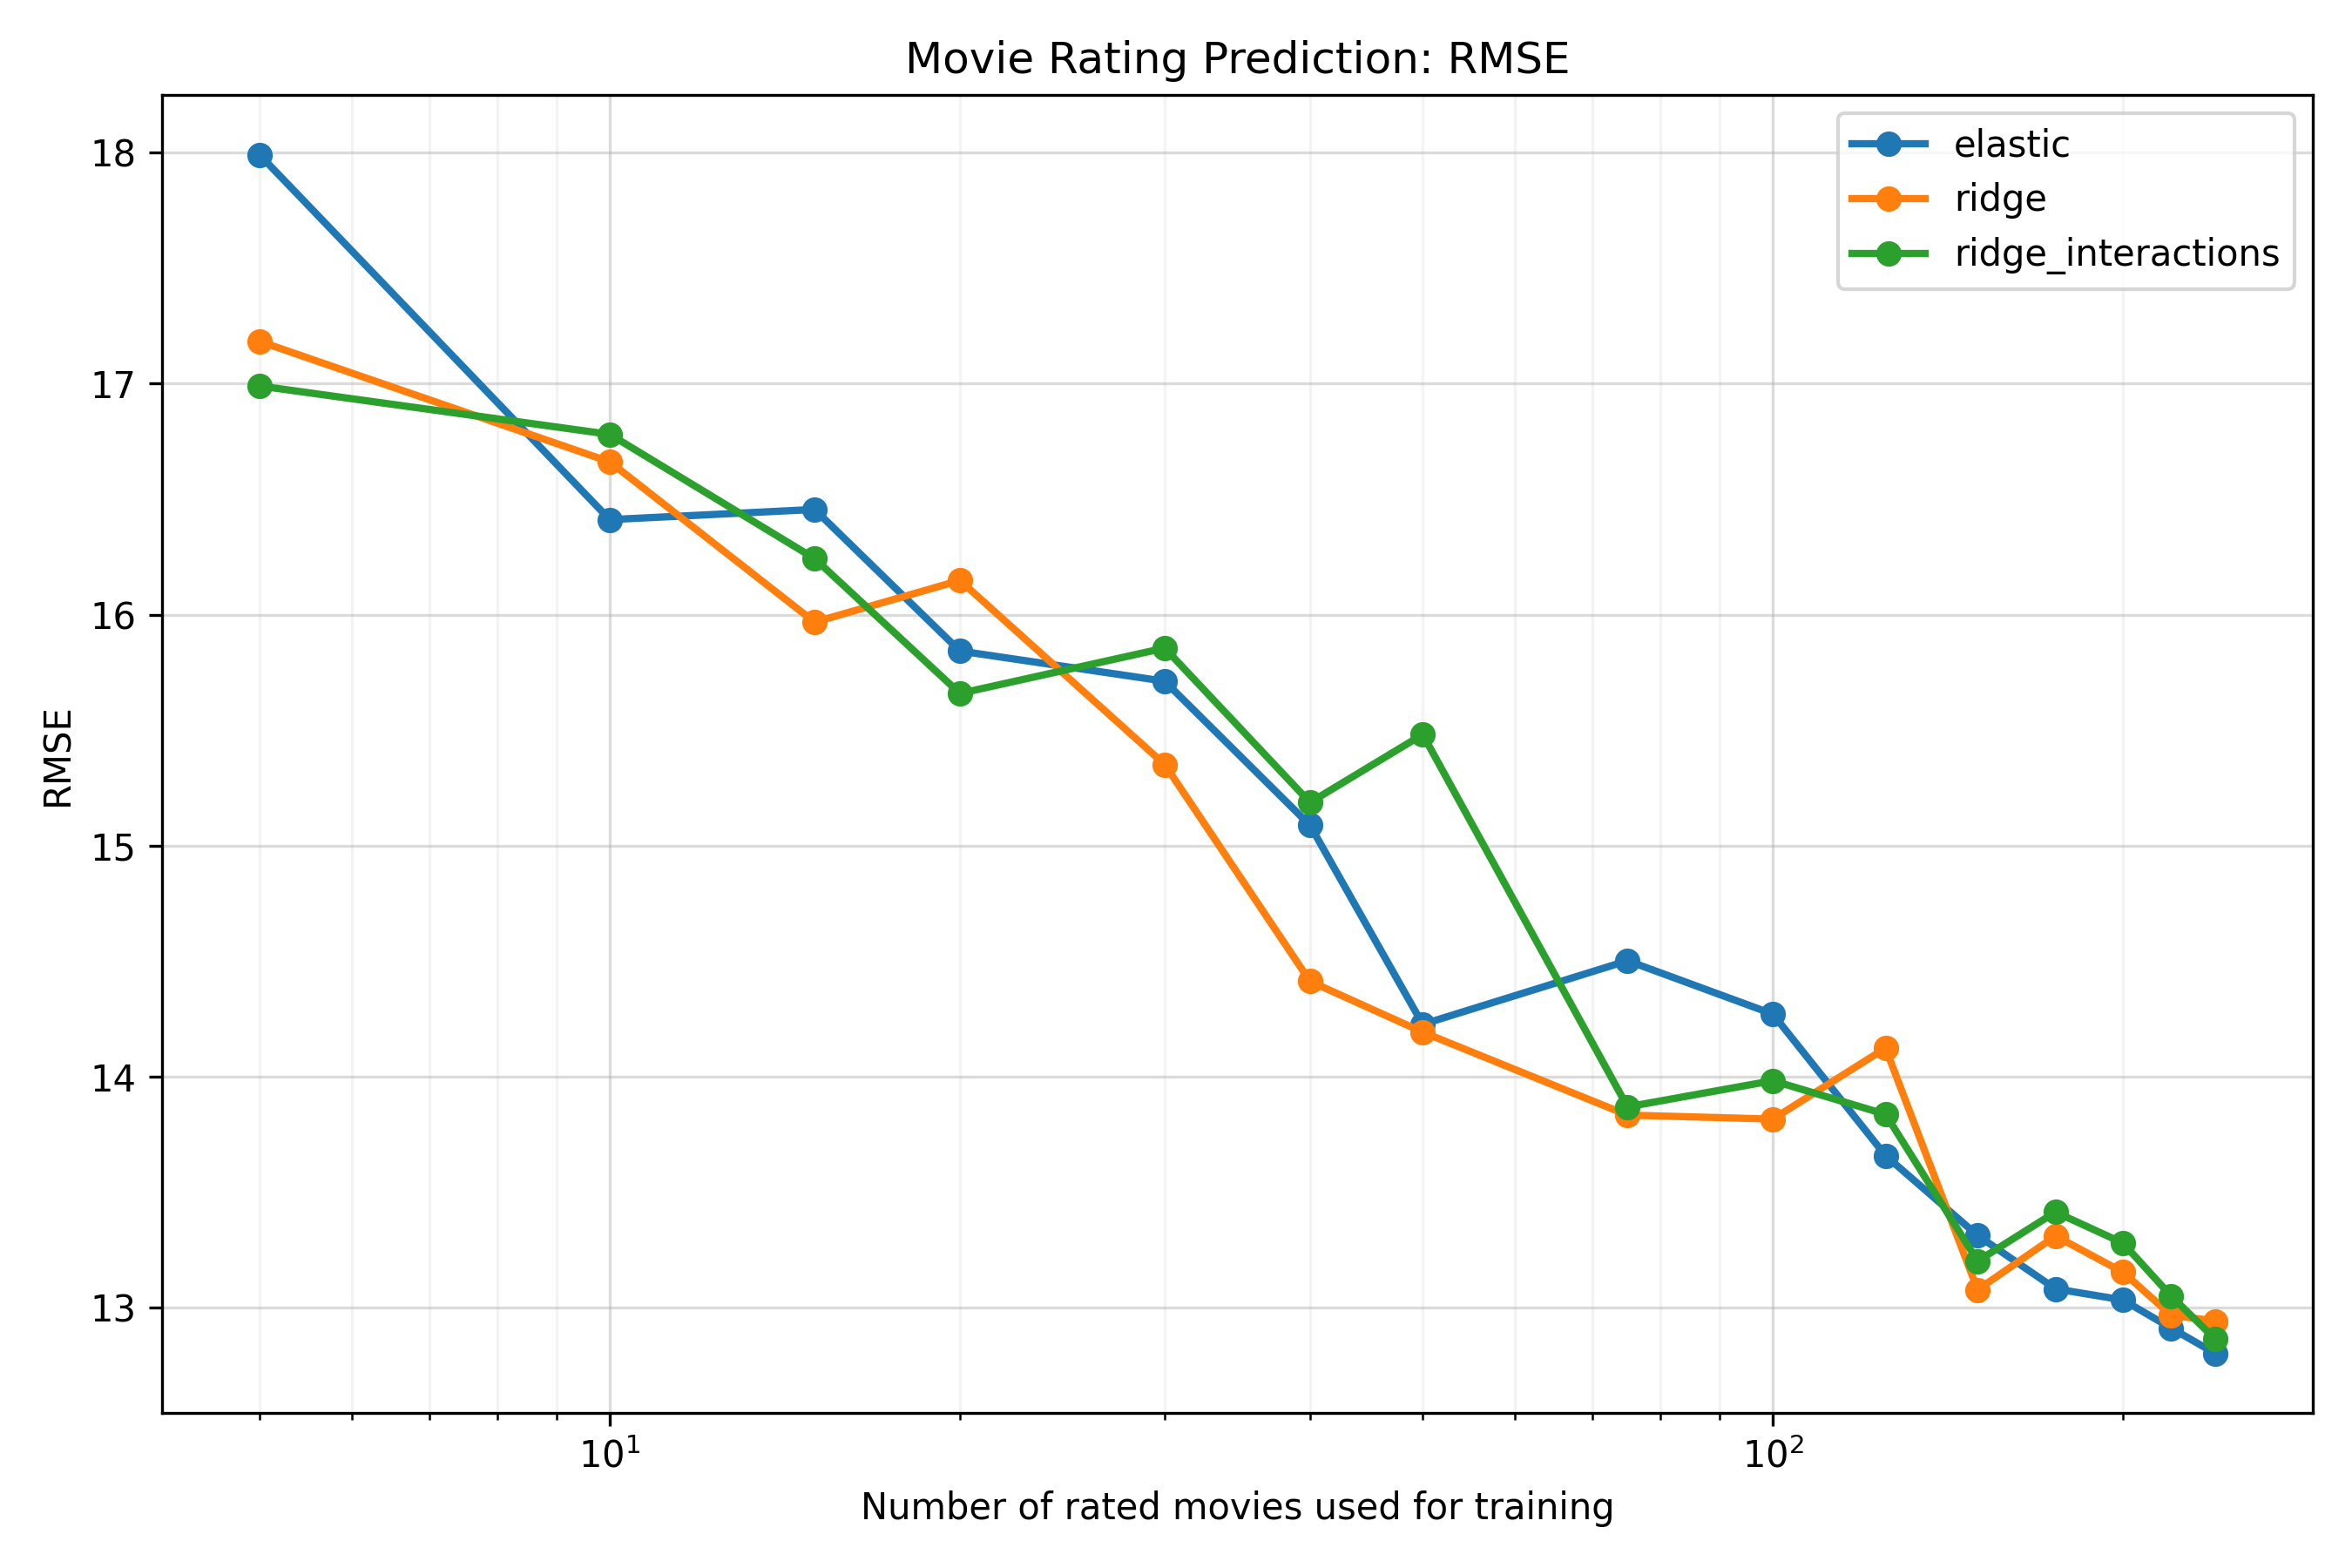
One obvious thing accuracy should depend on is how many movies are in the training set. The more movies I watch and rate, the more data the recsys has to learn my preferences. So, what does that relationship look like? Is there a ceiling?
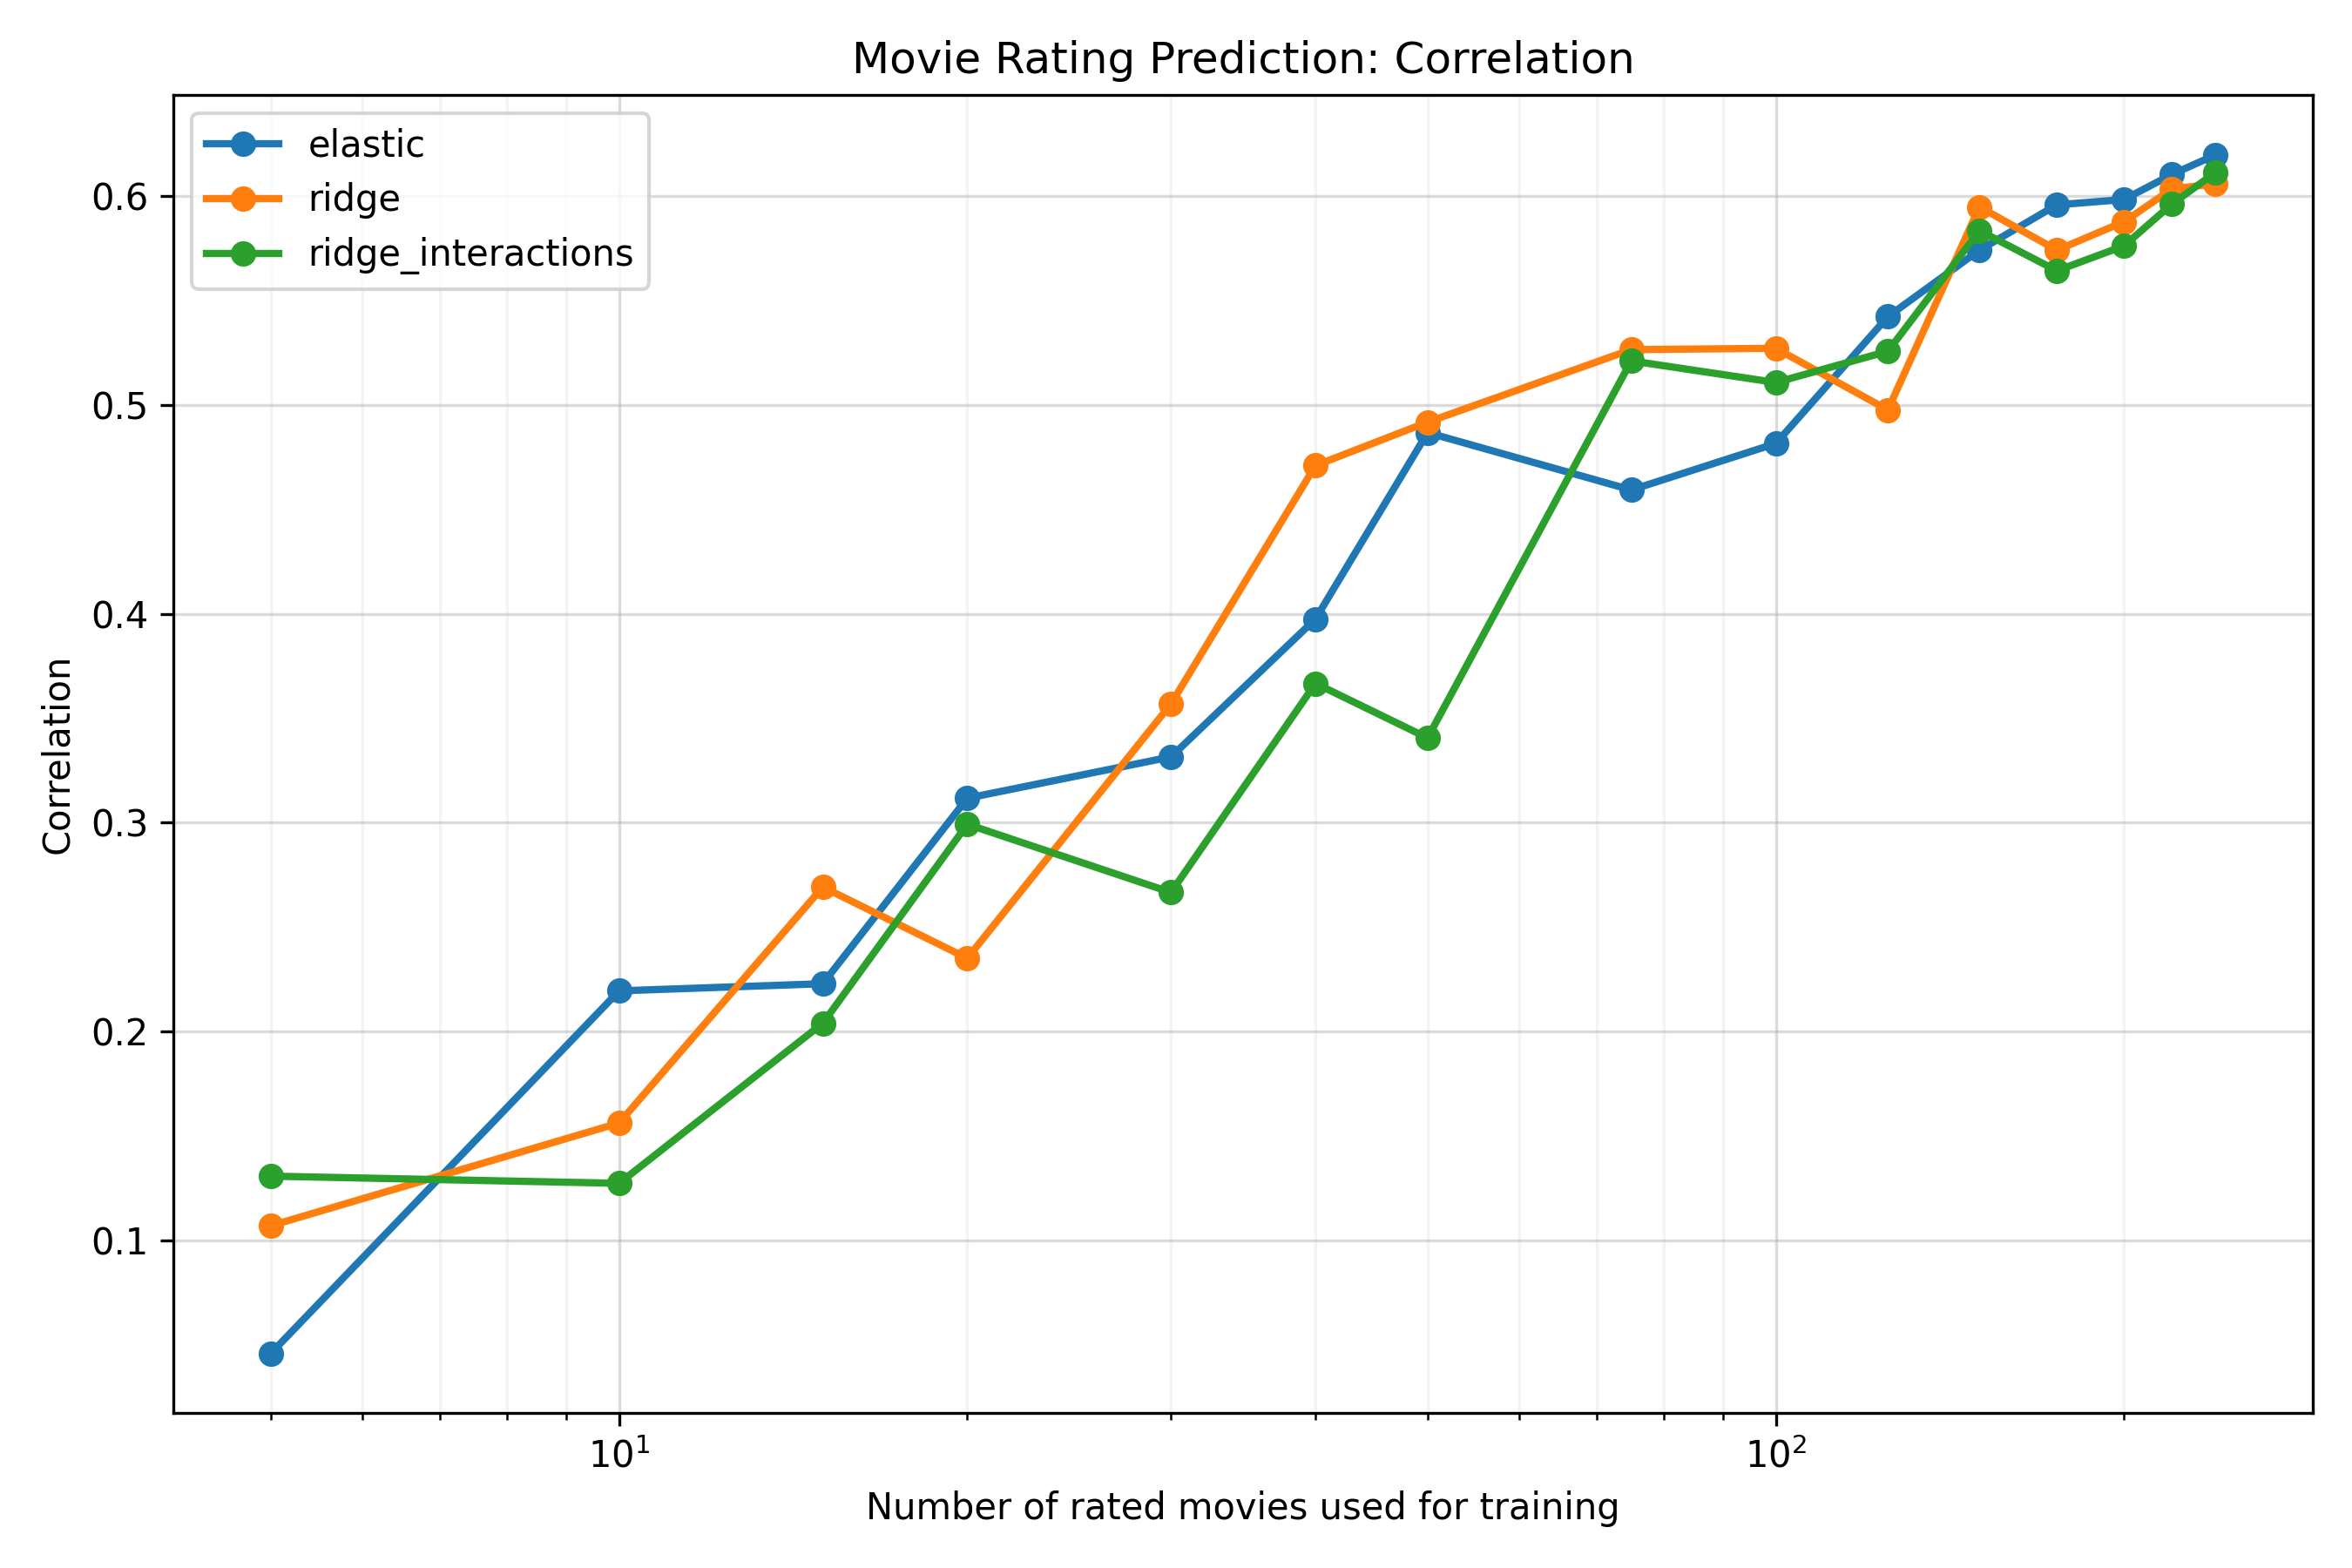
The relationship looks fairly linear on a log scale over the observed range, though I haven’t actually fit the trend directly (and, surely, it must start to level off at some point, due to irreducible noise in my ratings, limitations in the embeddings, and the fact that the correlation is bounded above at 1)1. If we look at the graphs (in the Appendix) for the mean absolute error and RMSE by training set size, they also look pretty linear2. Anyway, the curve is somewhat noisy, but the overall pattern is clear: very roughly, I’d need to double the number of movies I’ve rated to increase the correlation by about 0.10, which is a lot of movies to watch. Still, reasonable accuracy seems pretty easy to achieve if someone else wishes to build a similar system: a correlation of about 0.5 is reached by around 50 movies.
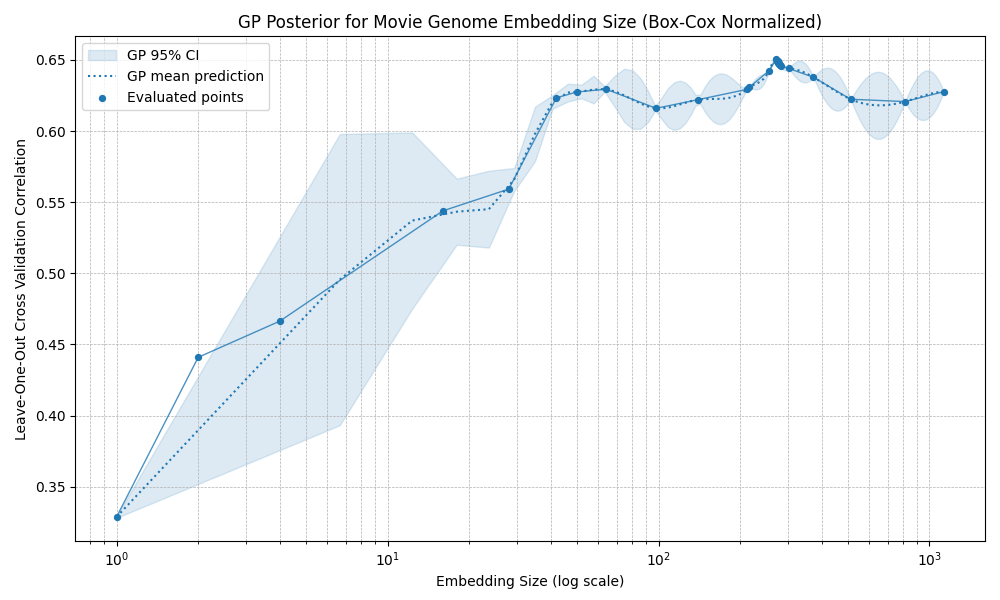
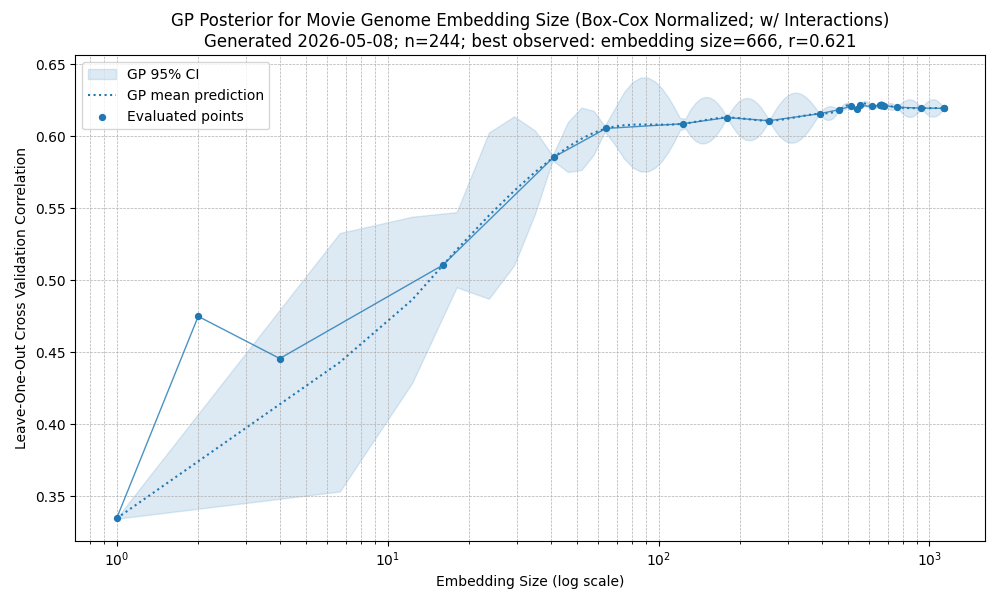
Optimizing the Embeddings
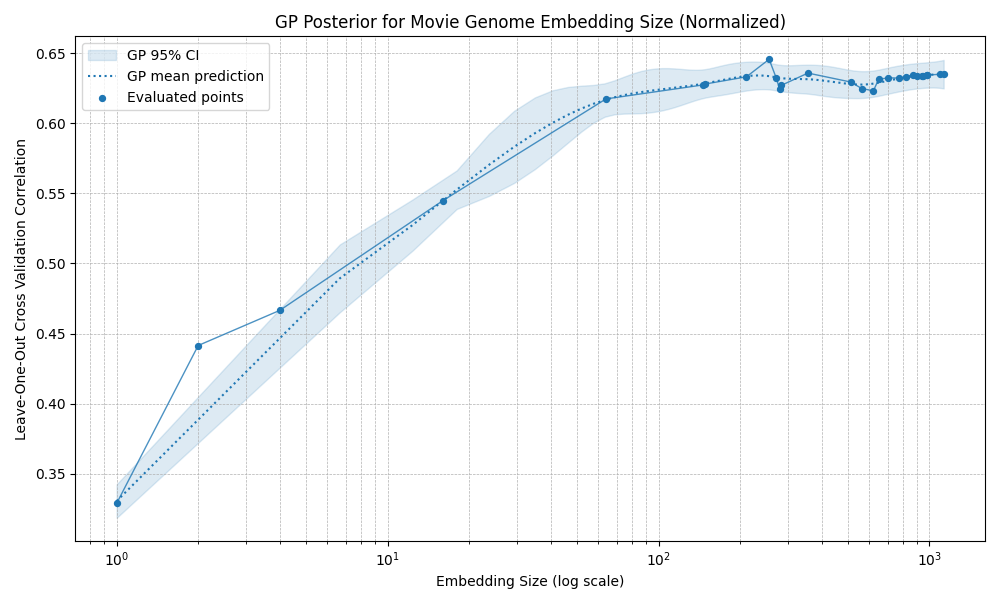
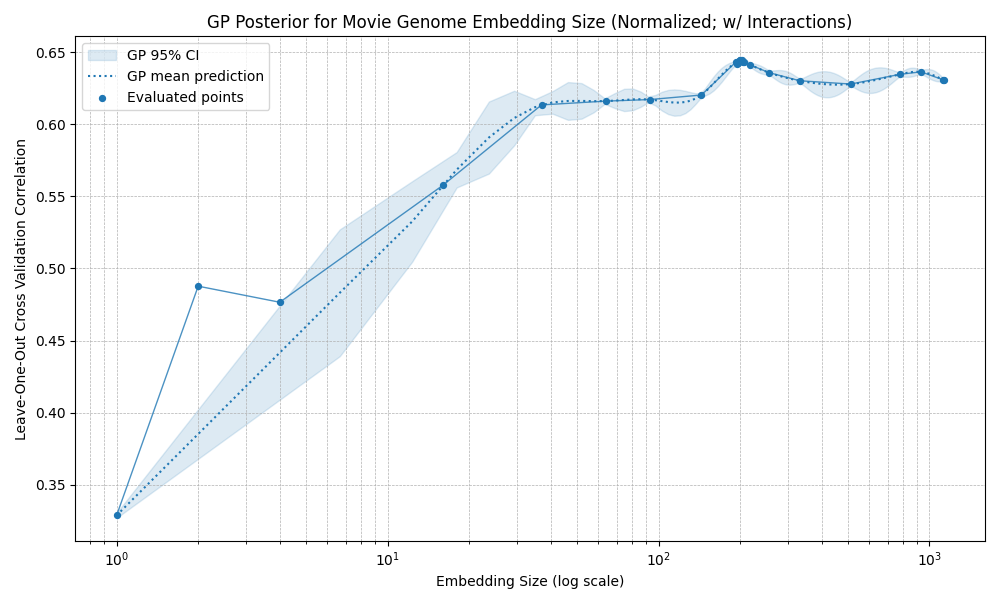
Since the recsys uses PCA to reduce the dimensionality of the movie embeddings, I also need to choose how many dimensions to keep.
Too few, and there isn’t enough information left to make accurate predictions. Too many, and the model can overfit. There are also preprocessing choices: should I apply a Box-Cox transformation to the original embedding features before PCA, to make them closer to normally distributed? Should the resulting embeddings be standardized, so each dimension has mean 0 and standard deviation 1, or normalized, so each movie vector has length 1?
I tested several combinations. The broad result is that most preprocessing choices do not change the eventual performance ceiling very much: most methods plateau at correlations around 0.60 to 0.65. The exception is standardization, which produces an early optimum around 40 dimensions: performance improves at first, then declines noticeably until roughly 400 dimensions, before eventually starting to rise again.
Normalized embeddings
Box-Cox normalized embeddings
Standardized embeddings
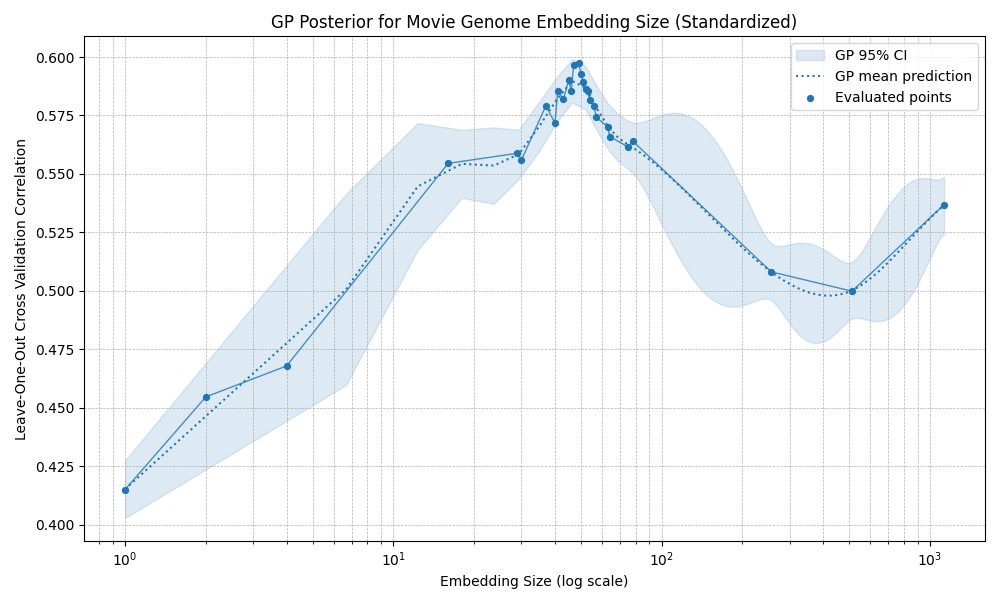
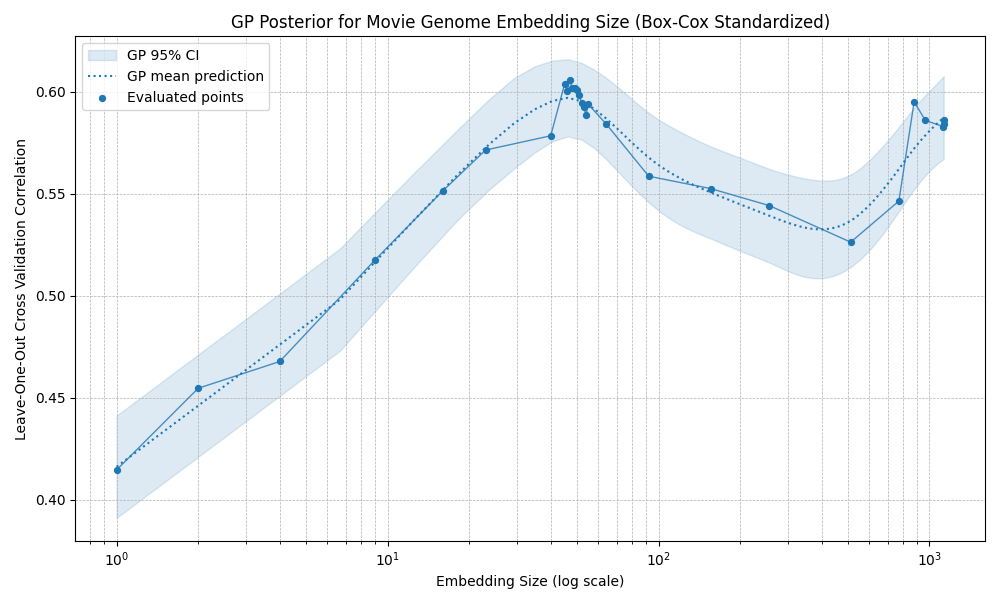
Overall, it seems the exact embedding construction is not the main constraint. Beyond a certain point, prediction accuracy seems mostly limited by the amount of rating data, irreducible noise in my ratings, and possibly information missing from the embedding space itself.
External Rating Sites as Predictors
The recsys is moderately predictive of how much I’ll like a movie, but it has one major limitation: it only works for movies in the dataset. Sometimes I might want to watch a movie that just came out, but only if I know I’ll probably enjoy it. So how well do external movie-rating sites, such as Rotten Tomatoes, predict my ratings?
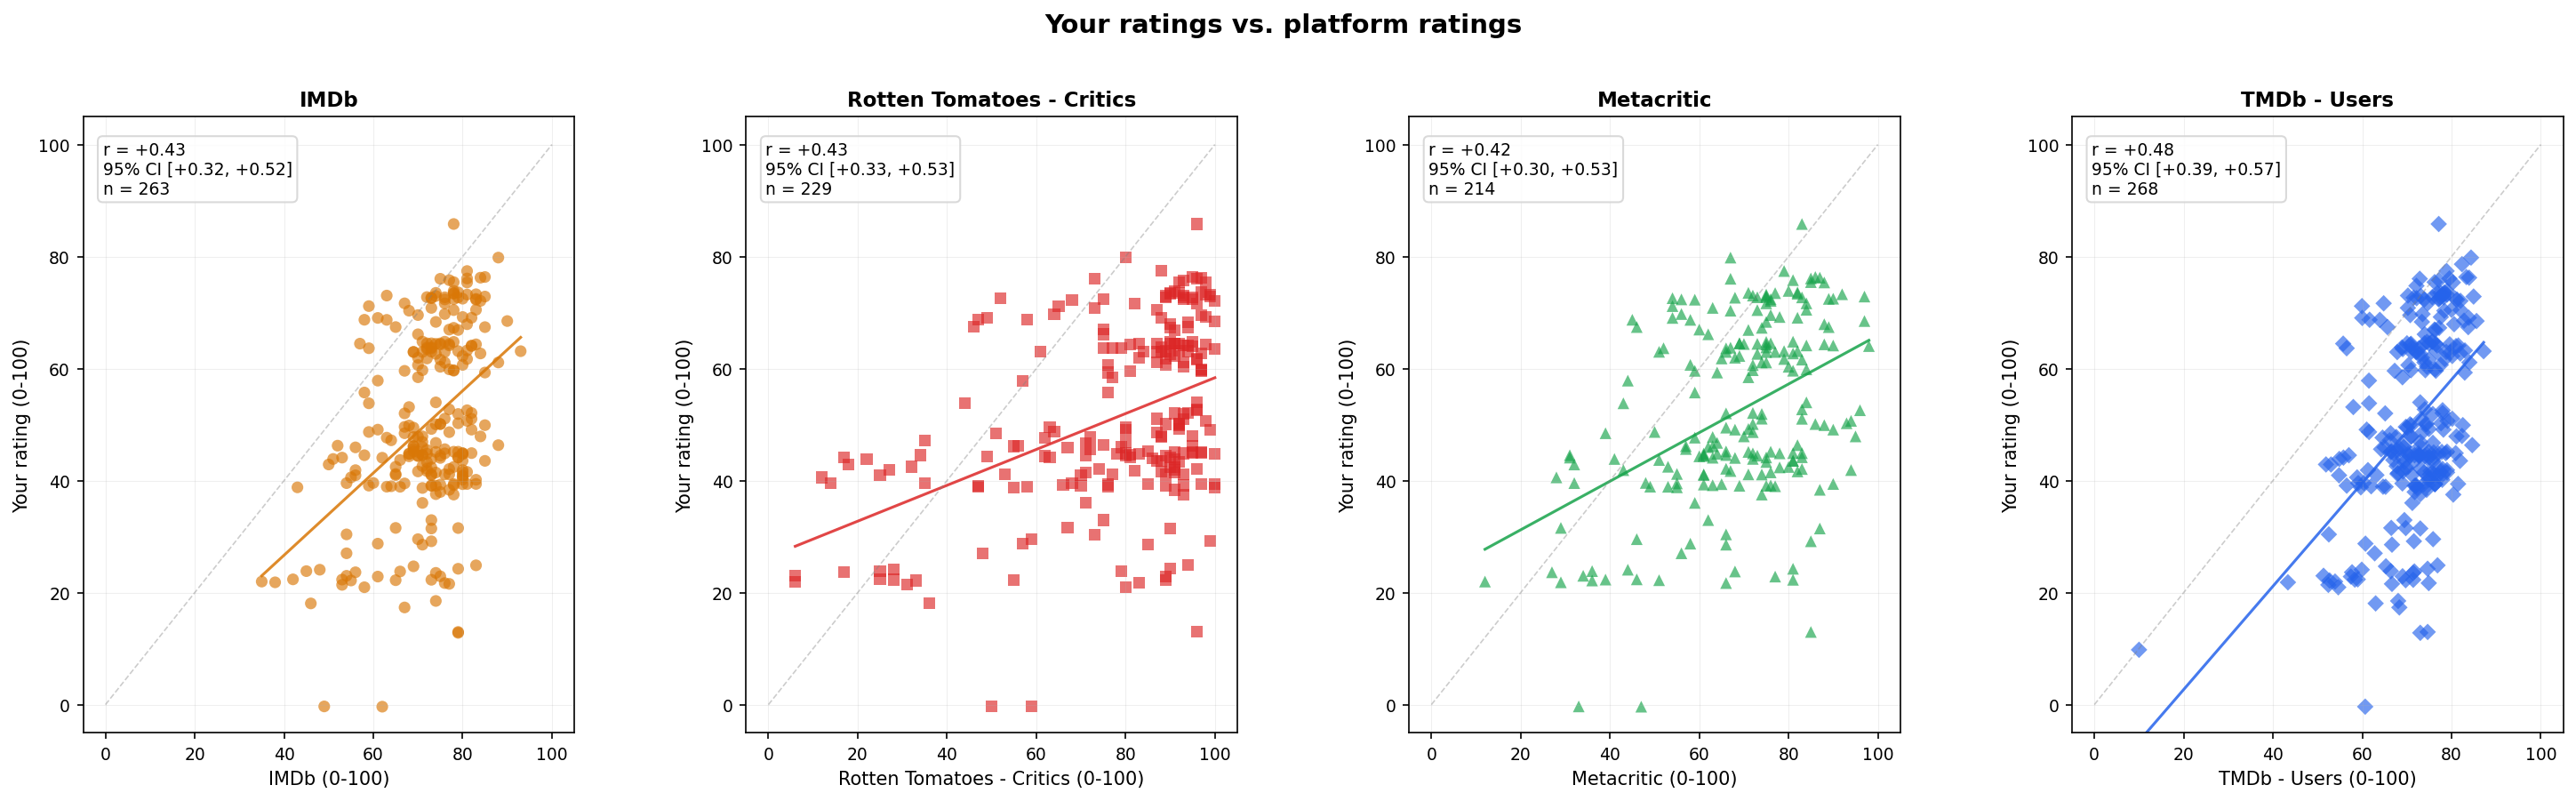
All the external raters have fairly similar predictive accuracy, with correlations ranging from about 0.45 to 0.50.3 TMDb users perform best (r=0.48), though only slightly better than the others.
How well do they work together?
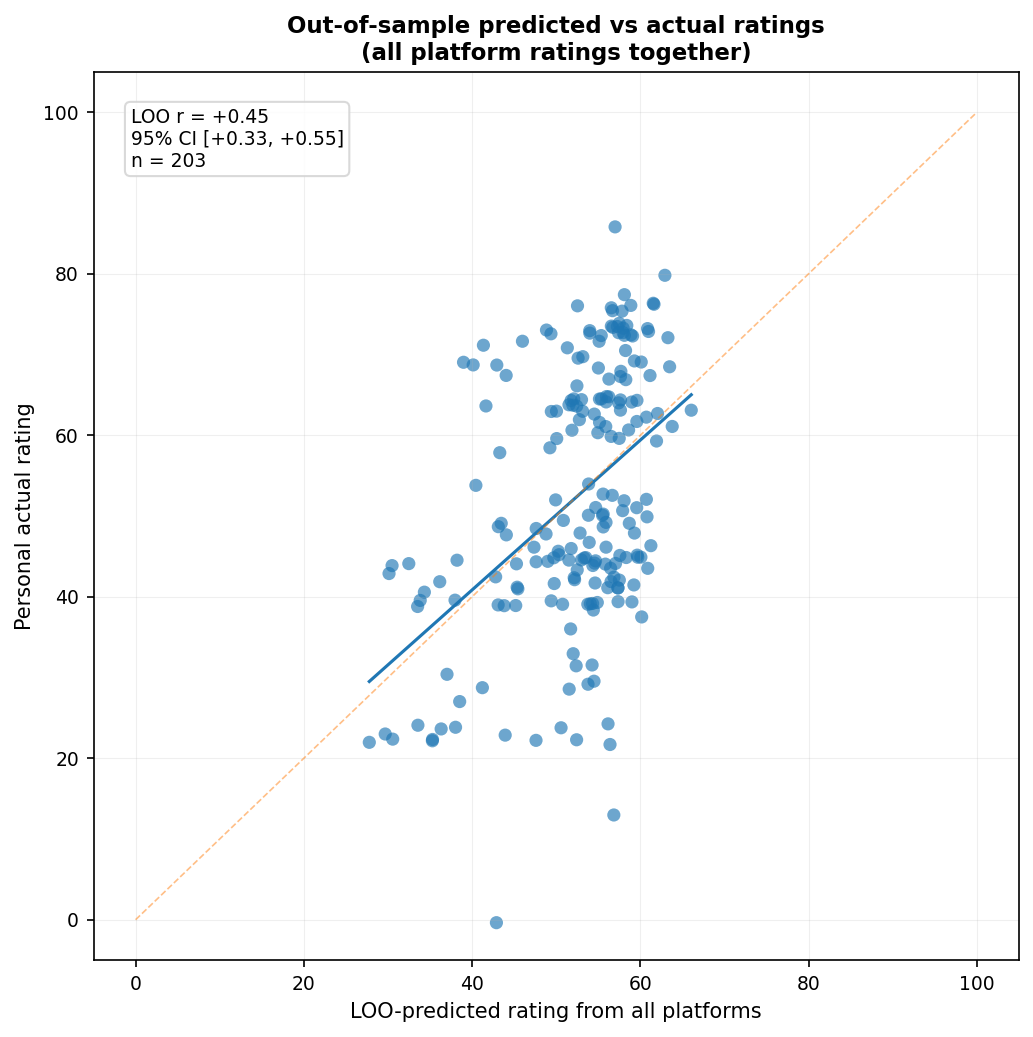
The combined correlation of 0.49 is technically higher than any individual site, though only slightly higher than the best individual predictor (TMDb users: $r = 0.48$). However, this comparison is somewhat misleading, since the individual platform correlations above are in-sample correlations with my ratings, whereas the combined prediction is evaluated out-of-sample. If we compare out-of-sample performance instead, the combined model performs similarly to the best individual platform ($r = 0.45$), while the individual platforms get IMDb: $r = 0.42$; Rotten Tomatoes: $r = 0.42$; Metacritic: $r = 0.41$; and TMDb users: $r = 0.47$. That said, the confidence intervals overlap substantially, so I wouldn’t put much weight on the apparent differences.
Of course, I’d be remiss if I didn’t consider the possibility that there’s some latent trait of “general movie quality” or “public/critical regard” that each site measures imperfectly. Instead of treating the platforms as separate predictors, another approach is to treat them as noisy measures of a shared latent factor. So how well do the latent scores predict my ratings? I extracted a one-factor model from the standardized platform ratings and used the resulting factor scores as predictors.
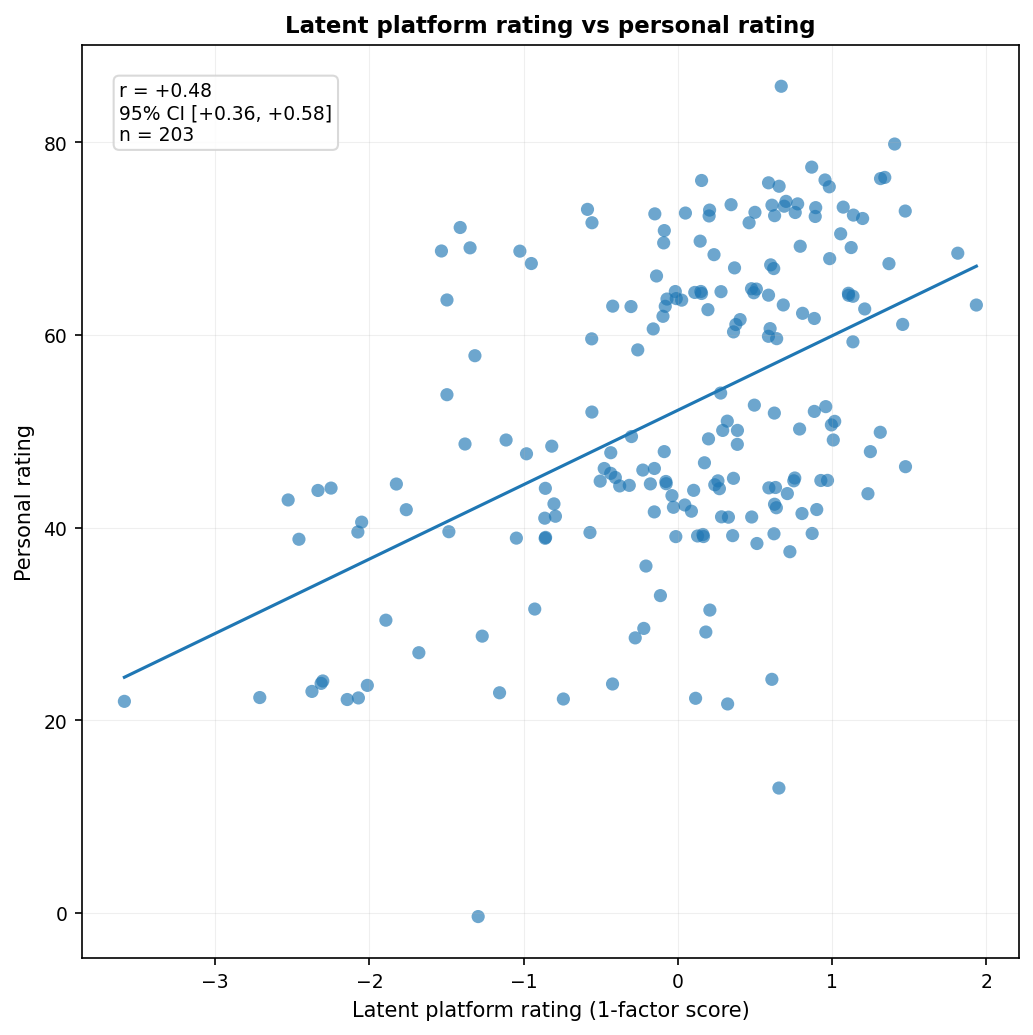
The latent factor predicts my ratings about as well as the best individual platform in-sample, though it performs worse out-of-sample ($r = 0.42$).
Also, here are the loadings:
| Platform | Loading |
|---|---|
| IMDb | +0.97 |
| TMDb - Users | +0.94 |
| Rotten Tomatoes - Critics | +0.84 |
| Metacritic | +0.84 |
The user-rating platforms load more strongly on the common factor than the critic-rating platforms, which suggests that this one-factor solution is weighted somewhat more toward public reception than pure critical reception.
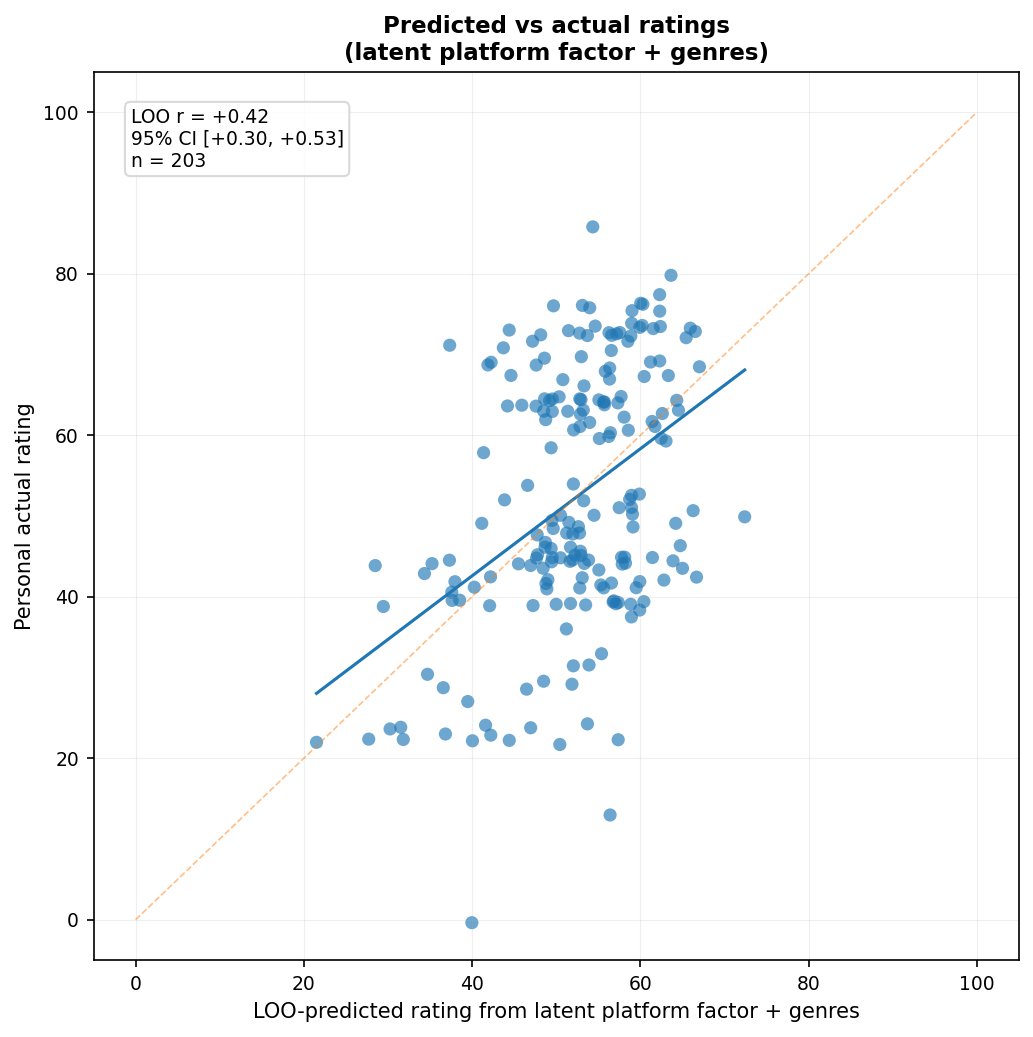
Do Genres Help? (No)
Of course, there’s the problem of genres. Perhaps external ratings have biases for or against different genres that I don’t share. I’ll want to control for genres and see if that improves things. So, what does the multiplatform prediction look like if we add genre information?
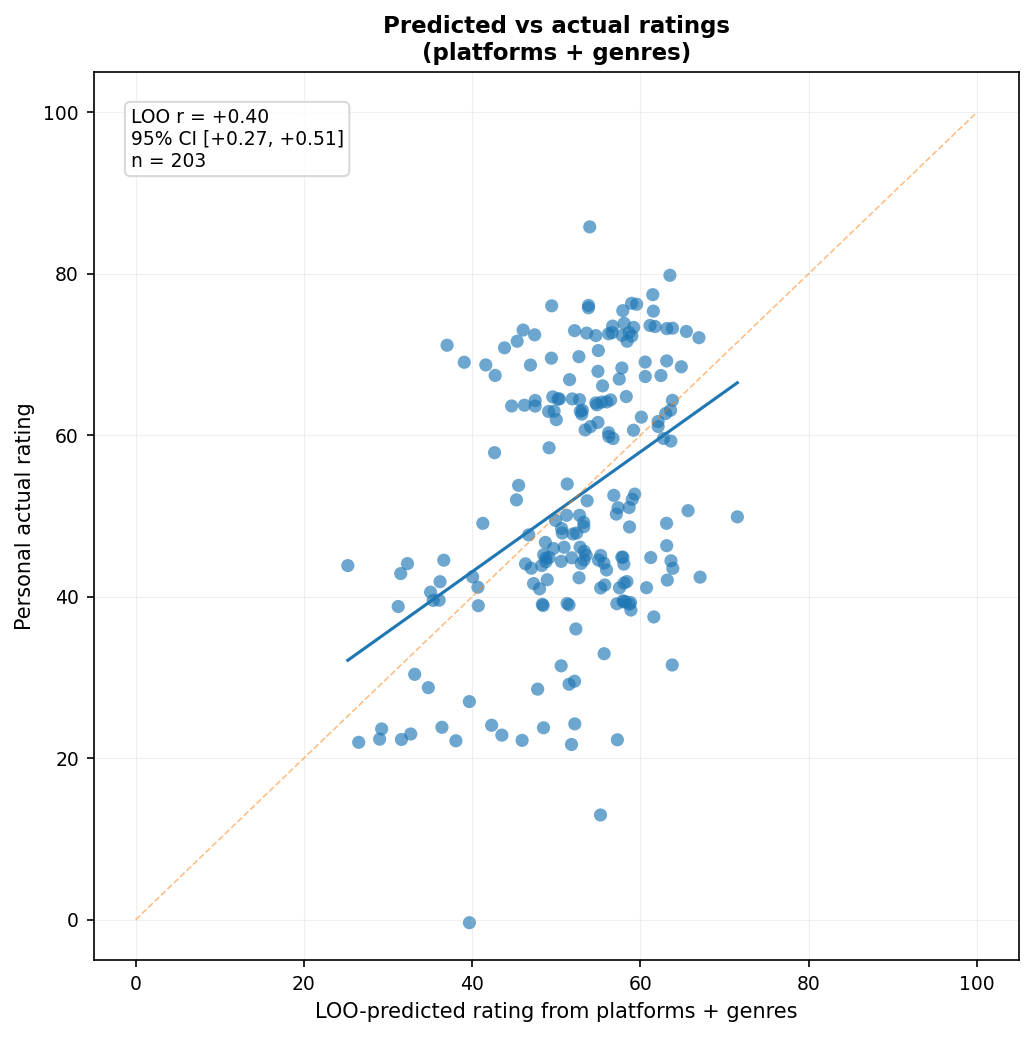
Adding genre information4 did not produce evidence of improved performance. The multiplatform model had $r = 0.45$, 95% CI $[0.33, 0.55]$; with genres added, it fell to $r = 0.40$, 95% CI $[0.27, 0.51]$. Since the intervals overlap substantially, I wouldn’t put much weight on the apparent decline, but there’s no evidence here that adding broad genre information helps. The same thing happens if genre information is added to the latent-factor model:
Are Movies Getting Better or Worse?
Are movies getting better or worse over time? I don’t know. Other people have looked into this, but the answer is mostly irrelevant for my purposes. I don’t care whether other people like recent movies more or less. I care whether I like recent movies more or less.
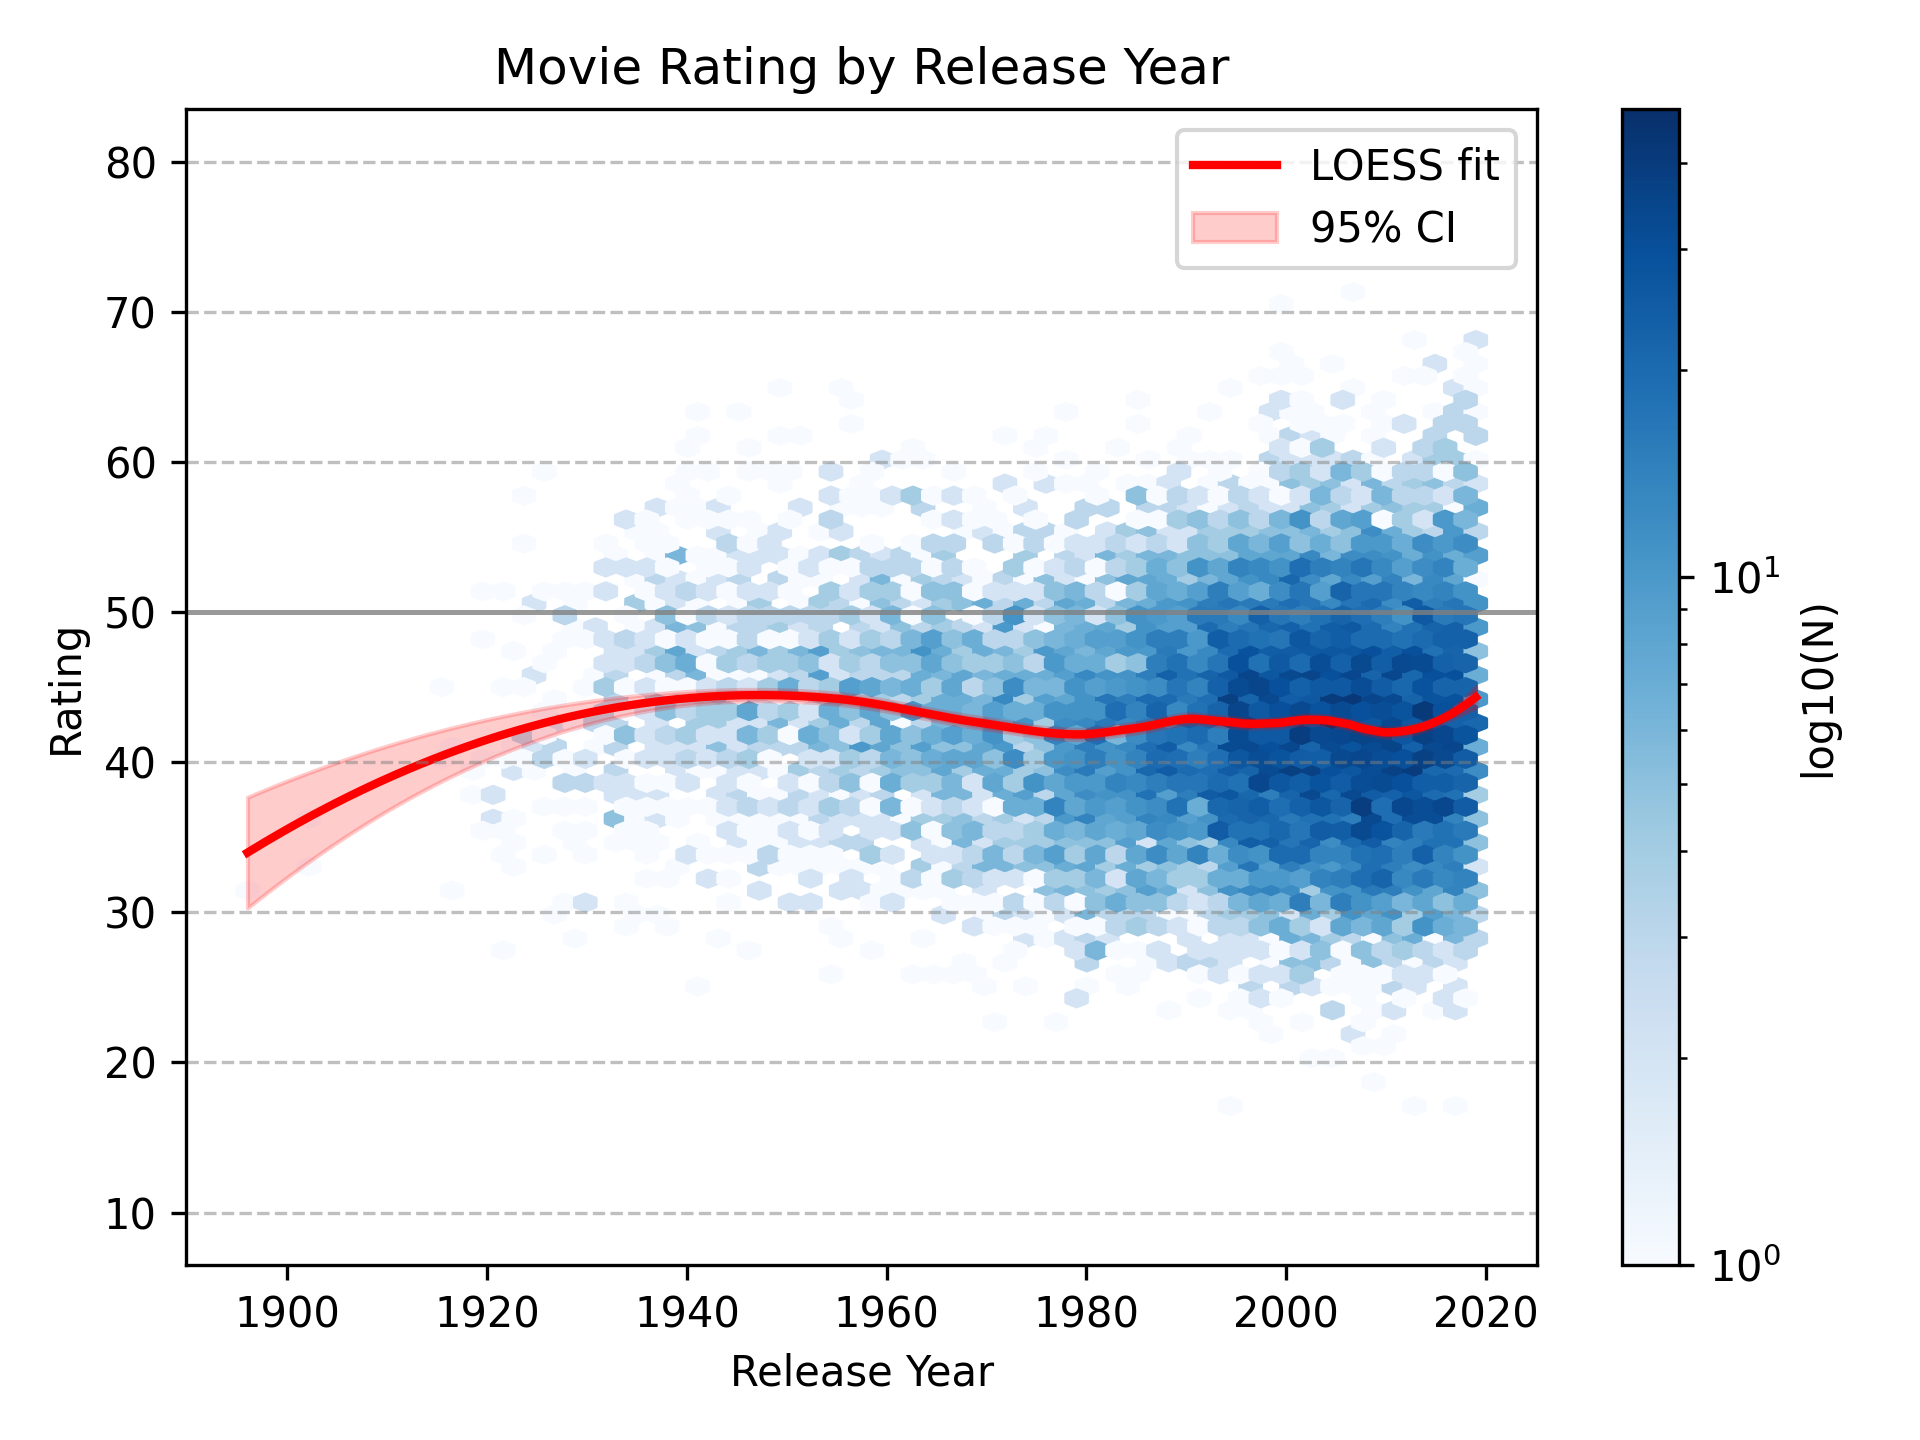
I graph predicted ratings by year instead of actual ratings by year to reduce selection bias in which movies I actually watch. For example, most of the old movies I’ve watched have been with friends who have good taste in movies, so they’re selected to be among the better old movies. Conversely, many recent movies are movies I watched when I was young and had little control over what I watched, or when I had nothing better to do. Those movies might have been popular, but that doesn’t mean they were good.
That said, this doesn’t eliminate selection bias entirely, since the model is still trained on the movies I chose to watch. If I’ve mostly watched unusually good old movies, then the model may learn that old-movie-associated features predict high ratings, even if the average old movie would not actually be unusually good for me.
Overall, release year doesn’t seem to matter much. The dip in the very early 1900s is probably due to me watching Arrival of a Train, a very early film that isn’t that interesting. It is, literally, just a train arriving at a station.
Things I Still Want to Know
It’s nice to see that the recsys works. Though, to make it work better, I’d have to watch a lot more movies, which is unfortunate. The external movie raters aren’t as good, but serviceable enough for recent movies. Anyway, I have more questions that I may eventually answer someday:
- It seems all the regression methods have roughly the same level of predictiveness. But perhaps I just haven’t looked hard enough? Maybe I need to use neural networks? Or a GP using ARD? Or something else?
- What is the maximum amount of rating-relevant information it’s possible to capture from the embeddings in principle?
- What’s the decay rate of movie enjoyment? It doesn’t make sense to compare movie instances (while it does make sense to compare movies), so I’d have to figure out the best number of Likert scale items to use.
- If I used more external rating sites, would there still be a single factor? Or would there be two very correlated factors associated with critics vs the public?
Appendix
Other Measures of Accuracy vs Training Set Size
-
So, how did I do this? For each set size, for each movie, I got a random set of movies (excluding the chosen movie), fit a regression to those movies and ratings, predicted the rating of the chosen movie, then calculated the accuracy statistics. ↩
-
This is interesting, since these are different accuracy metrics on different scales, yet they show roughly the same pattern. ↩
-
Jonatan Pallesen has also compared his movie ratings against external movie sources and found that the correlations differ by a lot (Rotten Tomatoes - Audience: r = 0.24; Rotten Tomatoes - Critics: r = 0.36; IMDb: r = 0.45; criticker.com PSI: r = 0.69). I don’t know why his correlations are so heterogenous. Also, perhaps I should try Criticker. ↩
-
I encoded genres as broad, multi-hot indicators, so a movie could belong to multiple genres. ↩