Accurate IQ Estimates By College Major
There’s this popular chart that’s been floating around the internet for years, supposedly showing the average IQ of college students by major.
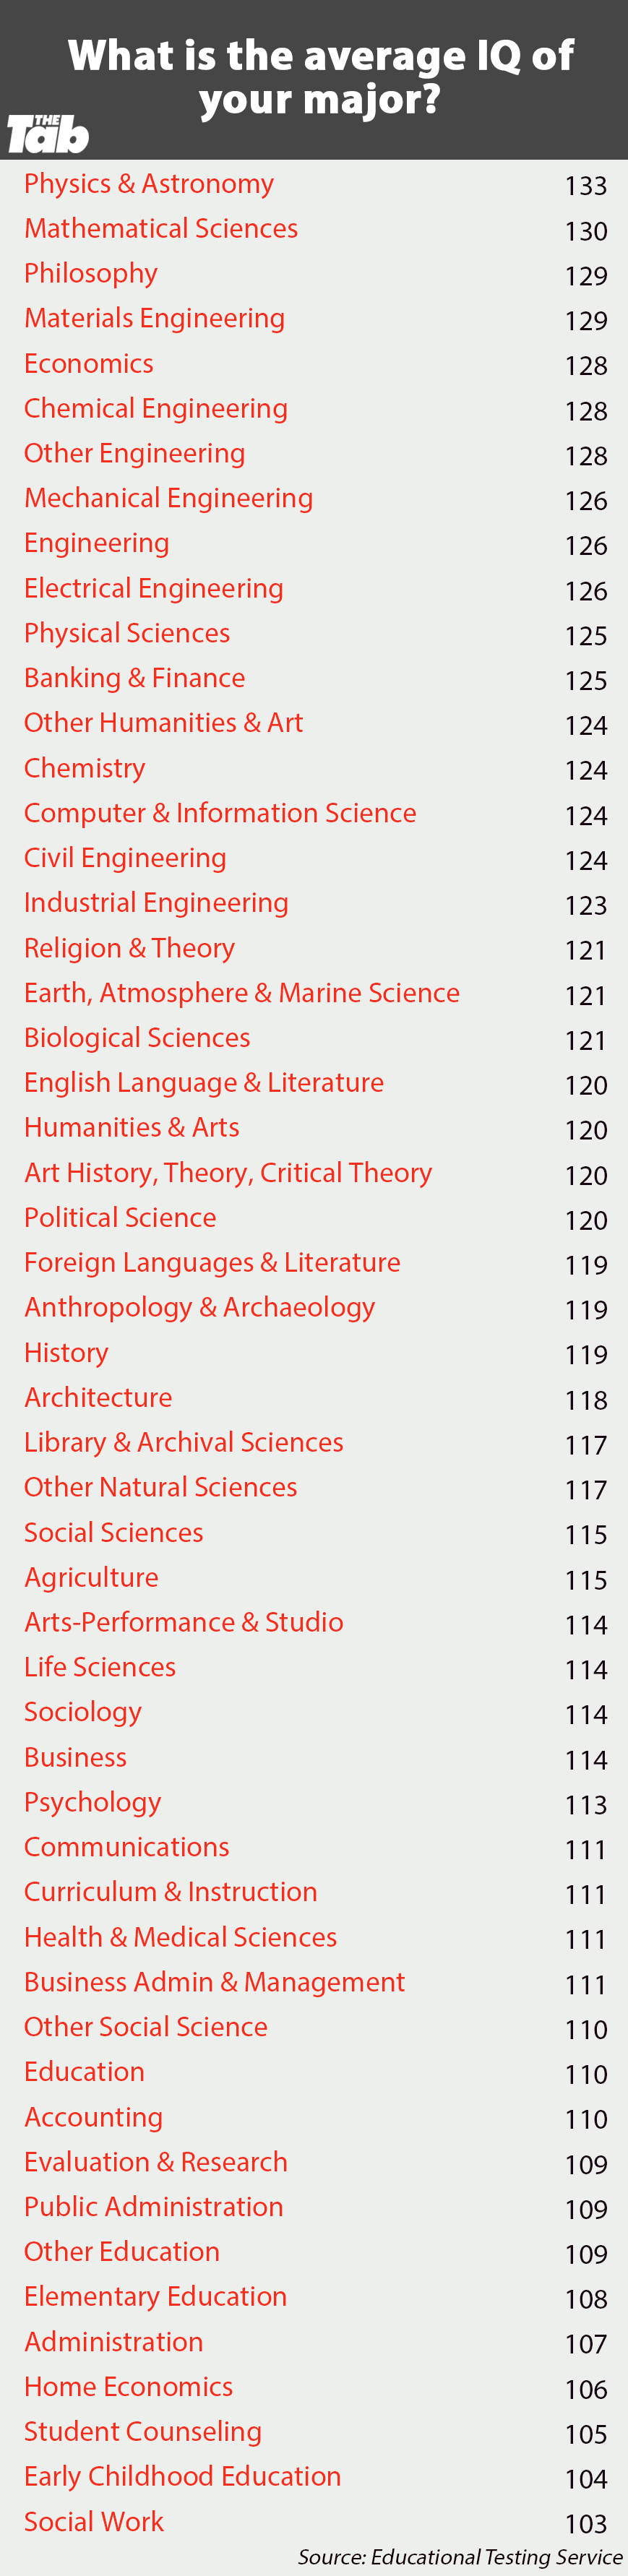
After investigating, I found that the original data comes from Statistic Brain, which estimated IQ using 2006 GRE scores. The GRE data itself seems accurate, matching other records from around that time of GRE scores by college major, but the methodology used to convert GRE scores to IQ has two serious errors:
- Incorrect Standard Deviation Assumption: The original analysis assumes a standard deviation on the GRE corresponds to 22 IQ points, which not only ignores regression toward the mean, but assumes the opposite, yielding extreme estimates.
- Overestimated Mean IQ: The analysis assumes GRE test-takers have an average IQ of 115 which is likely too high; a mean of 112 (consistent with Master’s degree holders) is more plausible.
A Better Estimation Method
To accurately estimate IQ by major, I use the following assumptions:
- GRE-IQ correlation: 0.7 (based on typical correlations between IQ and standardized tests)
- Mean IQ of GRE test-takers: 112 (consistent with estimates for Master’s degree holders).
- IQ standard deviation for GRE test-takers: 12 (slightly higher than the observed variance found for Master’s degree holders).
- Quant-Verbal correlation: 0.35 (per ETS data).
I also account for:
- Ceiling effects: Some majors (e.g., Mathematical Sciences) have many test-takers achieve the maximum score on some GRE sections, lowering the estimate of their IQs.
- Floor effects: Other majors (e.g. Early Childhood Education) have many test-takers achieve scores that are lower than should be achievable by chance.
Results1
| Major | IQ |
|---|---|
| Mathematical Sciences | 119 |
| Physics & Astronomy | 118 |
| Economics | 118 |
| Materials Engineering | 117 |
| Philosophy | 117 |
| Banking & Finance | 117 |
| Chemical Engineering | 116 |
| Engineering — Other | 116 |
| Computer & Information Sciences | 115 |
| Political Science | 115 |
| Electrical & Electronics Engineering | 114 |
| Humanities & Arts - Other | 114 |
| Chemistry | 114 |
| Mechanical Engineering | 114 |
| Arts — History, Theory, & Criticism | 114 |
| Law | 114 |
| Foreign Languages & Literatures | 114 |
| Industrial Engineering | 114 |
| Religion & Theology | 113 |
| Earth, Atmospheric, & Marine Sciences | 113 |
| Business - Other | 113 |
| Business Admin & Management | 113 |
| Civil Engineering | 113 |
| Library & Archival Sciences | 112 |
| Biological & Biomedical Sciences | 112 |
| English Language & Literature | 112 |
| Accounting | 112 |
| History | 112 |
| Architecture & Environmental Design | 112 |
| Arts — Performance & Studio | 112 |
| Education - Secondary | 111 |
| Anthropology & Archaeology | 111 |
| Public Administration | 111 |
| Sociology | 111 |
| Education - Other | 110 |
| Agriculture, Natural Res. & Conservation | 110 |
| Communications & Journalism | 110 |
| Education - Higher | 109 |
| Social & Behavioral Sciences - Other | 109 |
| Psychology | 109 |
| Natural Sciences — Other | 109 |
| Health & Medical Sciences | 108 |
| Education - Curriculum & Instruction | 108 |
| Education - Evaluation & Research | 108 |
| Education - Administration | 108 |
| Family & Consumer Sciences | 107 |
| Education - Elementary | 106 |
| Education - Student Counseling & Personnel Services | 105 |
| Social Work | 105 |
| Education - Special | 104 |
| Education - Early Childhood | 103 |
Notes on Data Sources
The Statistic Brain article erroneously refers to “SAT” scores, but the categories and values align with GRE data. The 2006 GRE scores are consistent with historical ETS reports, so the raw data is likely reliable—only the IQ conversion is problematic.
-
Based on 2018-2021 score distributions ↩