Galaxy-Brained Explanations
I keep seeing experts offer elaborate causal stories for phenomena that have a much simpler and more proximate explanation. The complicated account is often interesting to hear, but the simple one usually suffices to explain the observed facts. Below, I provide examples.
Japan’s Lower-Than-Average GDP Per Capita Growth
Over the past few decades, Japan’s per-capita GDP growth has lagged behind other developed countries. Kenneth Rogoff (former Chief Economist of the International Monetary Fund), in an interview with Dwarkesh Patel, provides an elaborate story:
In 1985, the US pressured Japan to rapidly strengthen the yen and liberalize its financial markets through the Plaza Accord.
The yen doubled in value in just 3 years. To offset the economic shock, Japan slashed interest rates and flooded the economy with cheap credit.
Japanese banks, suddenly freed from decades of tight regulation, went on a lending spree. They poured money into real estate and stocks with little risk assessment. Japan’s stock market became worth more than the US stock market despite having half the population. The total value of Japanese real estate was 4 times the value of all US real estate.
When the bubble burst in 1991, banks were left with massive bad loans. The entire financial system seized up, creating a “lost decade” of deflation and stagnation.
[…] Rogoff estimates Japan would be 50% wealthier per person today without this crisis.
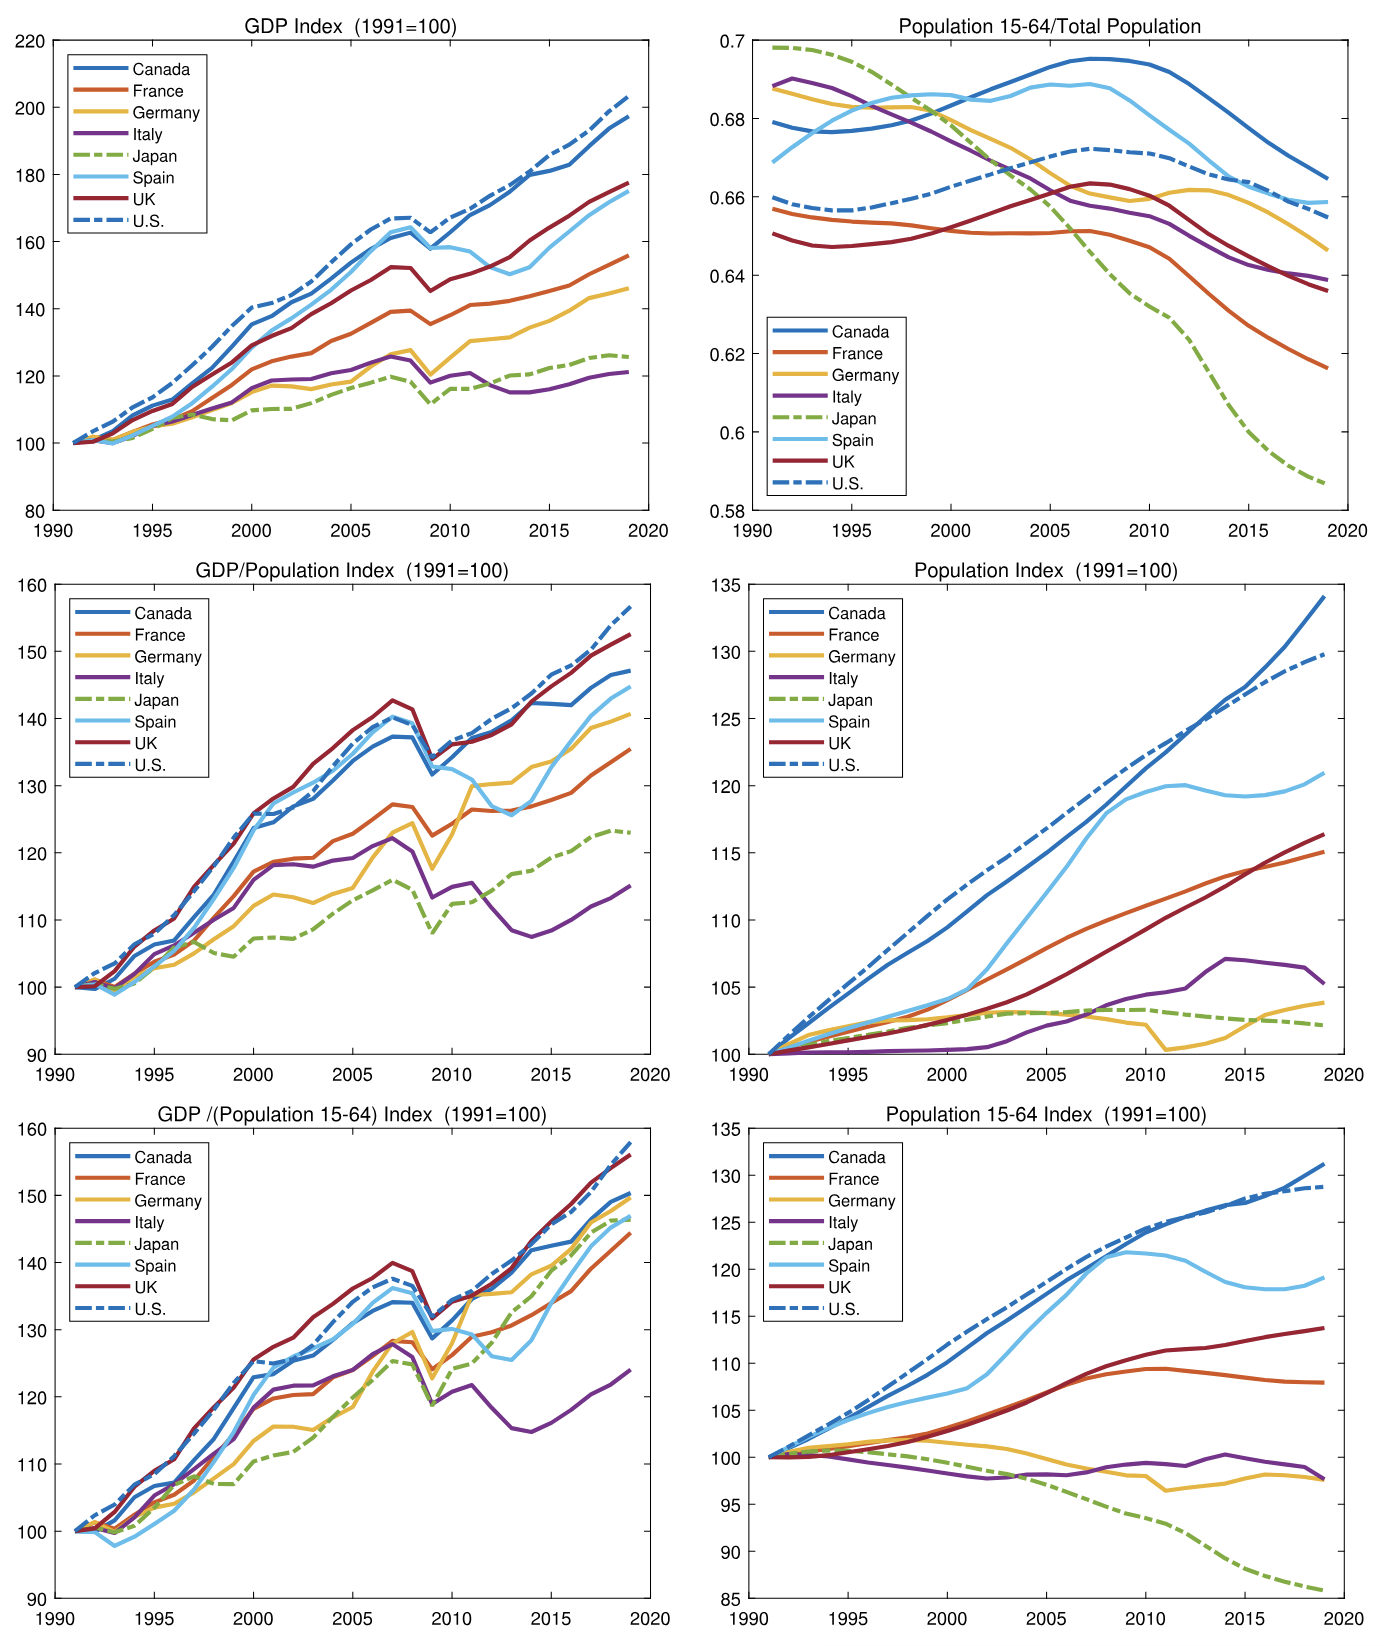
What’s interesting is that we don’t need such a complicated story to explain Japan’s lackluster growth. There’s a much simpler explanation: Japan has lower per-capita GDP growth because it has fewer workers per capita (due to the age of its population). Once you control for the age distribution, Japan’s per-worker GDP growth is unremarkable1. There’s no need to blame the Plaza Accord, and it’s highly dubious Japan would have had an additional 50% per-capita GDP growth without it. Just look at the graphs.
The Effectiveness of Burrows’s Delta
Burrows’s Delta is a simple stylometric measure used for authorship attribution. The method converts raw word frequencies into standardized scores and computes a distance between documents. In his paper, Interpreting Burrows’s Delta: Geometric and Probabilistic Foundations, Shlomo Argamon offers a complex statistical explanation for the effectiveness of Burrows’s Delta. Modeling documents as multivariate Gaussian (or Laplace) distributions, he shows that choosing the nearest candidate document is equivalent to choosing the highest-probability candidate under the distribution.
But the truth of Burrows’s Delta is much simpler. The authors of Understanding and explaining Delta measures for authorship attribution show that ternarization is highly effective and robust technique. For each feature the method asks, “do these two documents both use the word above average, below average, or about average?” Adding up those per-word agreements and disagreements yields strong signal for authorship. All other variants of Burrows’s Delta can be viewed as approximations for this method.
The Effectiveness of Improper Linear Models
The Robust Beauty of Improper Linear Models in Decision Making focuses on (what else?) improper linear models. A proper linear model is one in which the weights are derived by optimizing some criterion. Examples include simple linear regression, discriminant function analysis, and ridge regression. An improper linear model uses non-optimal weights. The weights may be chosen to be equal, on the basis of a person’s intuition, or even at random.
One possible way of building an improper linear model is through the use of bootstrapping. The process involves building a proper linear model of an expert’s judgments about an outcome criterion and then to use that linear model in place of the judge. Such a model can be said to be a paramorphic representation of the judge. Why does bootstrapping work? One proposed reason was that a linear model distills underlying policy (in the implicit weights) from otherwise variable behavior. That is, bootstrapping works because the linear model catches the essence of the judge’s valid expertise while eliminating unreliability.
However, when experiments were performed, paramorphic models performed about as well as random linear models (that is, models where the weights were randomly chosen from $\mathcal{N}(0,1)$ and the signs were determined on an a priori basis). Equal-weighting models performed even better. The truth, it seems, is that linear models are robust over deviations from optimal weighting. That is, the solution to the problem of obtaining optimal weights in one that has a (rather broad) “flat maximum”. Weights that are near-optimal (and this includes a lot of weights) provide almost the same performance as optimal weights.
-
Jesús Fernández-Villaverde, Gustavo Ventura, and Wen Yao, “The Wealth of Working Nations,” NBER Working Paper 31914 (2023), https://doi.org/10.3386/w31914. ↩