Intelligence, Tilt, and Gender Across College Majors
Graphing the relationship between the average intelligence and math/verbal tilt of the intended majors of GRE test-takers reveals a striking pattern: low-IQ math-tilted majors are nearly absent.
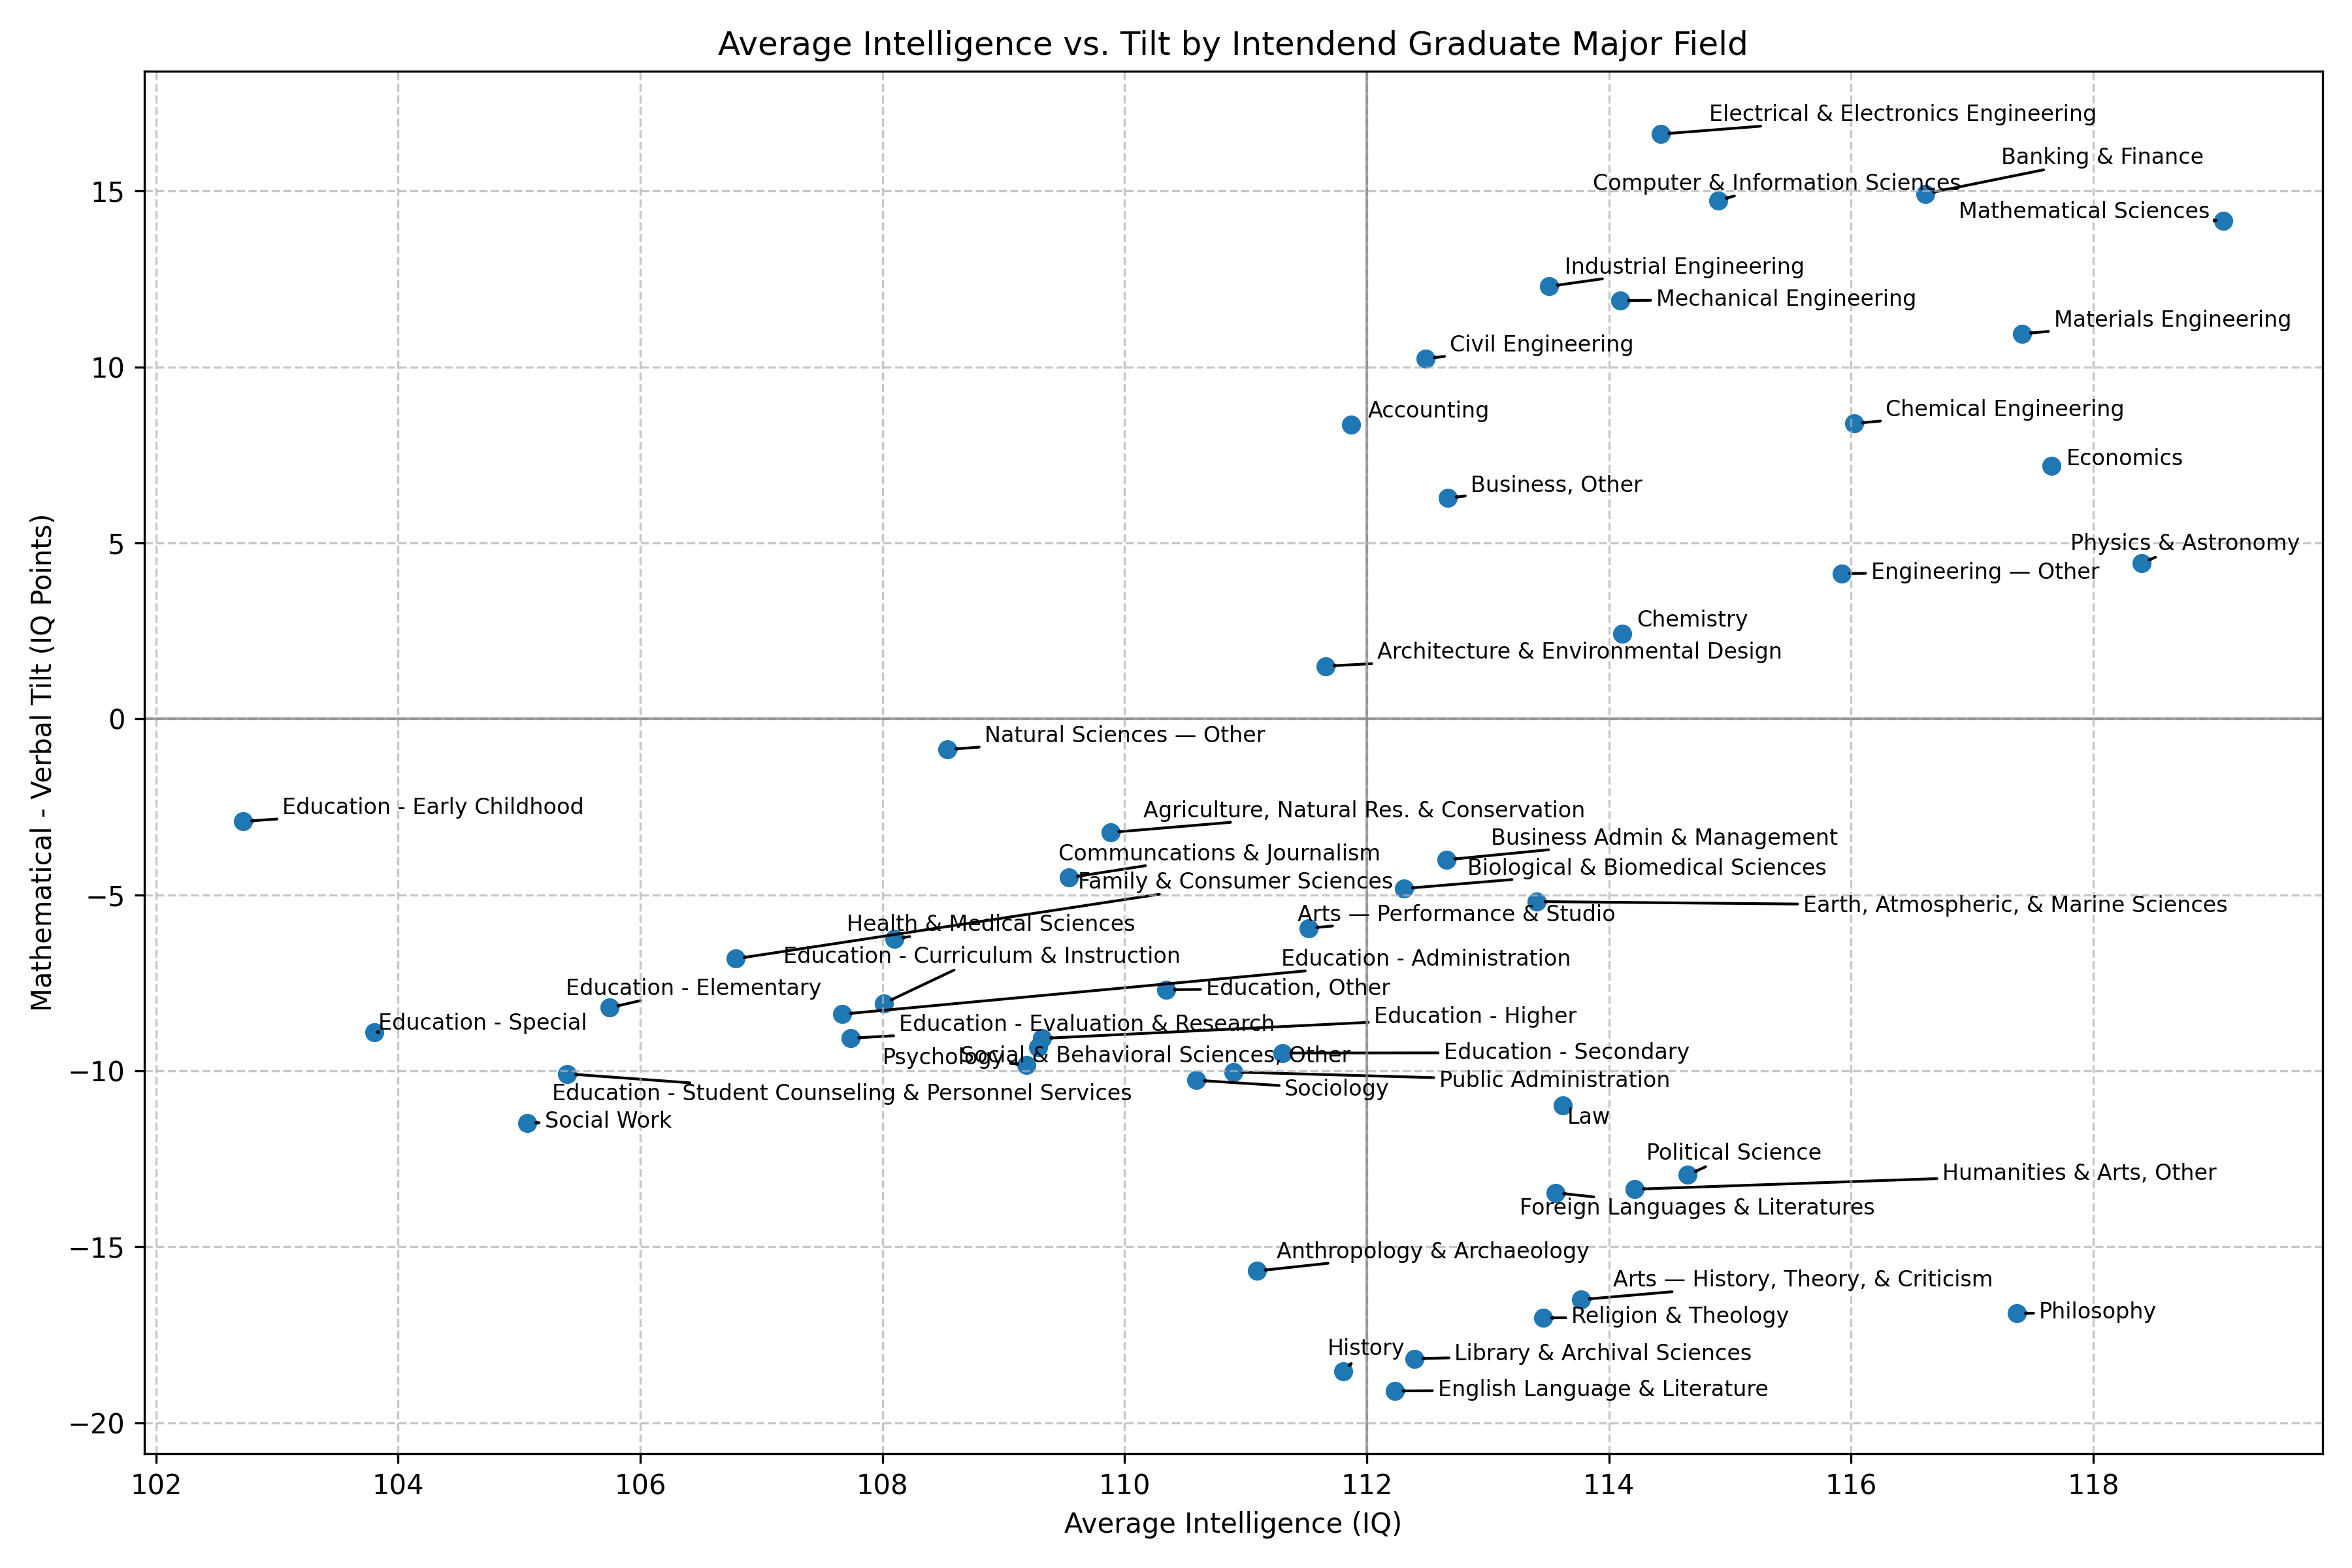
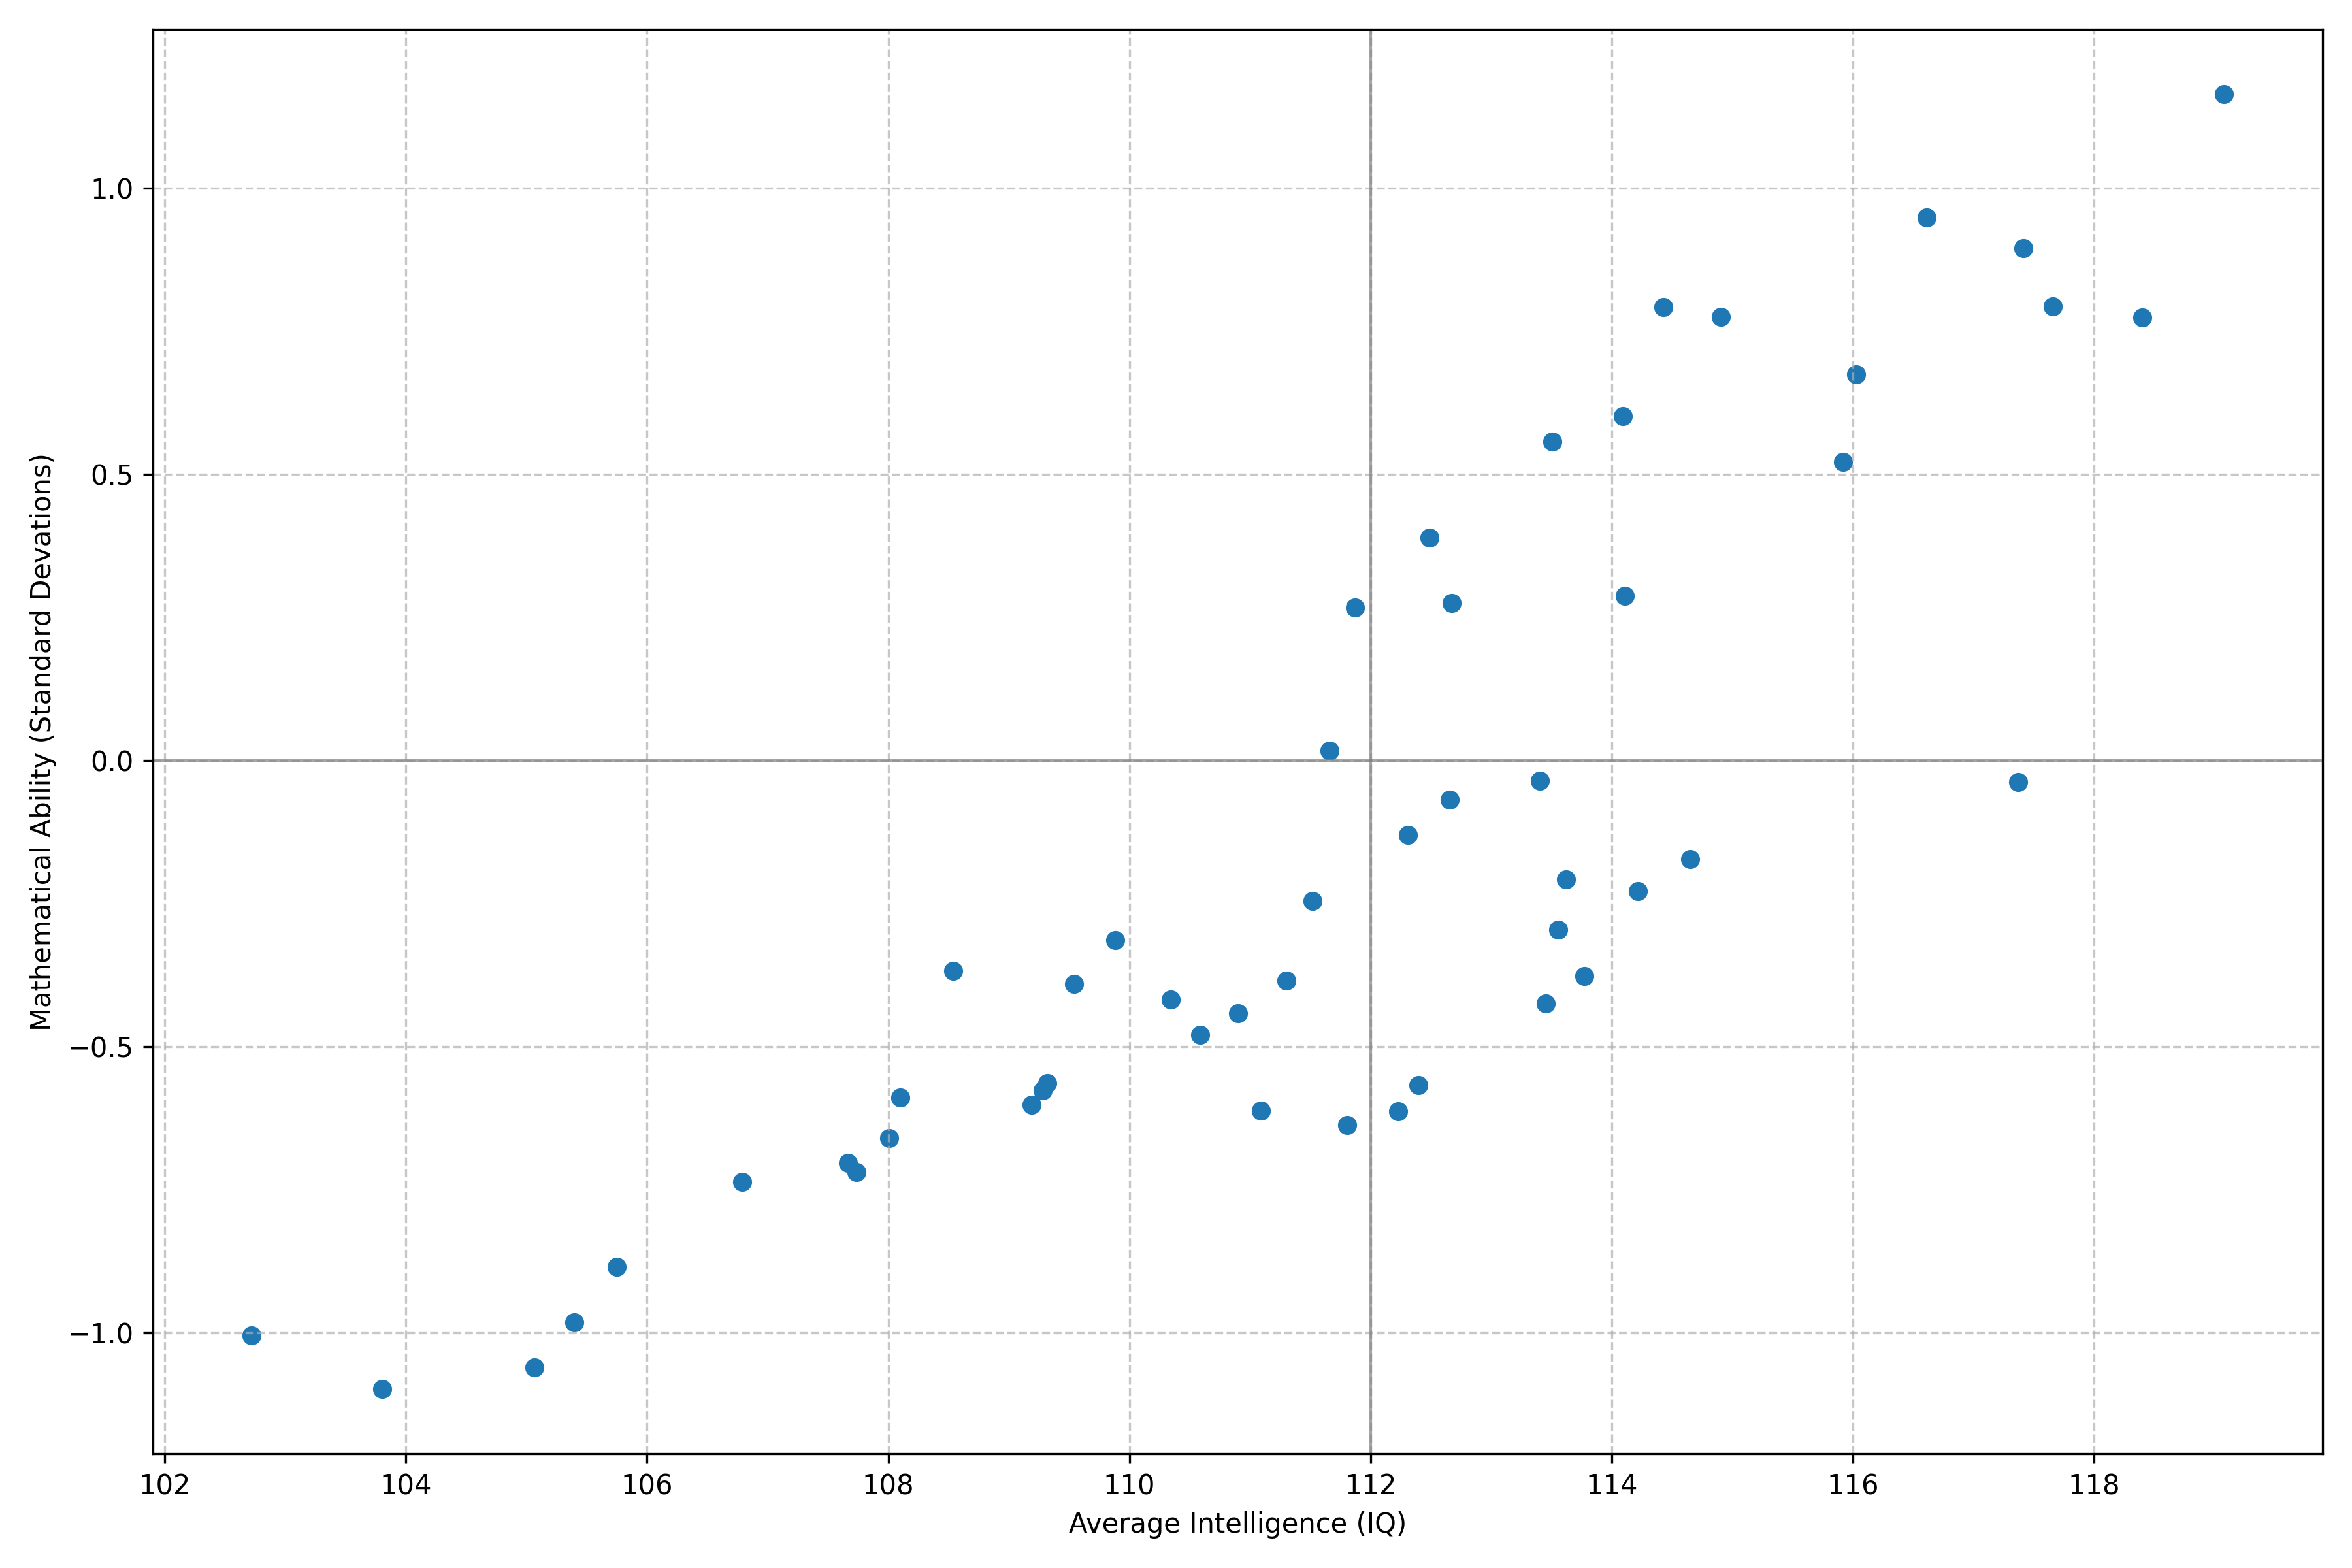
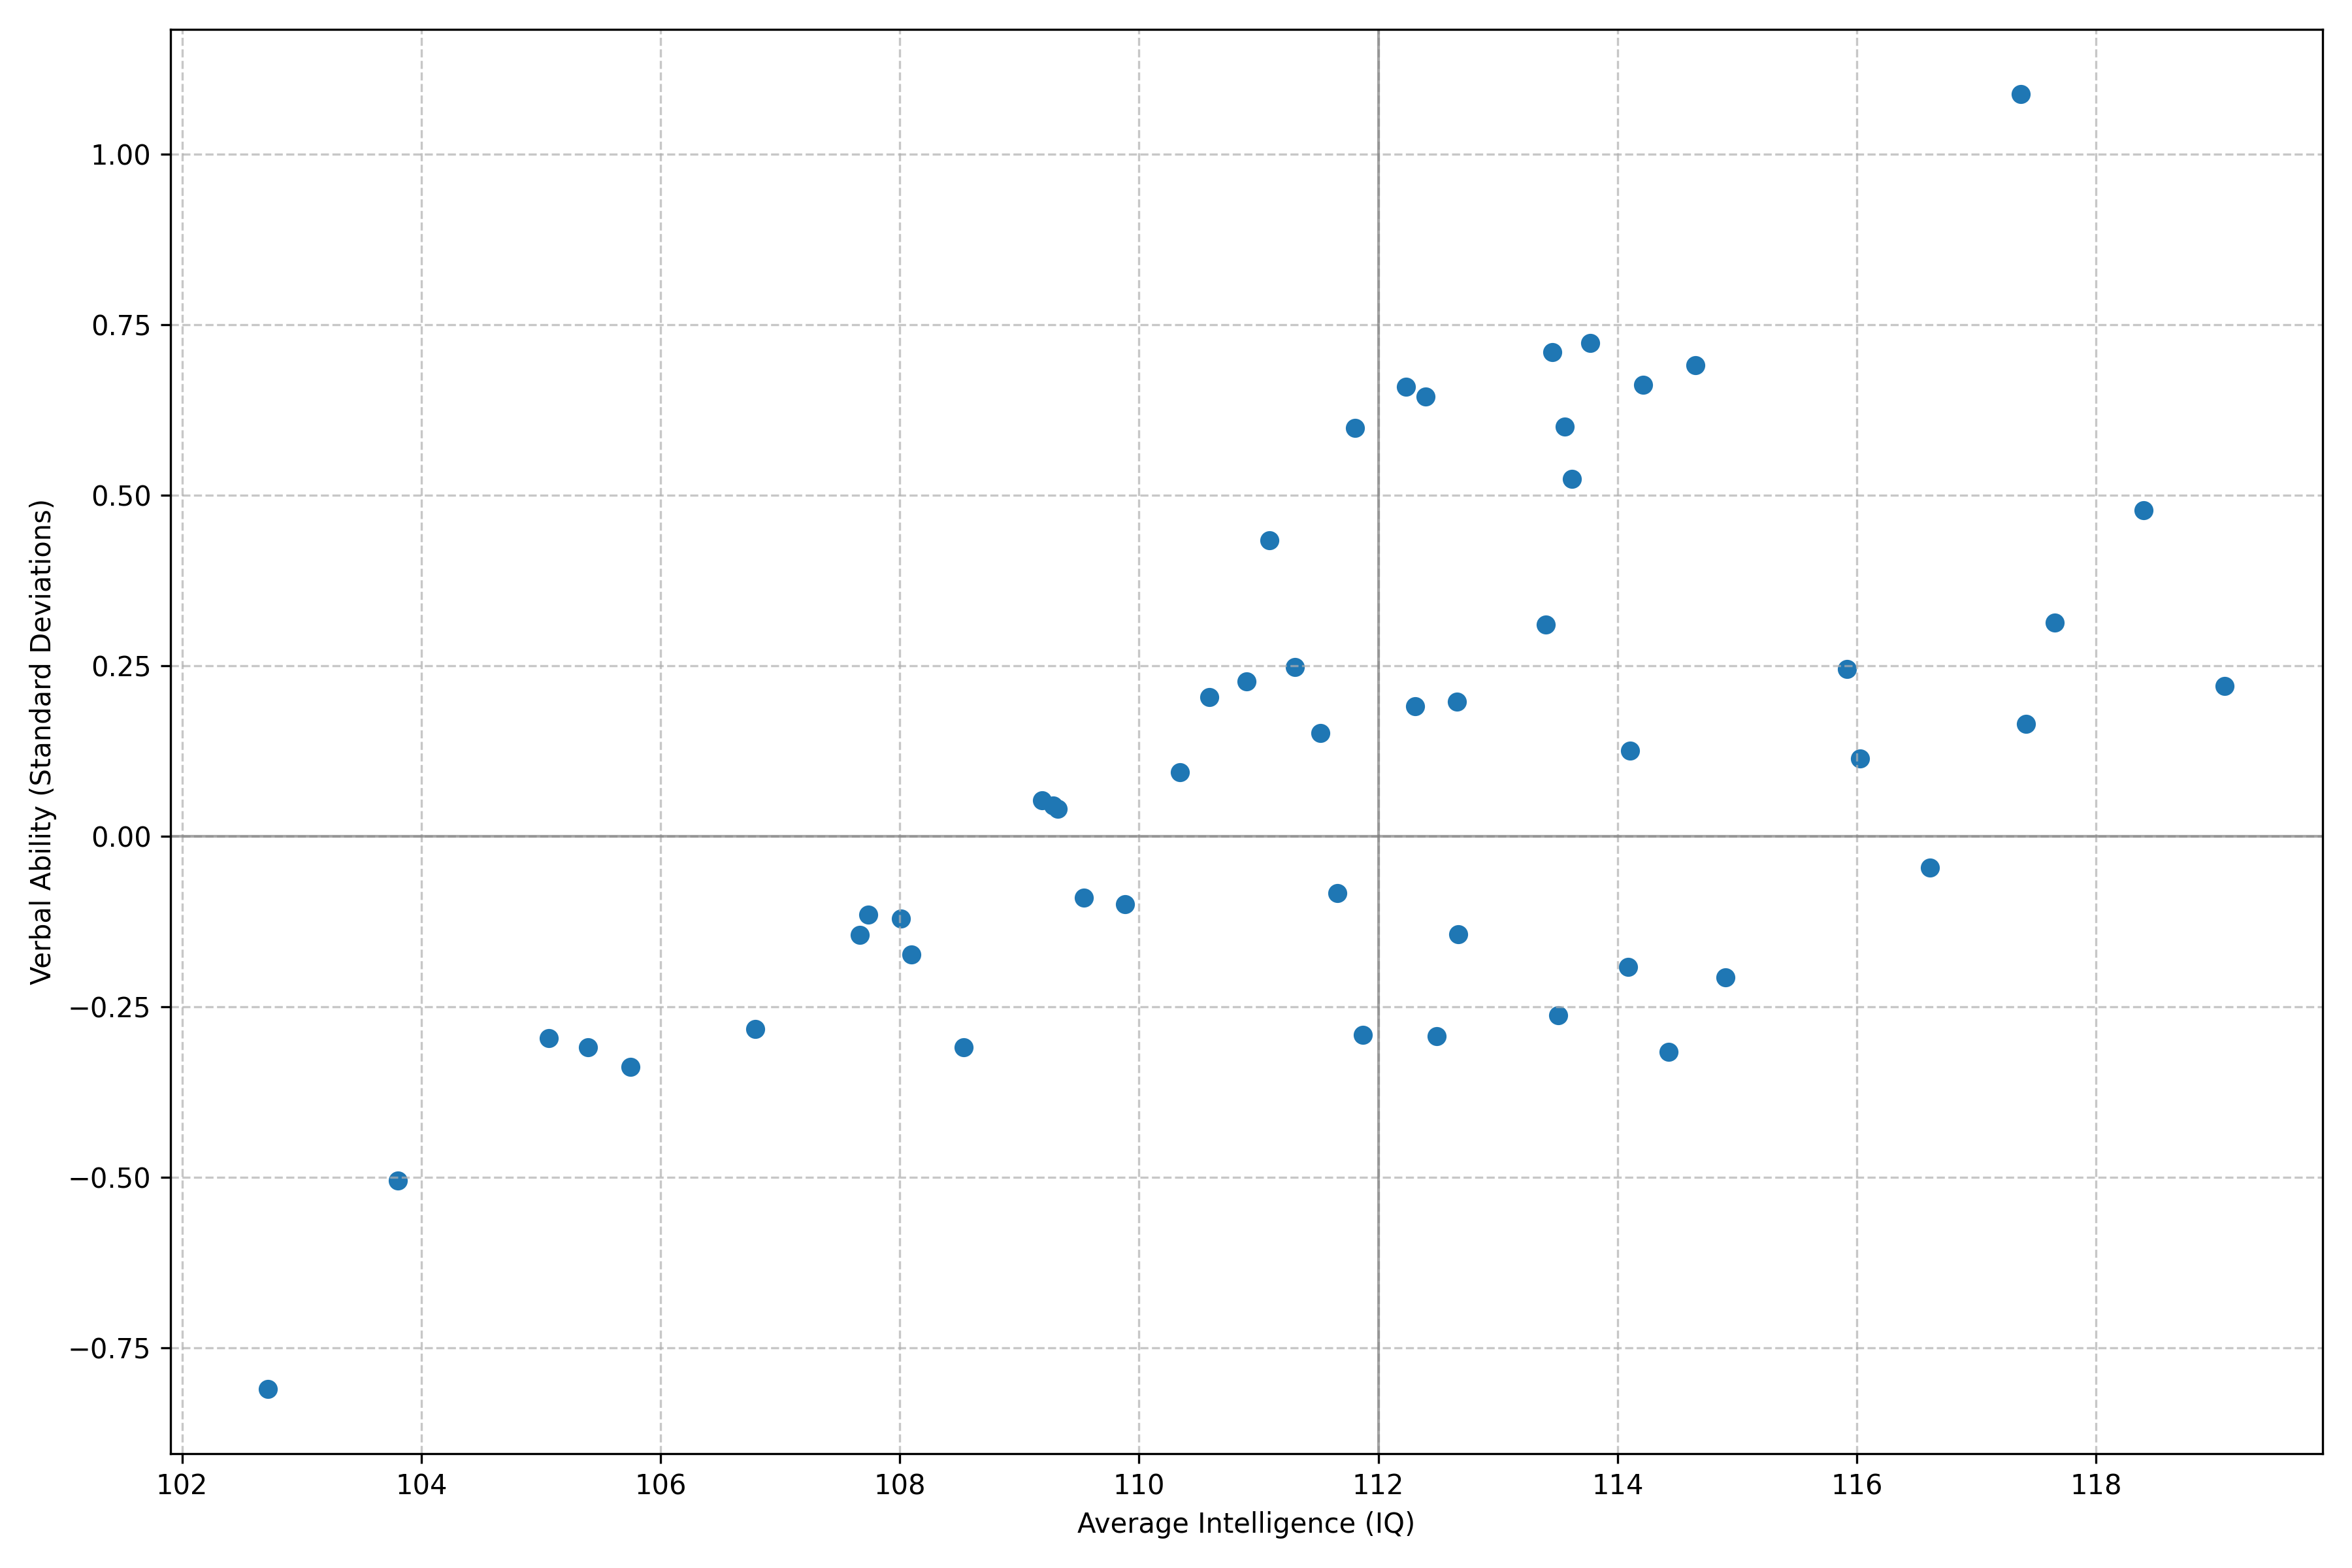
Additionally, among intended majors, average math ability correlates more strongly with average intelligence than average verbal ability does. The correlation between average intelligence and average math ability is 0.86, whereas the correlation between average intelligence and average verbal ability is 0.60—even though the intelligence calculation weighs math ability and verbal ability equally.
Tilt—the difference between math and verbal scores—cleanly separates high-math-ability and low-math-ability majors. Every high-math-ability major is math-tilted, and every low-math-ability major is verbal-tilted. The average math ability of a major correlates with its average math tilt at 0.83.
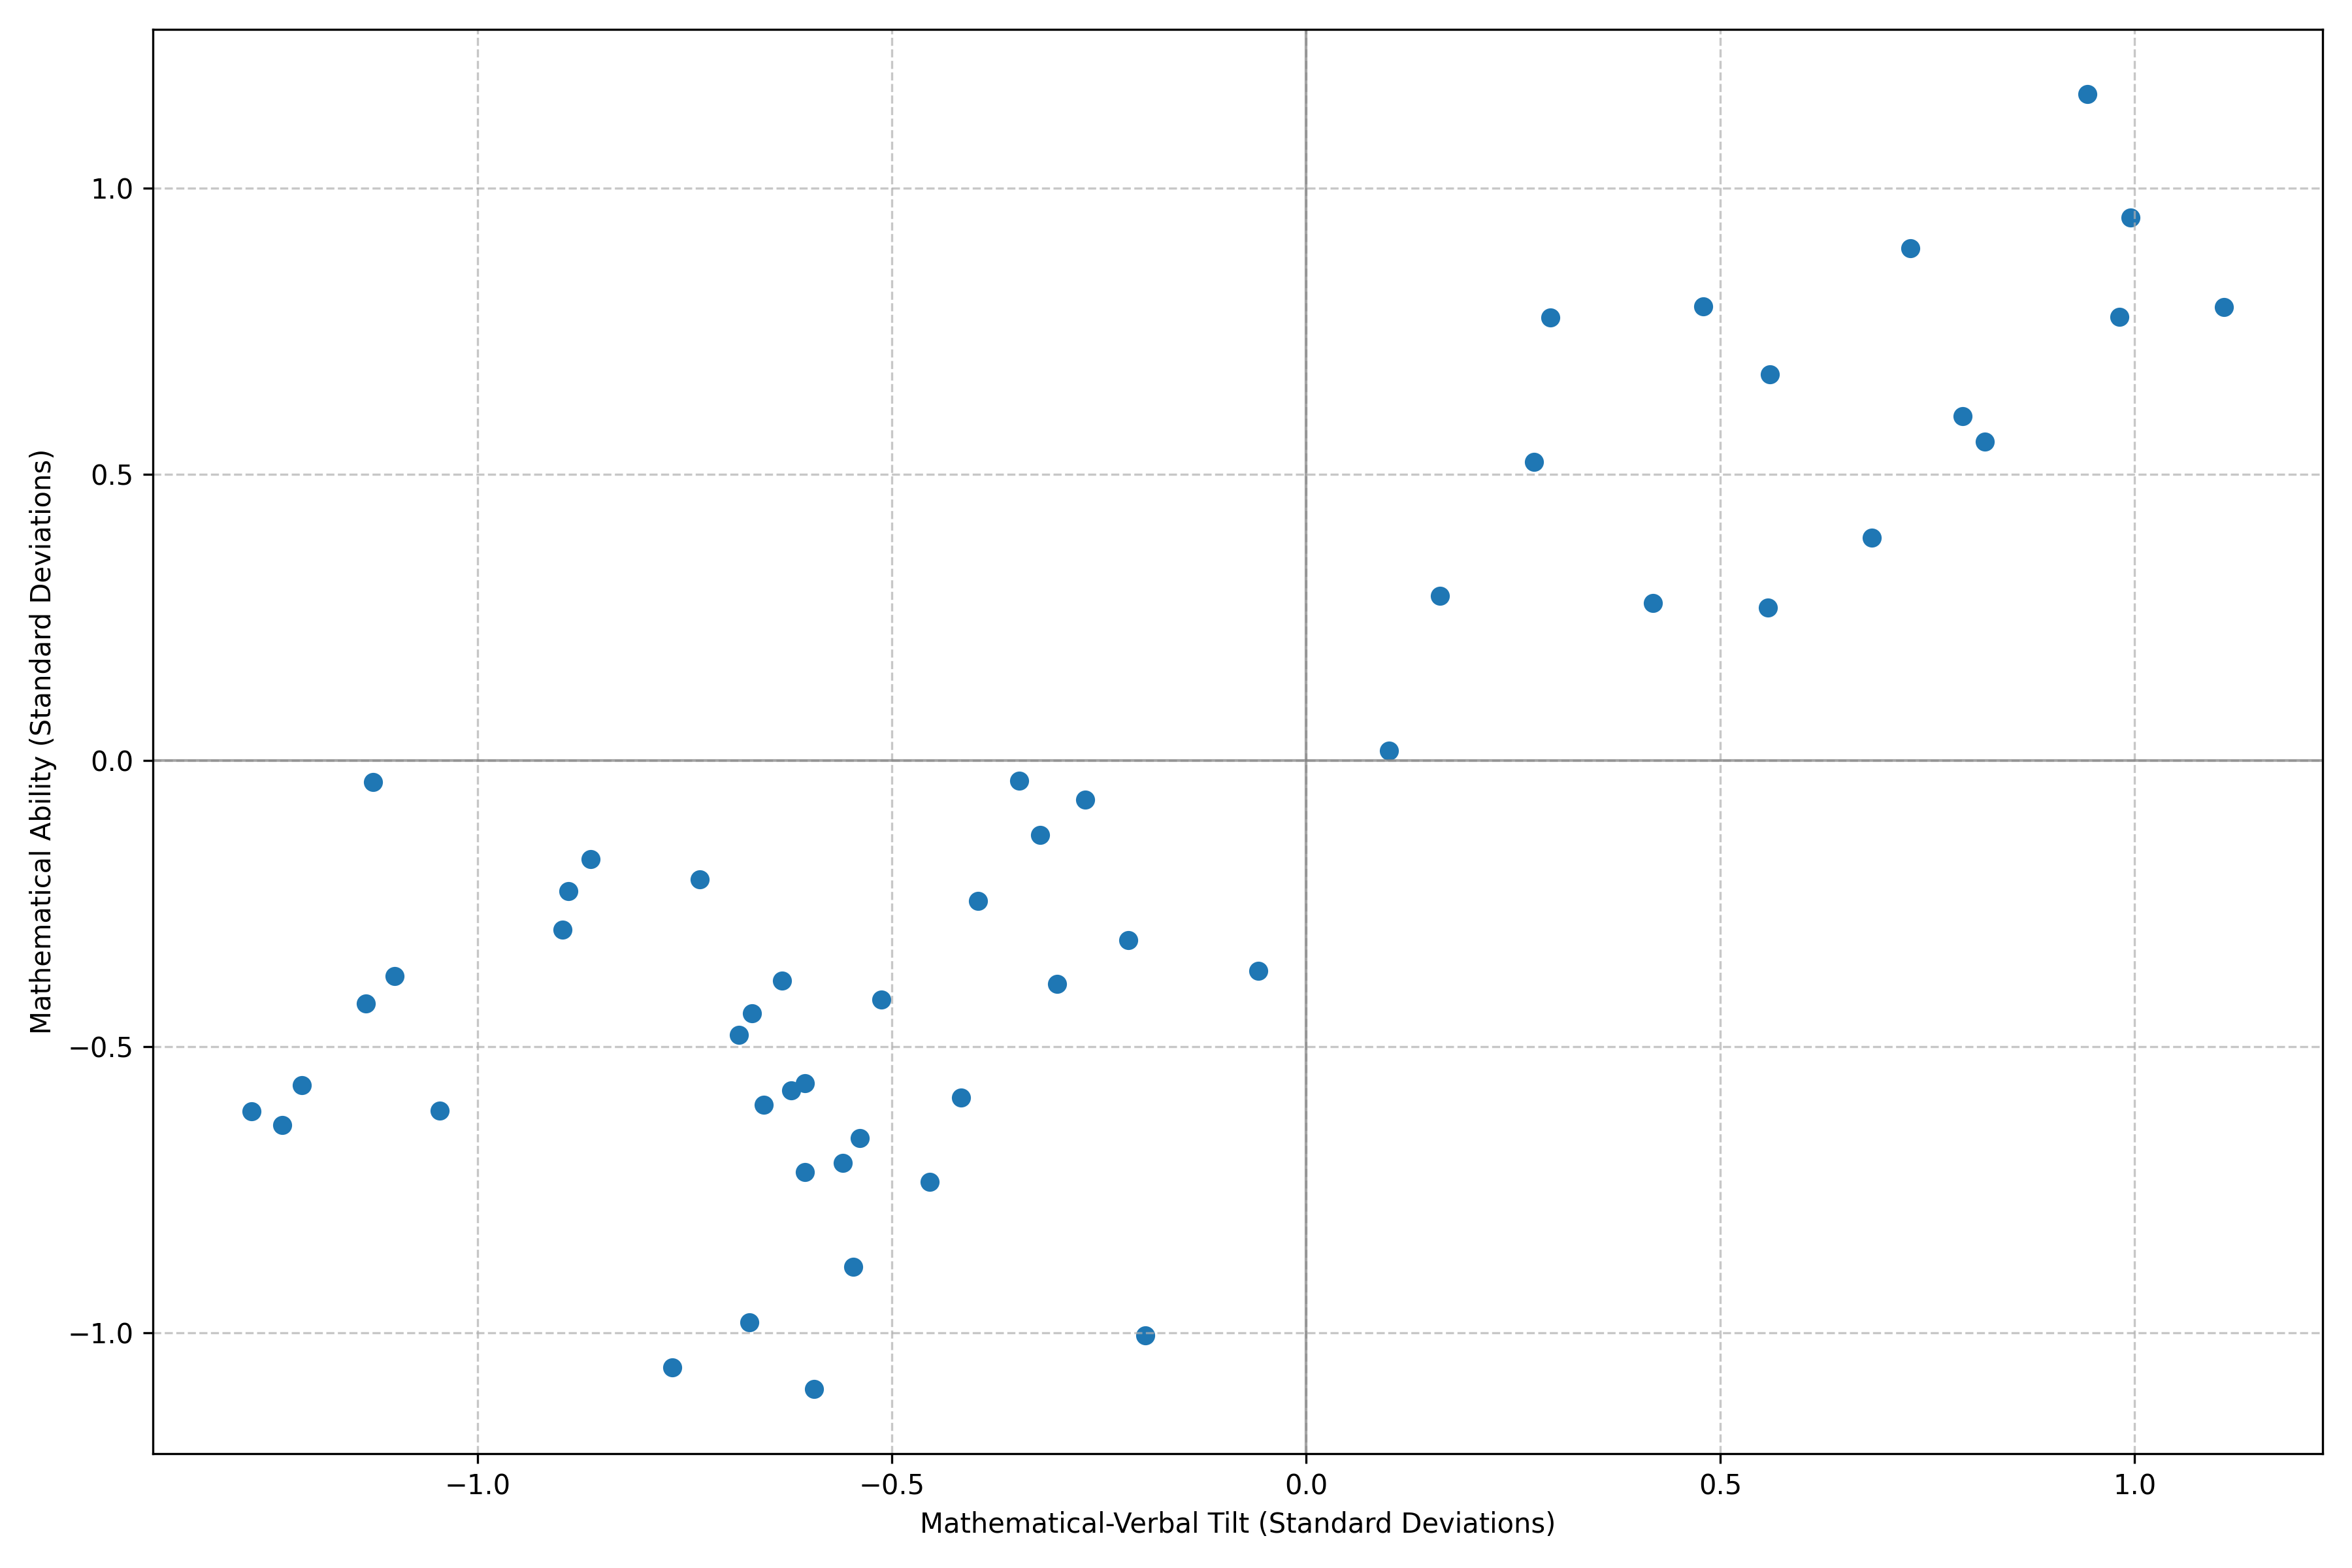
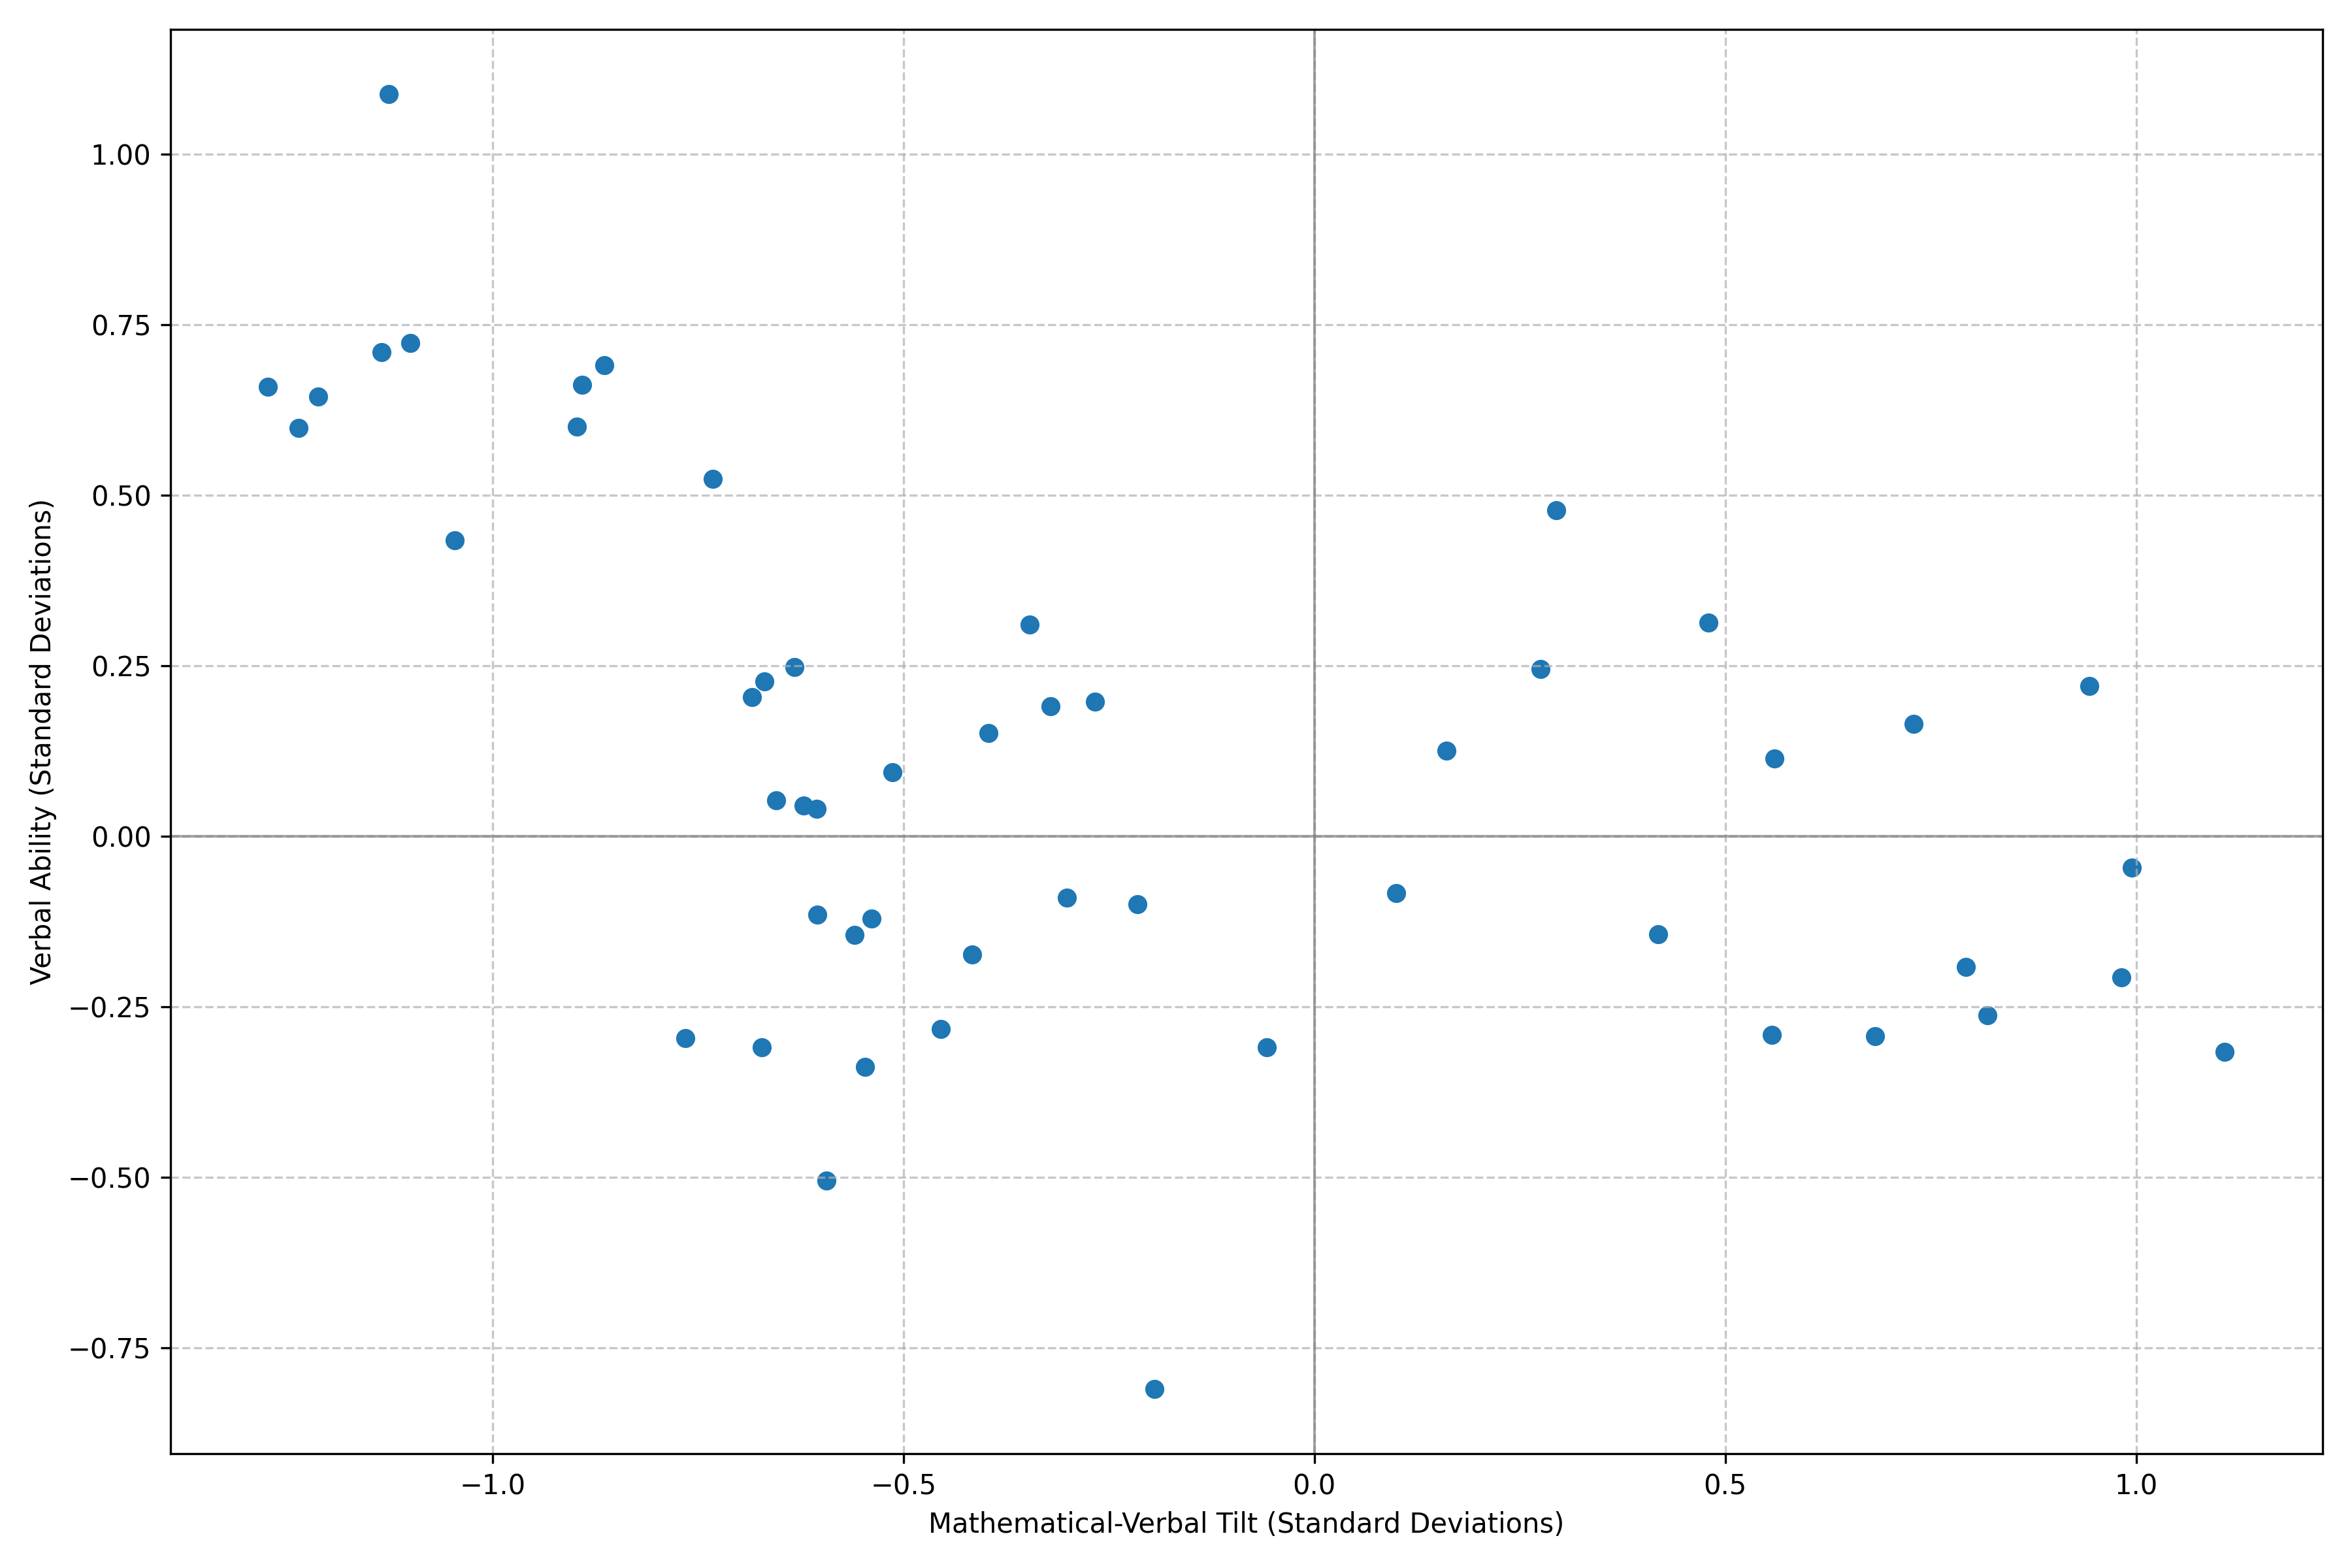
Verbal ability, however, doesn’t follow this pattern: majors appear in all quadrants of a tilt-verbal graph, and the correlation between verbal ability and math tilt is -0.48.
Two patterns stand out:
- A major’s average intelligence relates more strongly to its average math ability than to its average verbal ability.
- Low-IQ math-tilted majors are rare.
The gap disappears once gender is accounted for. Women outnumber men in college enrollment (8.9 million vs. 6.5 million in 20211) and graduation (1.1 million vs. 0.8 million bachelor’s degrees in 20222). Men who reach graduate testing are more filtered: among 2023 SAT-takers, women outnumbered men (966,726 vs. 936,481), outscored men on the verbal section by 0.05 SD, while men outscored women on the math section by 0.12 SD3. On the GRE, US citizen test-takers were 62% women, but men outscored women by 0.50 SD in math and 0.43 SD in verbal4. Foreign test-takers—69% of the pool—were 60% men, scored 1.12 SD higher in math than US citizens, and skewed the overall GRE sample toward higher-IQ, math-tilted men4.
This explains the missing low-IQ, math-tilted majors: lower-IQ men are less likely to take the GRE, while higher-IQ foreign men with strong math tilts are overrepresented. Controlling for gender reverses the tilt-IQ correlation (from 0.43 to -0.24) and weakens the math-IQ correlation (from 0.86 to 0.52).
-
NCES Table 303.70 Total undergraduate fall enrollment in degree-granting postsecondary institutions, by attendance status, sex of student, and control and level of institution: Selected years, 1970 through 2023 ↩
-
NCES Table 318.30 Bachelor’s, master’s, and doctor’s degrees conferred by postsecondary institutions, by sex of student and field of study: Academic year 2021-22 ↩
-
A Snapshot of the Individuals Who Took the GRE® General Test, July 2018—June 2023 ↩ ↩2