The Structure of Anime Preferences
I’m on a roll, so now we’re going to look at the structure of anime preferences: how people differ in the anime genres they like and dislike.
How Do Anime Genre Preferences Vary?
We already have the genres, so we can use them to predict people’s tastes in anime. We’ll do the same thing we did in The Structure of Movie Preferences, where we (well, Sol) calculated the preference coefficient prior.
I standardized each person’s ratings in the MyAnimeList dataset, then estimated a population distribution of genre preferences from 223,160 users who had used at least three distinct ratings. Together, they rated 13,738 anime nearly 45 million times.
The interactive below shows the estimated distribution of preference coefficients for each anime genre: how much people tend to like or dislike it on average, and how much tastes vary between users.
Explore the preference prior
How preferences for anime genres vary across users.
Population distribution of preference coefficients
Coefficient units: change in a user's standardized rating when a genre (or the unknown-genre indicator) is present rather than absent, holding the other model features fixed.
Which Genre Preferences Go Together?
We can also observe correlations between anime genre preferences. People who especially like Shounen Ai also tend to like Yaoi; the same goes for Josei and Shoujo, or Drama and Mystery. I used factor analysis to look for broader patterns in these correlations. Parallel analysis for common factors suggested 16, using the genre preferences but not the genre-adjusted consensus we’ll get to below.
The interactive below lets you explore the preference factors, see which anime genres contribute to each one, find anime that distinguish each factor, and examine how the factors correlate with one another.
Explore the preference factors
How anime-genre preferences vary together across users.
Genre-preference coefficient loadings
Standardized pattern loadings · click a coefficient to explore it above
Anime that distinguish this factor
Change in predicted standardized rating for +1 SD on this preference factor, holding the others fixed
Who Likes “Good” Anime?
Modeling genre preferences allows us to do something interesting: estimate how ‘good’ various anime are after accounting for their genres. For example, we might suspect people are unfairly prejudiced against yaoi. So we might want to see how ‘good’ a particular yaoi anime is after accounting for people’s general dislike of the genre.
For each anime, I took its smoothed average rating, subtracted the rating predicted by its genres, and standardized the difference across anime. This genre-adjusted consensus tells us which anime people like more or less than we’d expect from their genres. Here are selected examples with at least 100,000 MyAnimeList members and 5,000 training-user ratings each. The scores are in SDs across anime.
More liked than their genres suggest
- Perfect Blue+3.95 SD
- Steins;Gate+3.73 SD
- Devilman Crybaby+3.59 SD
- Legend of the Galactic Heroes+3.29 SD
- Princess Mononoke+3.01 SD
- Wolf Children+3.00 SD
- Hunter x Hunter (2011)+2.90 SD
- Neon Genesis Evangelion+2.87 SD
- Gurren Lagann+2.85 SD
- I Want to Eat Your Pancreas+2.83 SD
Less liked than their genres suggest
- Pupa−3.88 SD
- Taboo Tattoo−2.52 SD
- Boku no Pico−2.23 SD
- The Lost Village−2.04 SD
- Diabolik Lovers−1.98 SD
- Tokyo Ghoul:re (second season)−1.96 SD
- King's Game−1.84 SD
- Berserk (2016)−1.76 SD
- Dragon Ball GT−1.49 SD
- School Days−1.43 SD
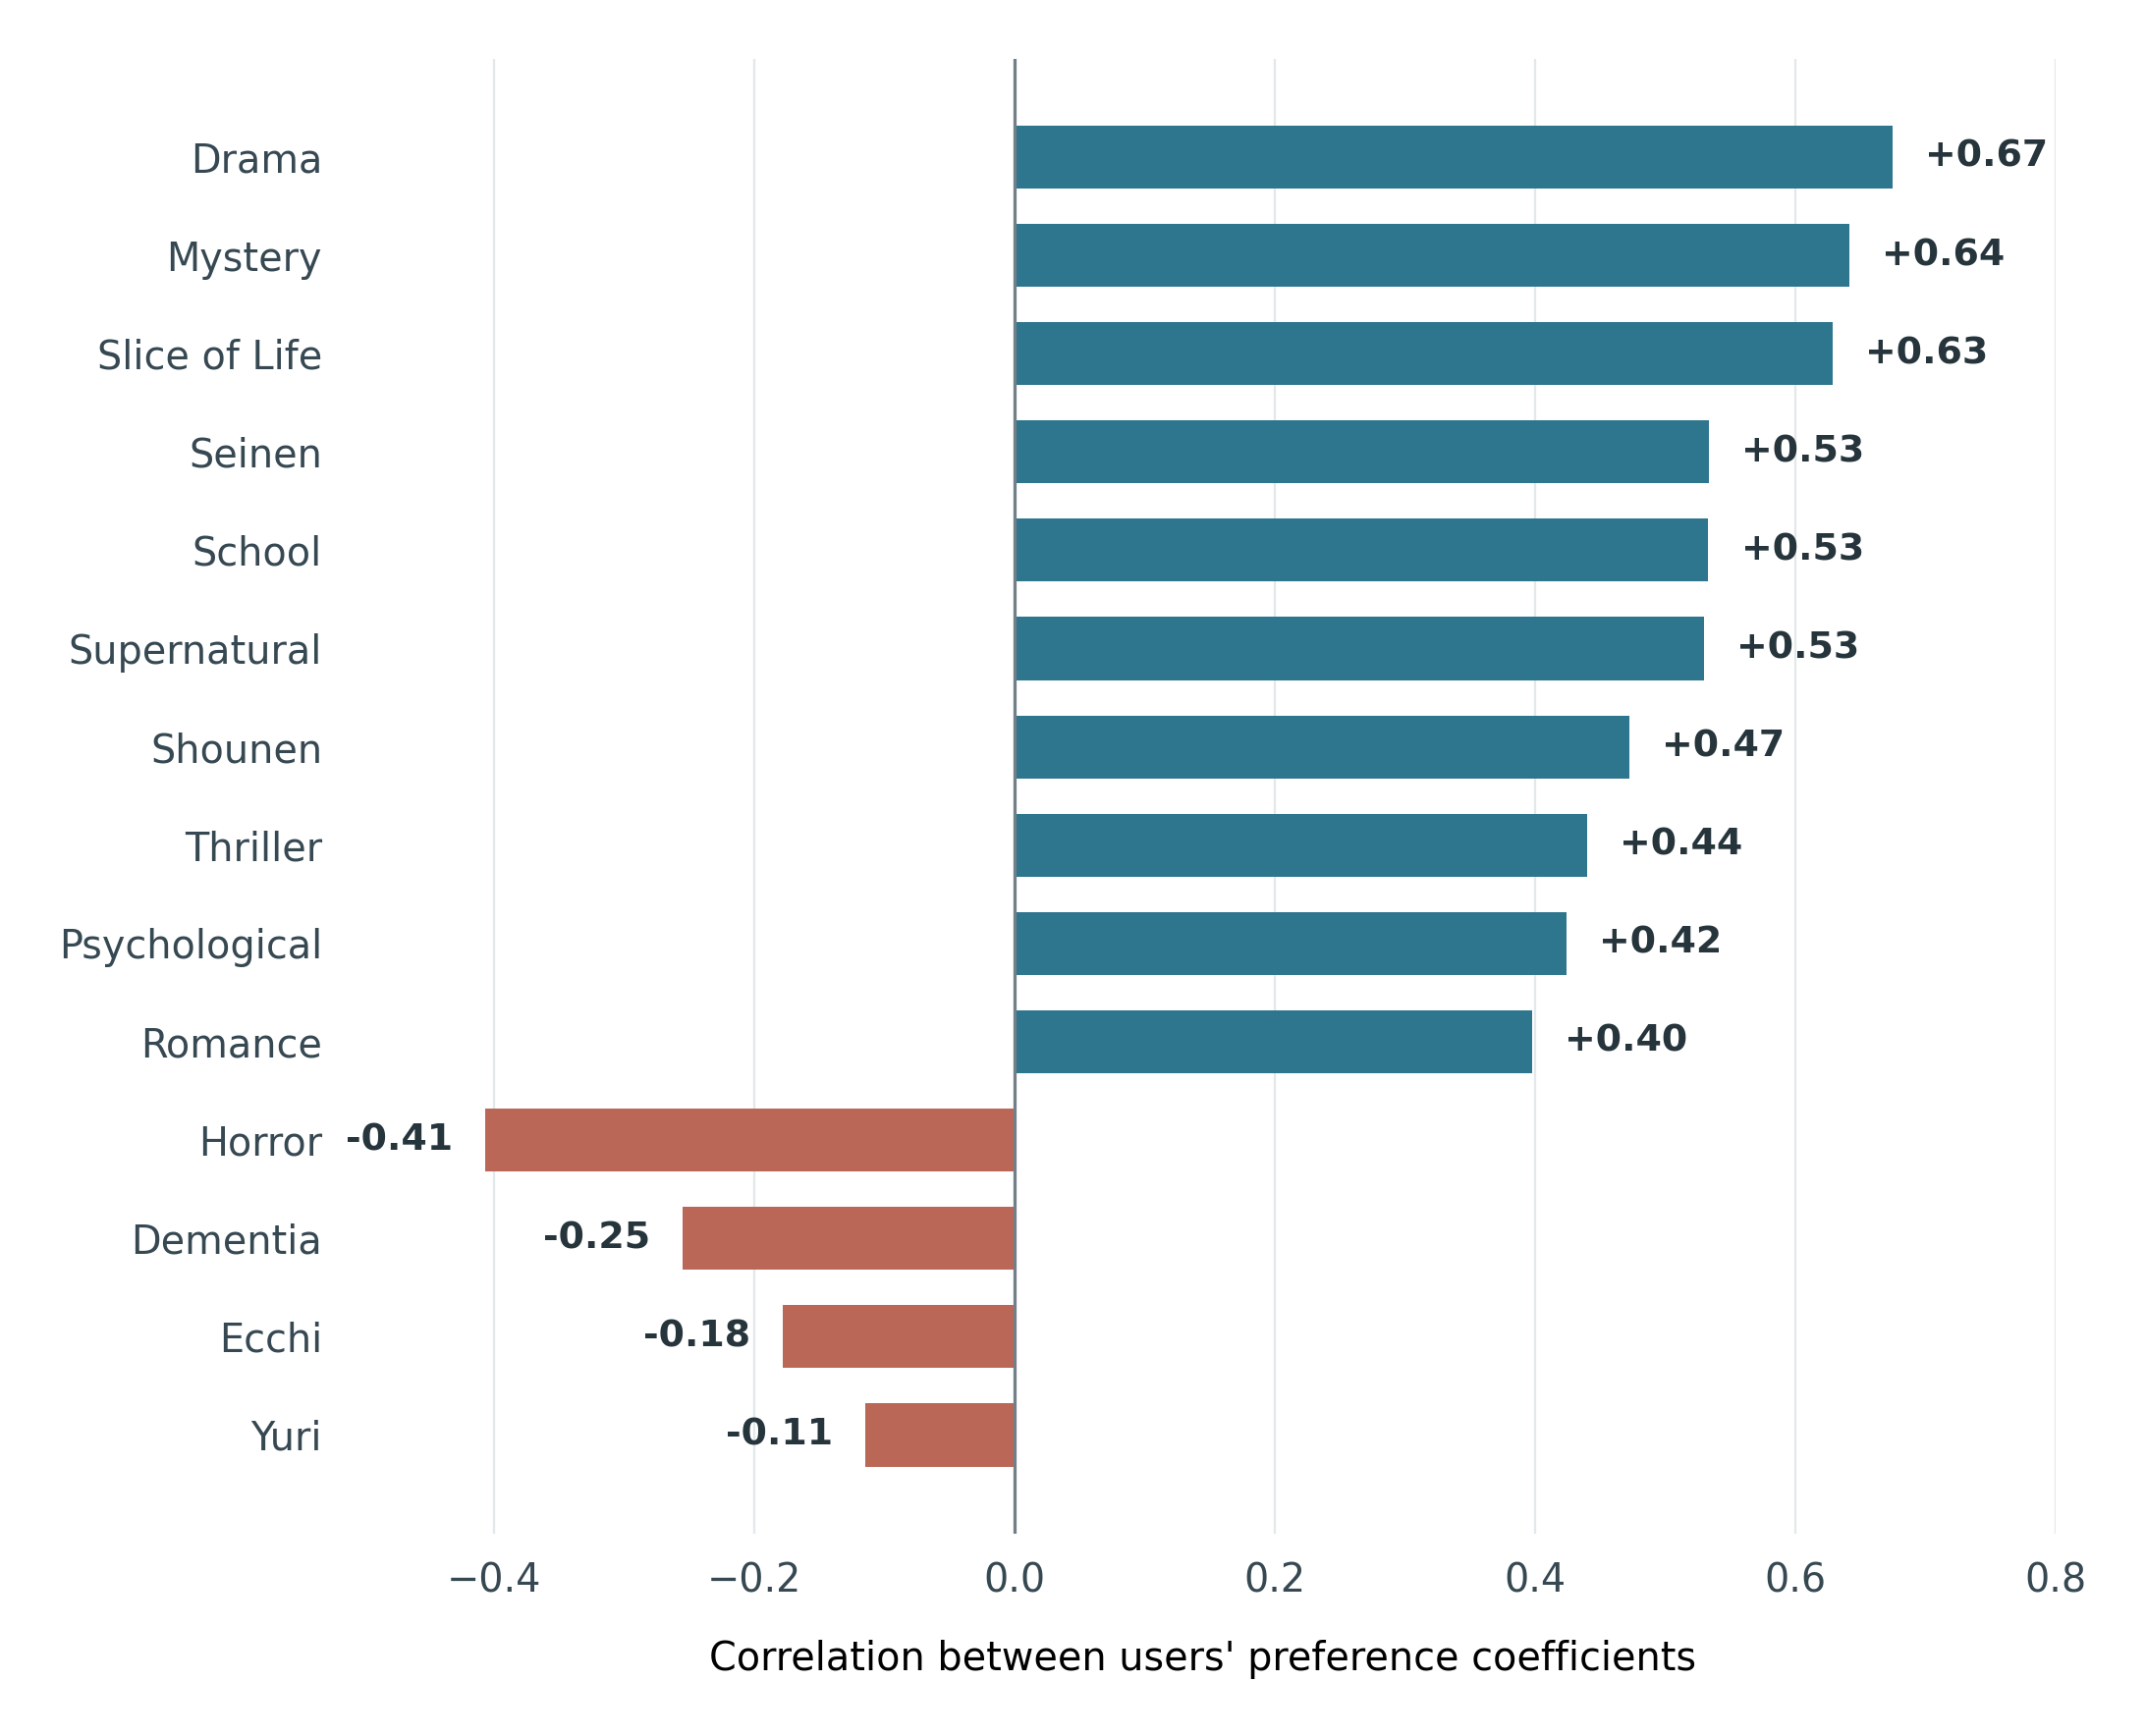
We might also wonder what kinds of users have ‘good taste.’ If we use agreement with other viewers as a rough definition, which genre preferences go along with it? The chart shows the strongest correlations between users’ genre-preference coefficients and their genre-adjusted consensus coefficients. People who especially like Drama, Mystery, and Slice of Life tend to agree more with the consensus; Horror enjoyers tend to agree less.